

























Home Asking Price Index, January 2014: calm before the storm, a property market in crisis
Housing stock for sale in England and Wales hit a record low in January 2014, while average asking prices rose 6.2% annually amid severe supply shortages.
This is the January 2014 edition of the Home Asking Price Index, released on 14 January 2014, under the headline:
Calm Before the Storm: A Property Market in Crisis
The headlines and summary below are the report's own words, with the key figures as it published them, followed by the report's charts and regional tables as printed.
Headlines
- Supply of property for sale being placed on the market tumbles to the lowest level ever recorded by this index
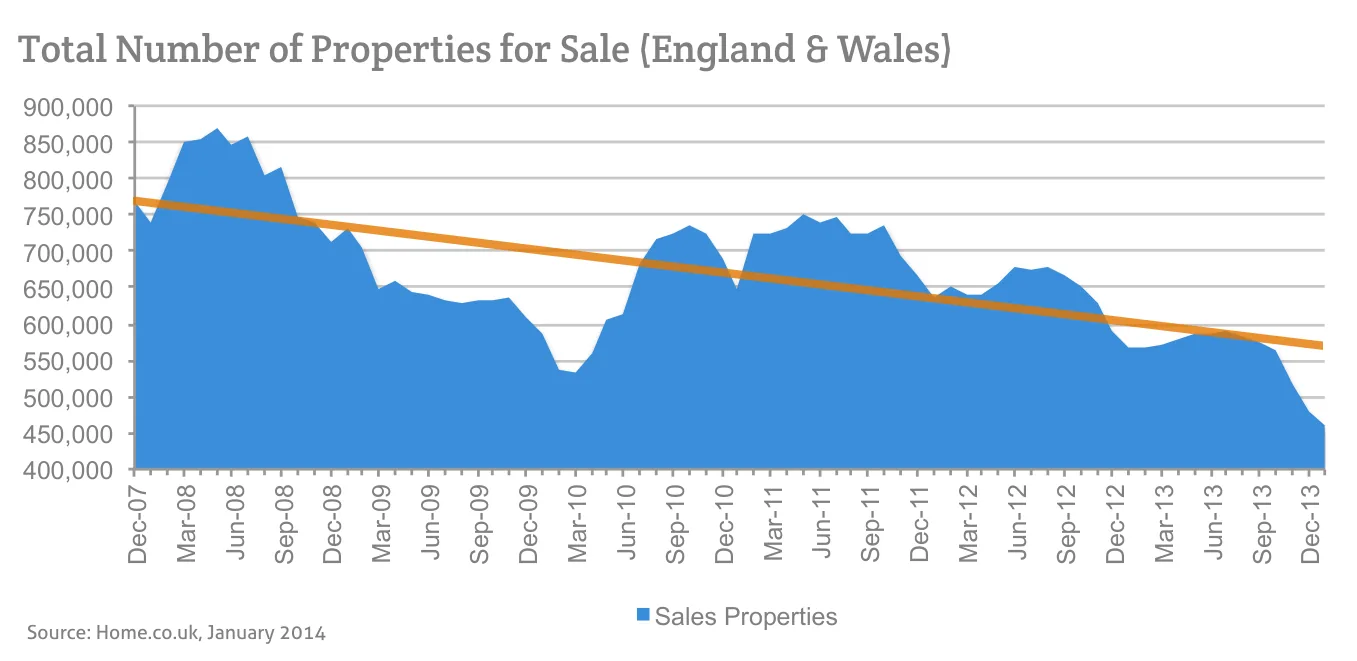
- Correspondingly, the overall total of property for sale has plunged to another all-time low and now stands 38% lower than in January 2008
- Average asking price for England and Wales shows no change from last month but is up 6.2% on January 2013, a new post-crisis high
- Further pressure is being placed on prices in the North of England and Scotland which are recording an average monthly drop of 0.3%
- London again defies the wider market trends, posting a month-on-month price rise of 0.4%. Annual price inflation in the capital now stands at a staggering 14.7%
Summary
Given the seasonal downturn, it is usual for prices to slip month-on-month. When prices hold firm at this time of the year, it is a strong signal that demand is strong and vendors are confident overall. However, a serious threat continues to haunt the market which makes the start of 2014 both daunting and unique. The stock drought not only continues but has worsened again to hit another record low as vendors still hold back from entering the market. The average buyer's choice of property for sale is severely restricted (especially in London and the South East) and is now 38% less than in January 2008. In turn, this severe property drought continues to erode affordability, with annual rises across England and Wales now running at 6.2%, the highest house price inflation seen since the financial crisis. Compare that figure to the current average public sector wage growth of -0.3% per annum.
The Greater London property market continues to be the major force driving average prices upwards, recording inflation of 21.2% over the past five years, with 14.7% in the last twelve months alone. This is welcome news for property owners, but affordability issues are forcing increasing numbers of buyers to remain in the rental market. Elsewhere in the UK, prices were unchanged or fell back marginally in December 2013. Annual price changes in most regions of England and Wales remain positive, although in the North of England and Scotland, house prices are still in decline, reflecting the poorer economic outlook in these areas.
Key figures
| Measure | Figure |
|---|---|
| Average asking price (England & Wales) | £246,714 |
| Monthly change (England & Wales) | 0.0% |
| Annual change (England & Wales) | 6.2% |
| Total stock vs January 2008 | -38% |
| New instructions, year-on-year | -7.5% |
| New instructions, five-year | -57.2% |
| Home Market Turnover Indicator | 1,890 properties per day |
| Typical time on market, two-year change | -9% |
Figures are for England and Wales unless the report states otherwise, as published in the edition.
Charts from the report
Source: Home.co.uk, January 2014
Source: Home.co.uk, January 2014
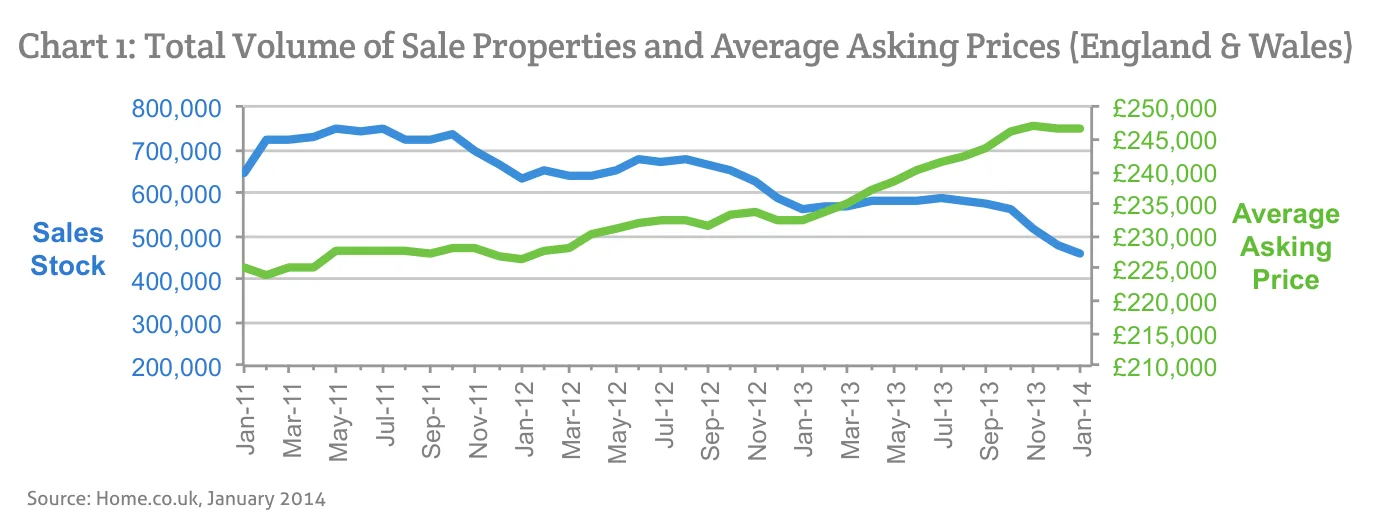
Source: Home.co.uk, January 2014
Regional tables
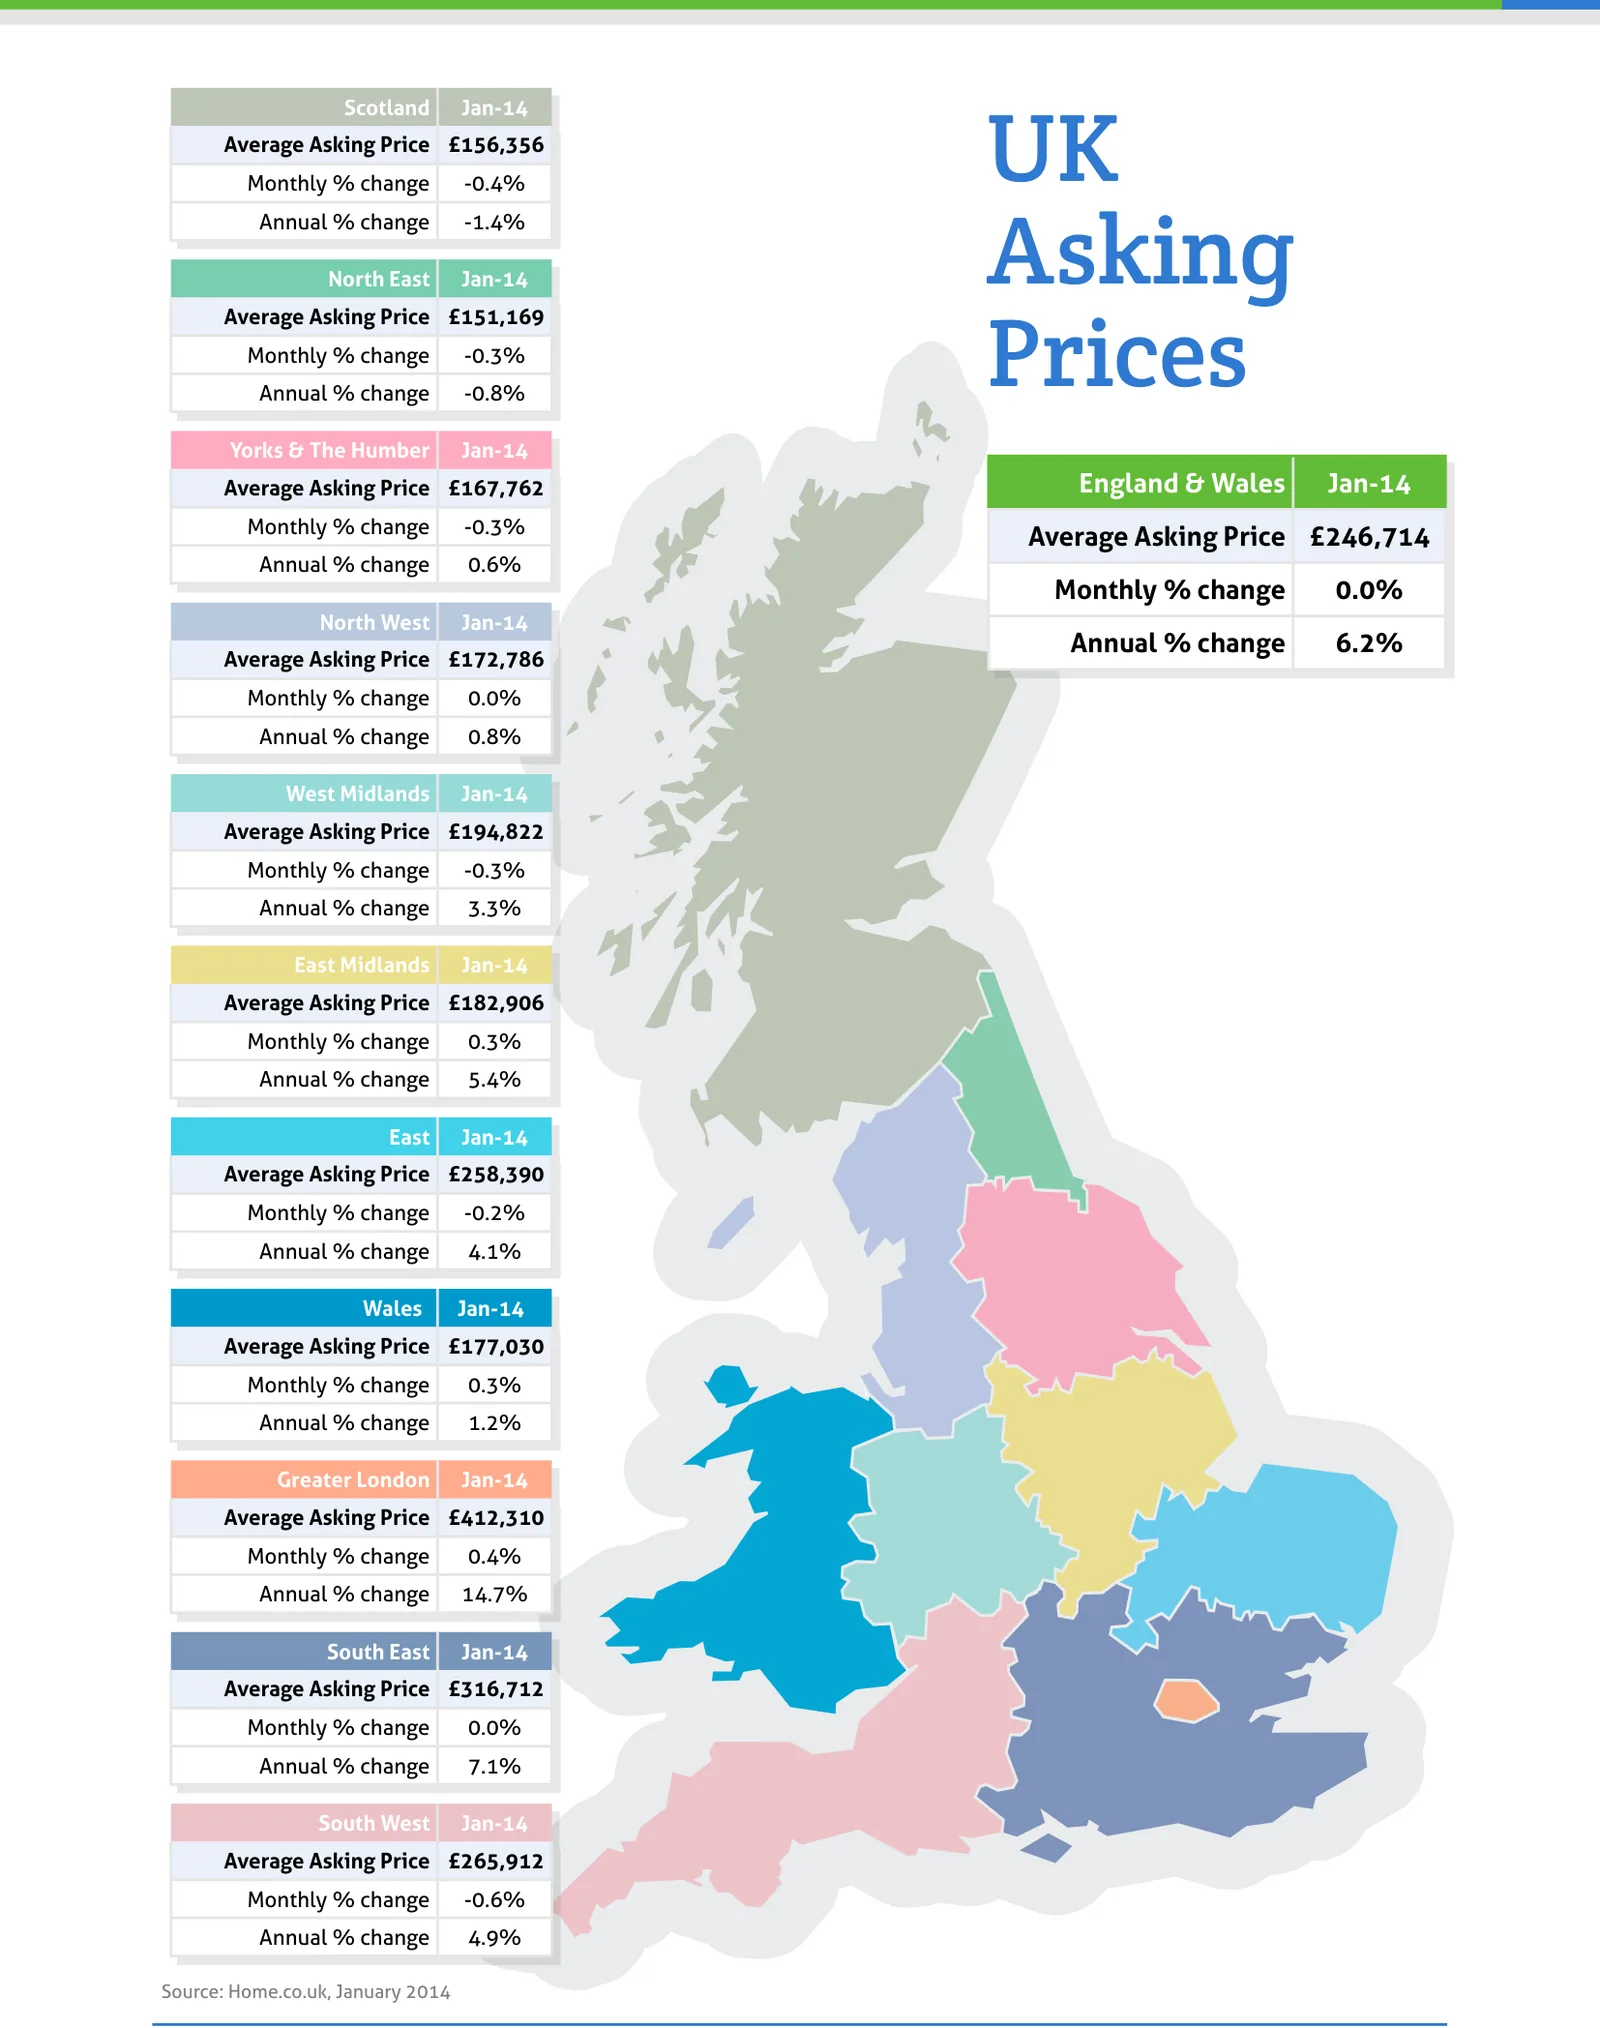
UK Asking Prices, Jan-14
| Region | Average Asking Price | Monthly % change | Annual % change |
|---|---|---|---|
| Scotland | £156,356 | -0.4% | -1.4% |
| North East | £151,169 | -0.3% | -0.8% |
| Yorks & The Humber | £167,762 | -0.3% | 0.6% |
| England & Wales | £246,714 | 0.0% | 6.2% |
| North West | £172,786 | 0.0% | 0.8% |
| West Midlands | £194,822 | -0.3% | 3.3% |
| East Midlands | £182,906 | 0.3% | 5.4% |
| East | £258,390 | -0.2% | 4.1% |
| Wales | £177,030 | 0.3% | 1.2% |
| Greater London | £412,310 | 0.4% | 14.7% |
| South East | £316,712 | 0.0% | 7.1% |
| South West | £265,912 | -0.6% | 4.9% |
From the director's commentary
"Once the UK's public investment in housing had been largely privatised, the writing was on the wall. Landlords, almost always more creditworthy than first-time buyers, effectively remove the stock from the resale market and, in turn, bloat the private rental market."
Doug Shephard, Director at Home.co.uk
Read the full January 2014 edition (PDF, 5 pages)
About the Home Asking Price Index
The Home Asking Price Index measures the change in the prices sellers ask for residential property across England, Wales and Scotland. Today it is computed every month from around half a million advertised homes and is mix-adjusted, so a change in what happens to be on the market does not move the figure; earlier editions state the sample they were built from. Because an asking price is set months before a sale completes, the index runs around five months ahead of completed-sale measures such as the UK House Price Index.
Every edition in the archive, back to October 2006, is listed on the index page. How we measure the UK property market explains the listing data behind it, and today's figures by area are on house prices and rental prices.
Text and figures above are quoted from the January 2014 edition as published, with punctuation normalised for the web, and are not revised. Later editions may restate them.
More in What is happening to house prices: the Home guide
Thinking about your next move?
See what your home's worth in seconds, with the UK's longest-running property data behind it.
Get an instant valuation