

























Home Asking Price Index, February 2023: prices stabilising and stock levels heading back to normal
Asking prices in England and Wales fell 0.2% in January, leaving annual growth at 1.3%, while unsold stock rose to 369,053 and marketing times lengthened to 100 days.

This is the February 2023 edition of the Home Asking Price Index, released on 15 February 2023, under the headline:
Prices Stabilising and Stock Levels Heading Back to Normal
The headlines and summary below are the report's own words, with the key figures as it published them, followed by the report's charts and regional tables as printed.
Headlines
- Asking prices across England and Wales dipped by a slight 0.2% during January following the surprise bounce of 0.6% in December, making the year-on-year growth just 1.3%.
- Asking prices rose in six English regions and Scotland during January.
- The number of properties withdrawn from the market has fallen for the second consecutive month since the peak in November, although total withdrawals were still 56% higher last month than in January 2022.
- Following a contraction in December, the total sales stock count for England and Wales swelled in January by nearly 16,000 to reach 369,053, although this total remains less than the 10-year average of 423,417.
- The supply of new instructions remains moderate overall, with just 1% growth last month compared to January 2022.
- The Typical Time on Market for unsold property in England and Wales rose again during January, adding six days to make the median 100 days, which is comparatively short for this time of year.
- Eight English regions, Scotland and Wales now show elevated median marketing times compared to February 2022 when the market was roaring ahead. In stark contrast, Greater London shows a year-on-year reduction.
- The Scottish property market now leads in annualised regional price growth (5.9%), ahead of Yorkshire at 5.3%.
- Rents across Greater London are up 21% year-on-year. Lack of supply is still a major problem but the pace of the rent hikes is slowing (especially in the more central boroughs), suggesting that affordability limits have been reached.
- The current new growth leaders in asking rents are the outer London boroughs of Harrow, Redbridge and Brent (+35%, +34% and +34% annualised respectively).
Summary
Time on Market for unsold property has increased swiftly over recent months to 100 days, but this figure is 16 days less than in February 2020.
UK home prices adapted quickly to higher mortgage rates during the latter part of 2022 and look set to stabilise over the coming months. The 0.2% dip in asking prices during January may well have already factored in this month's further hike in the Bank of England base rate, which was widely anticipated. Further minor adjustments in asking prices may follow depending on the strength of demand, which typically increases in the spring months.
The vital signs of the market are reassuring and counter the doom and gloom forecasts trumpeted by institutions and pundits that should know better. After all, real mortgage rates are still highly negative and this provides an unprecedented tailwind for the sales market. Moreover, the chronic housing shortage (both rental and sales) has not gone away. If anything, it has worsened due to supply chain problems and higher financing costs for builders.
Key figures
| Measure | Figure |
|---|---|
| Monthly change in asking prices | -0.2% |
| Annual change in asking prices | +1.3% |
| Typical Time on Market | 100 days |
| Total unsold stock | 369,053 |
| New instructions growth | +1% |
| New instructions count | 93,000 |
| Increase in withdrawals year-on-year | +56% |
Figures are for England and Wales unless the report states otherwise, as published in the edition.
Charts from the report
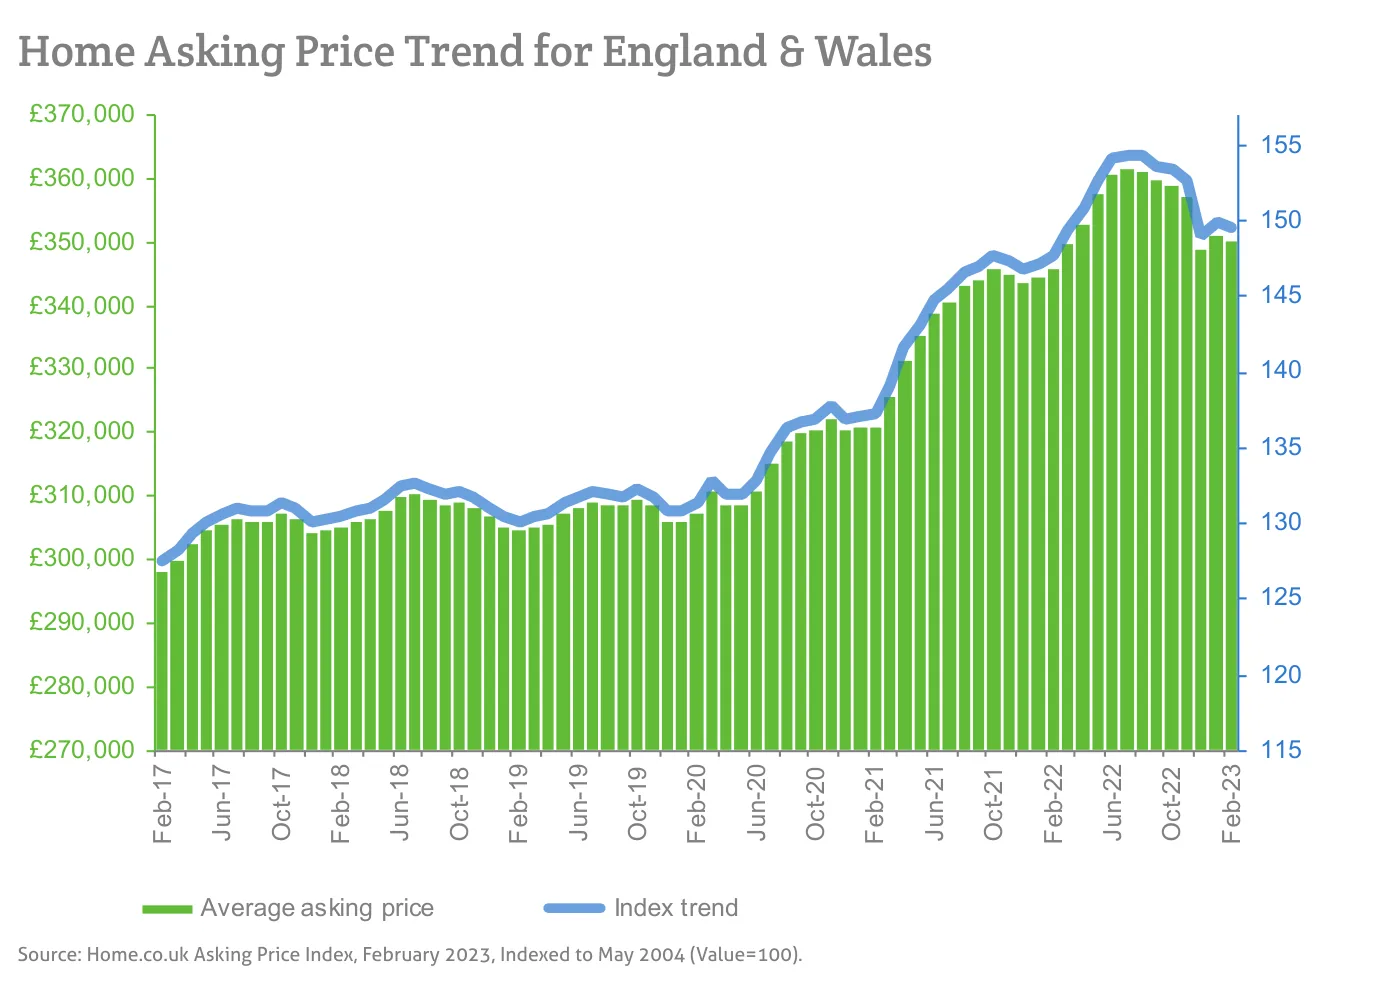
Source: Home.co.uk Asking Price Index, February 2023, Indexed to May 2004 (Value=100).
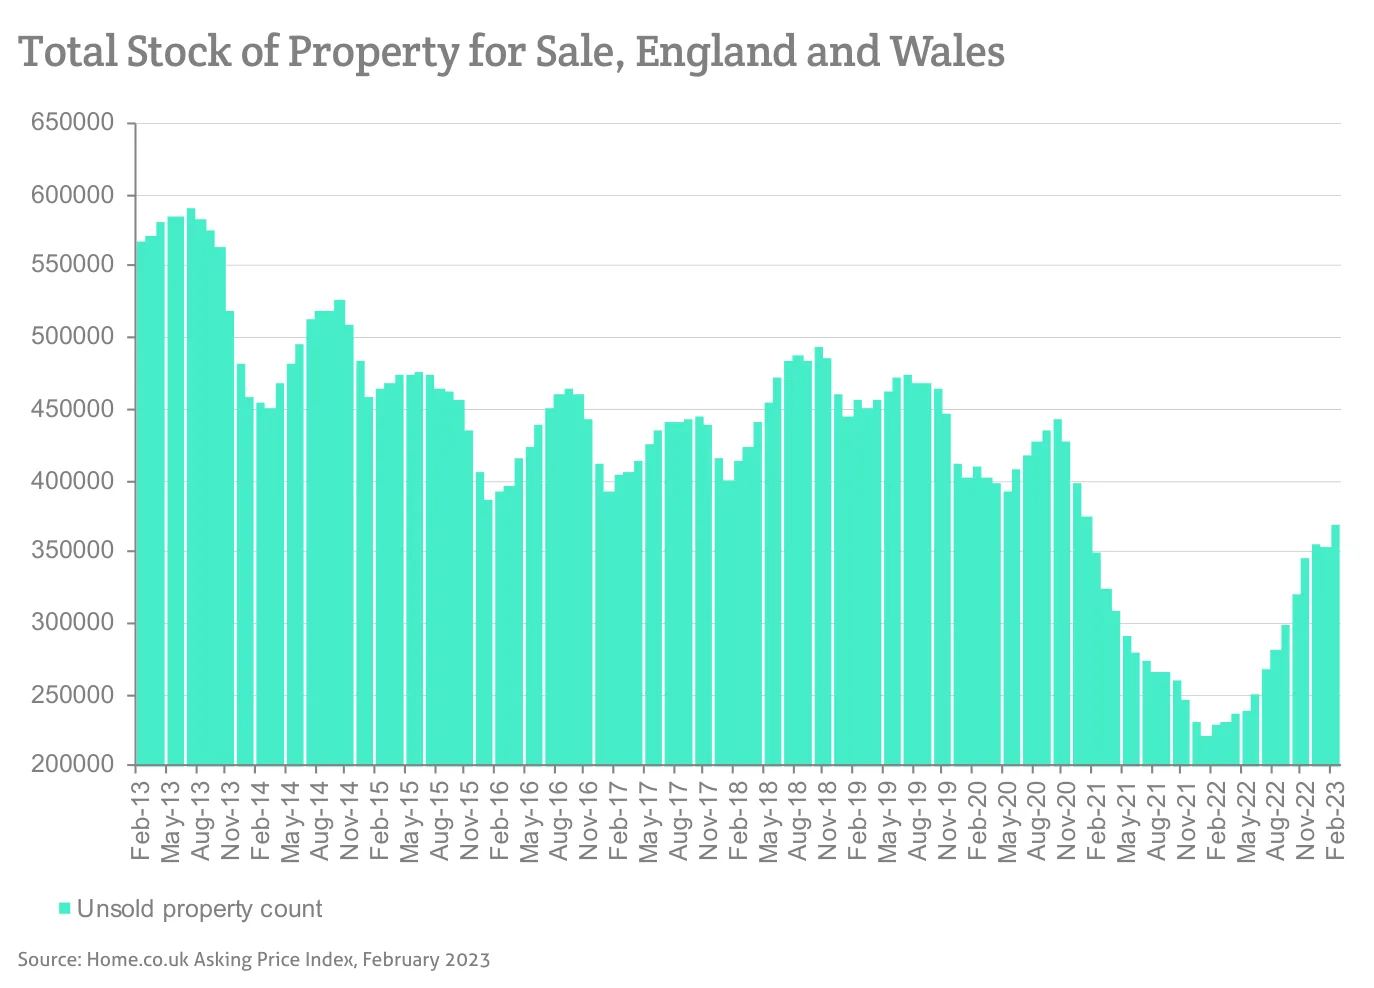
Source: Home.co.uk Asking Price Index, February 2023
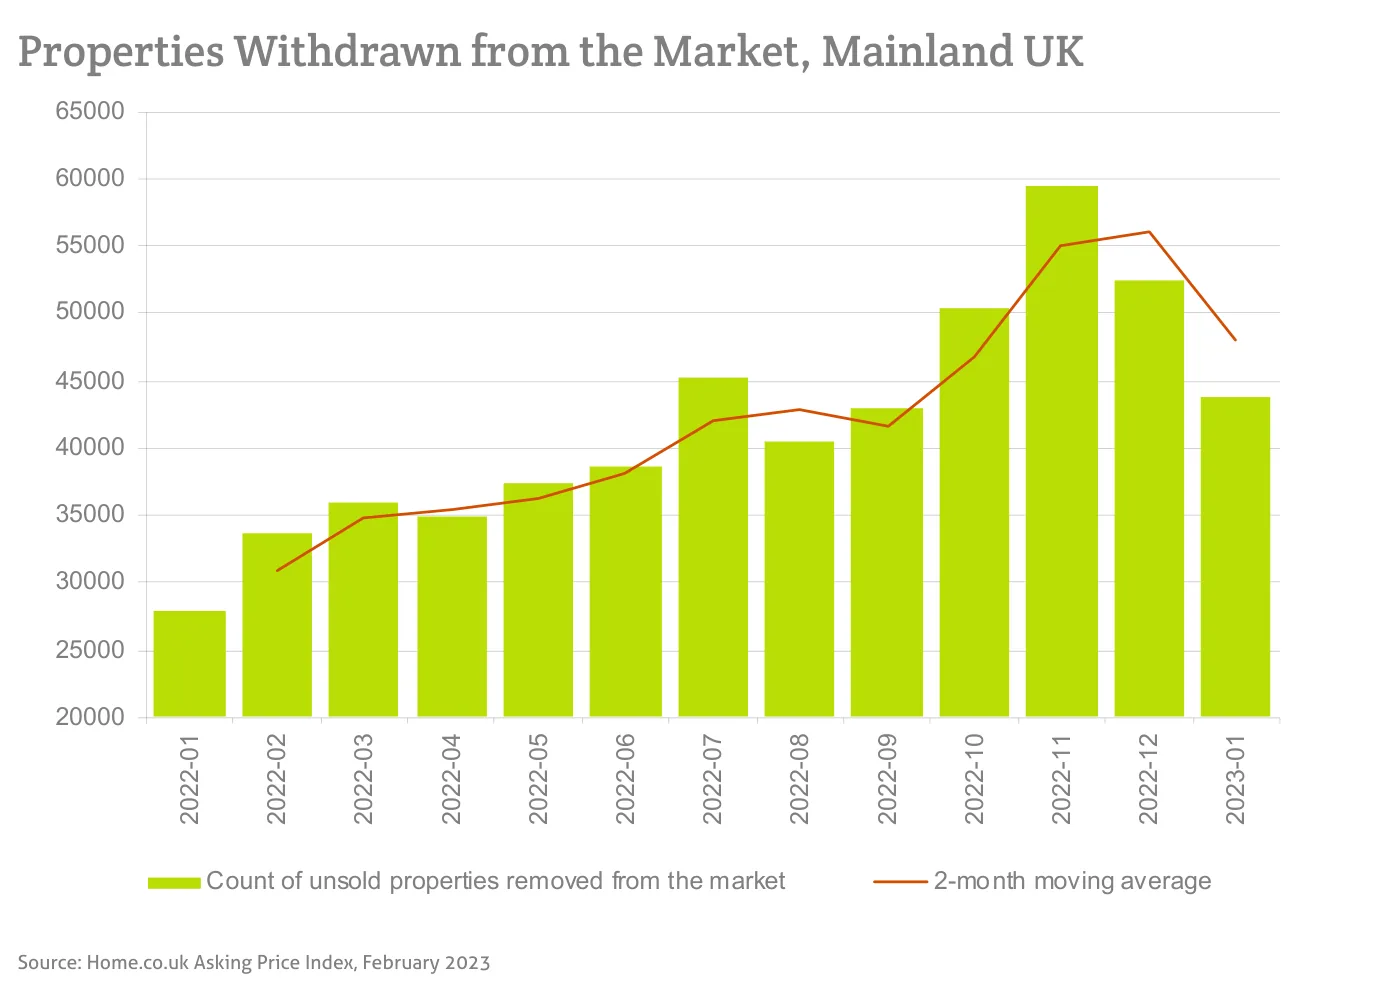
Source: Home.co.uk Asking Price Index, February 2023
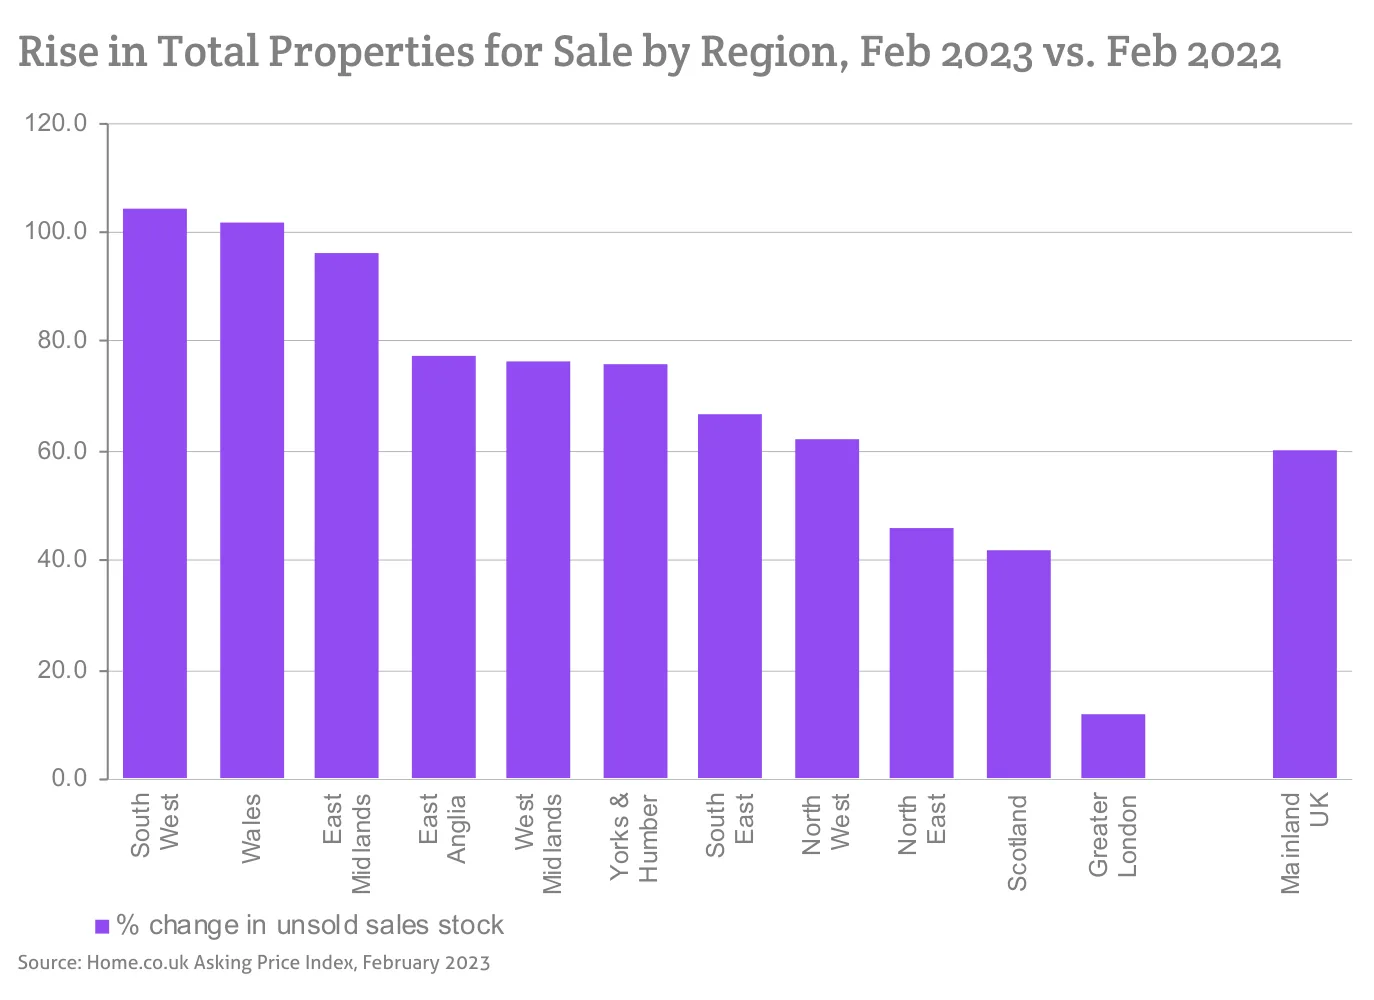
Source: Home.co.uk Asking Price Index, February 2023
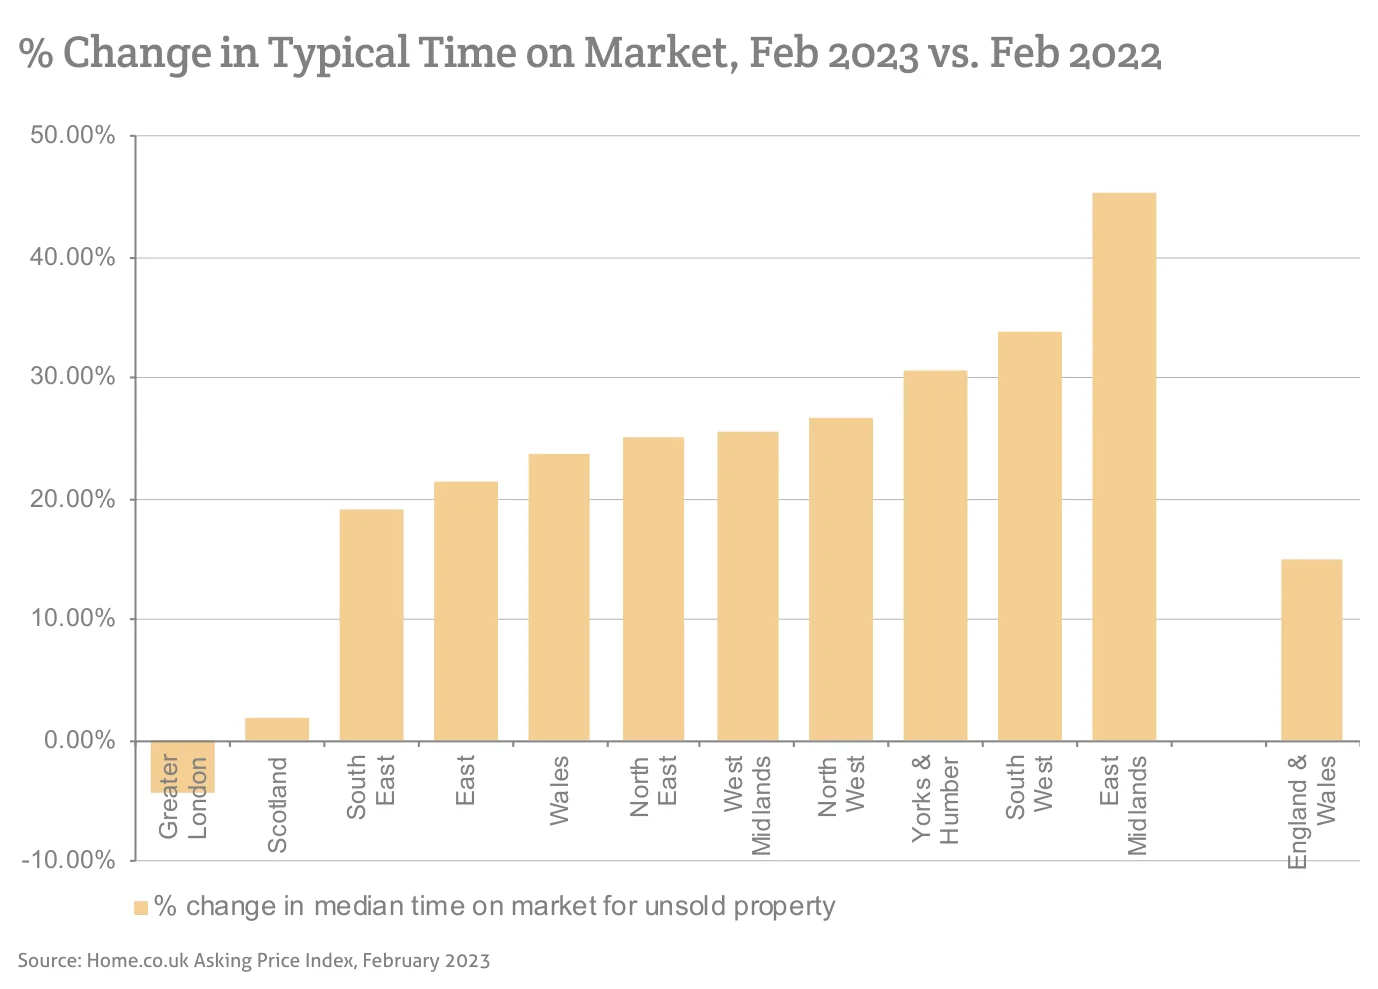
Source: Home.co.uk Asking Price Index, February 2023
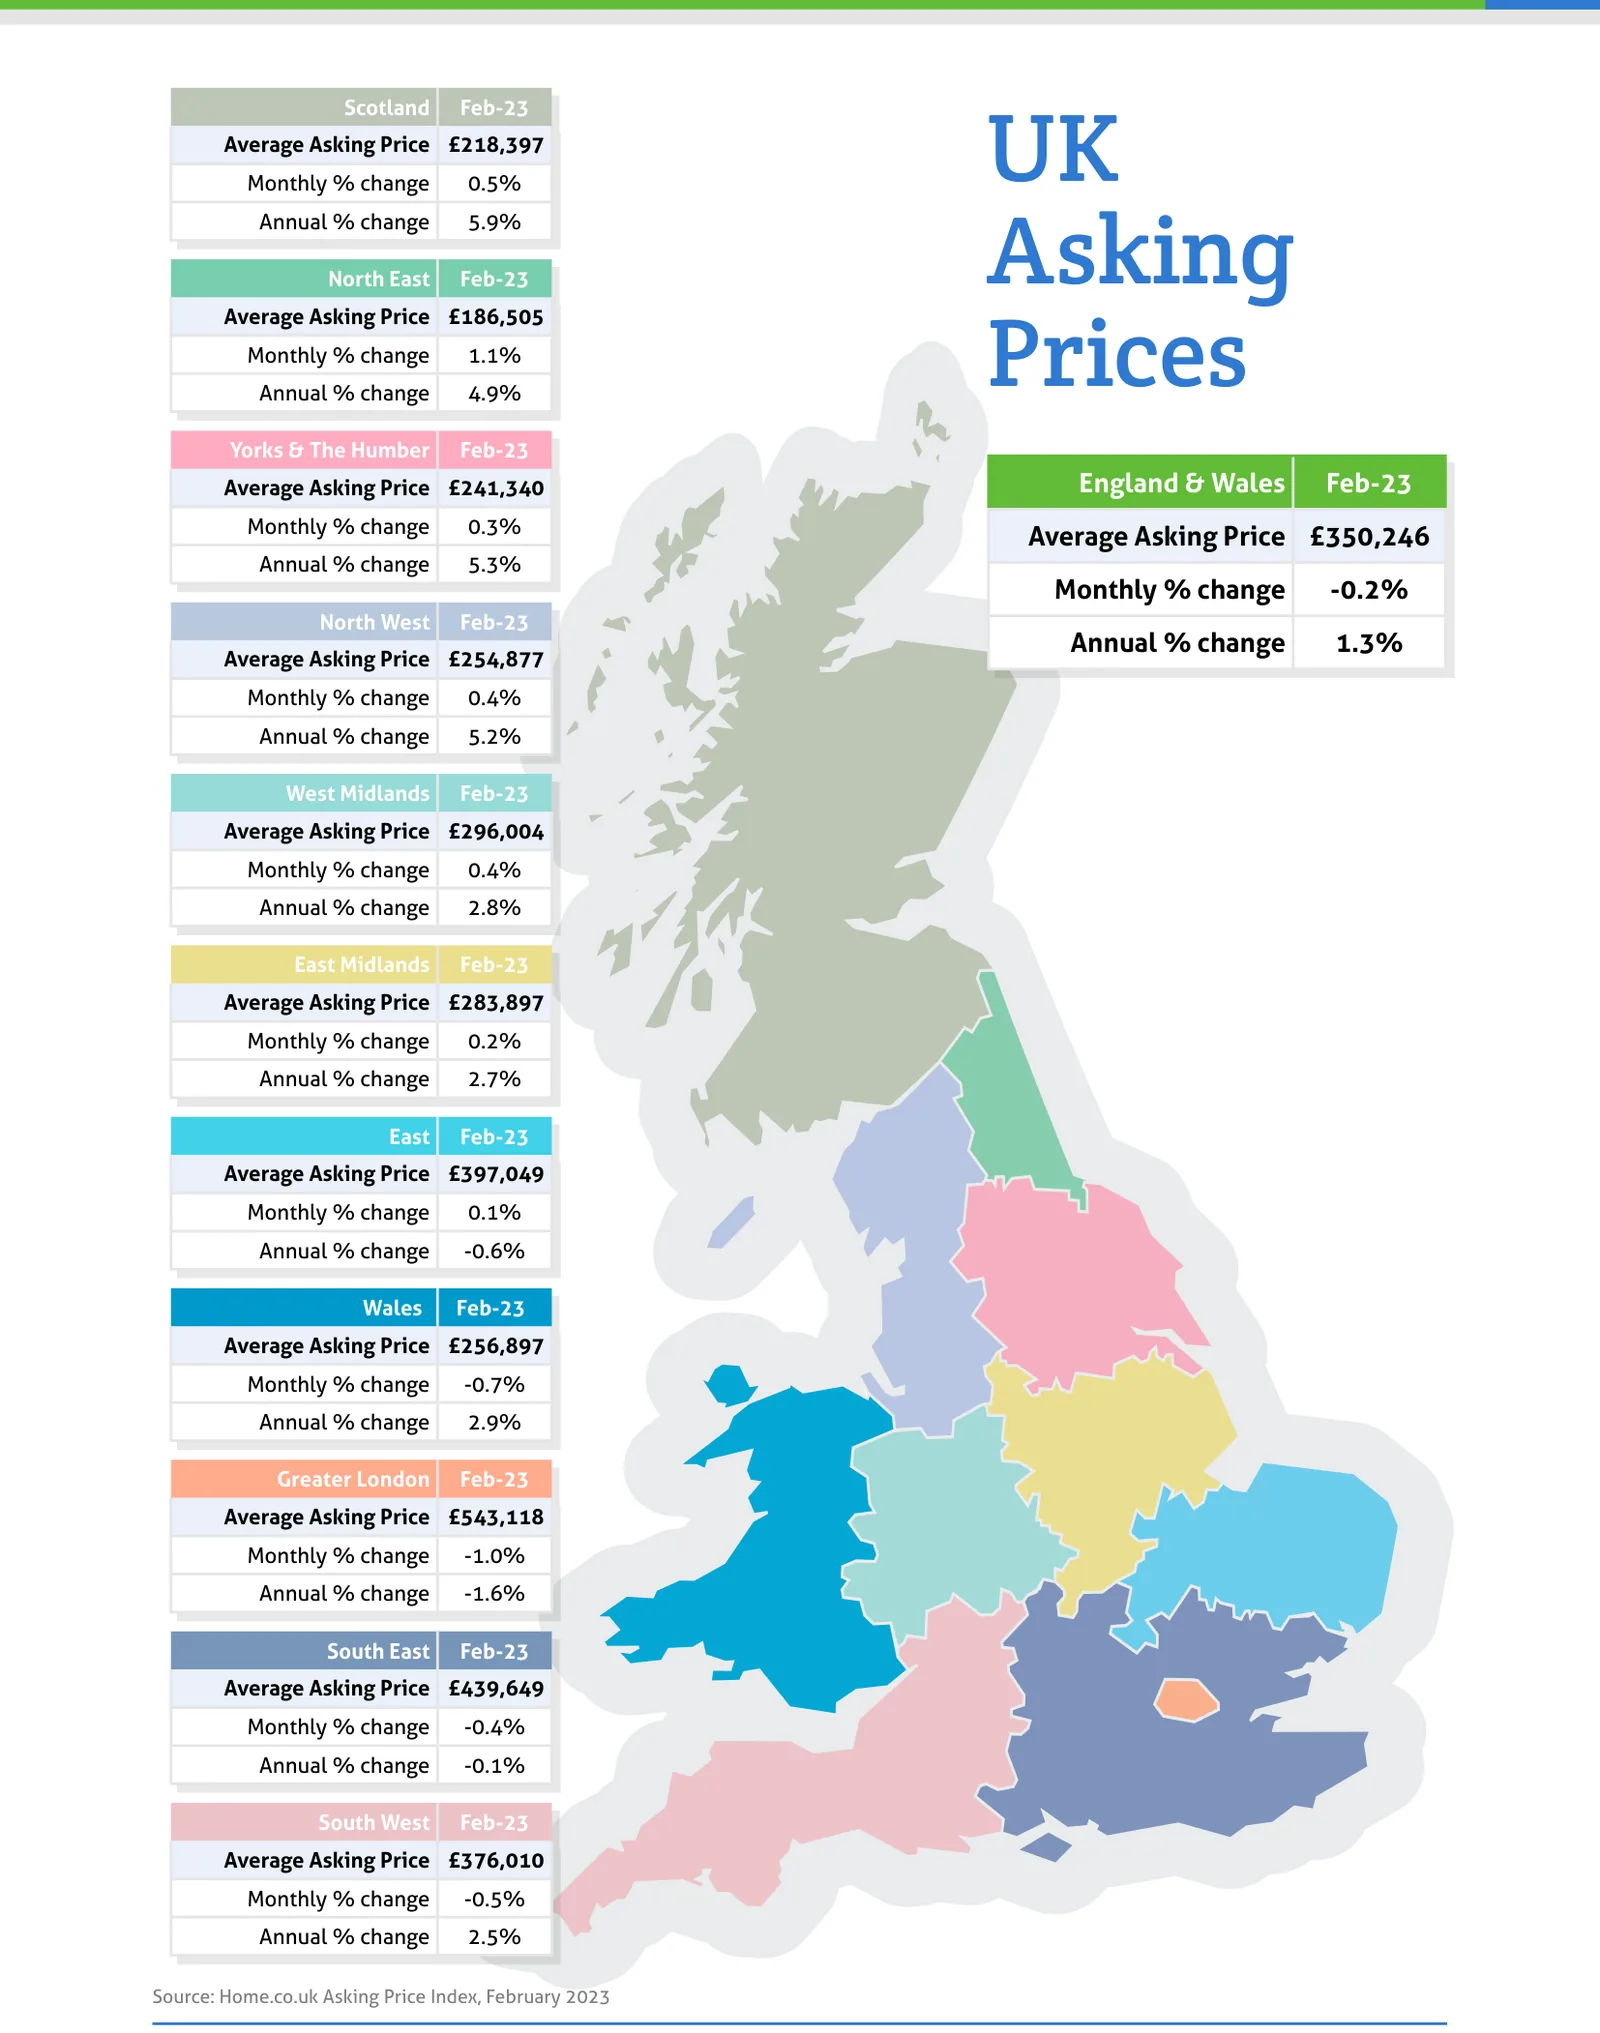
Source: Home.co.uk Asking Price Index, February 2023
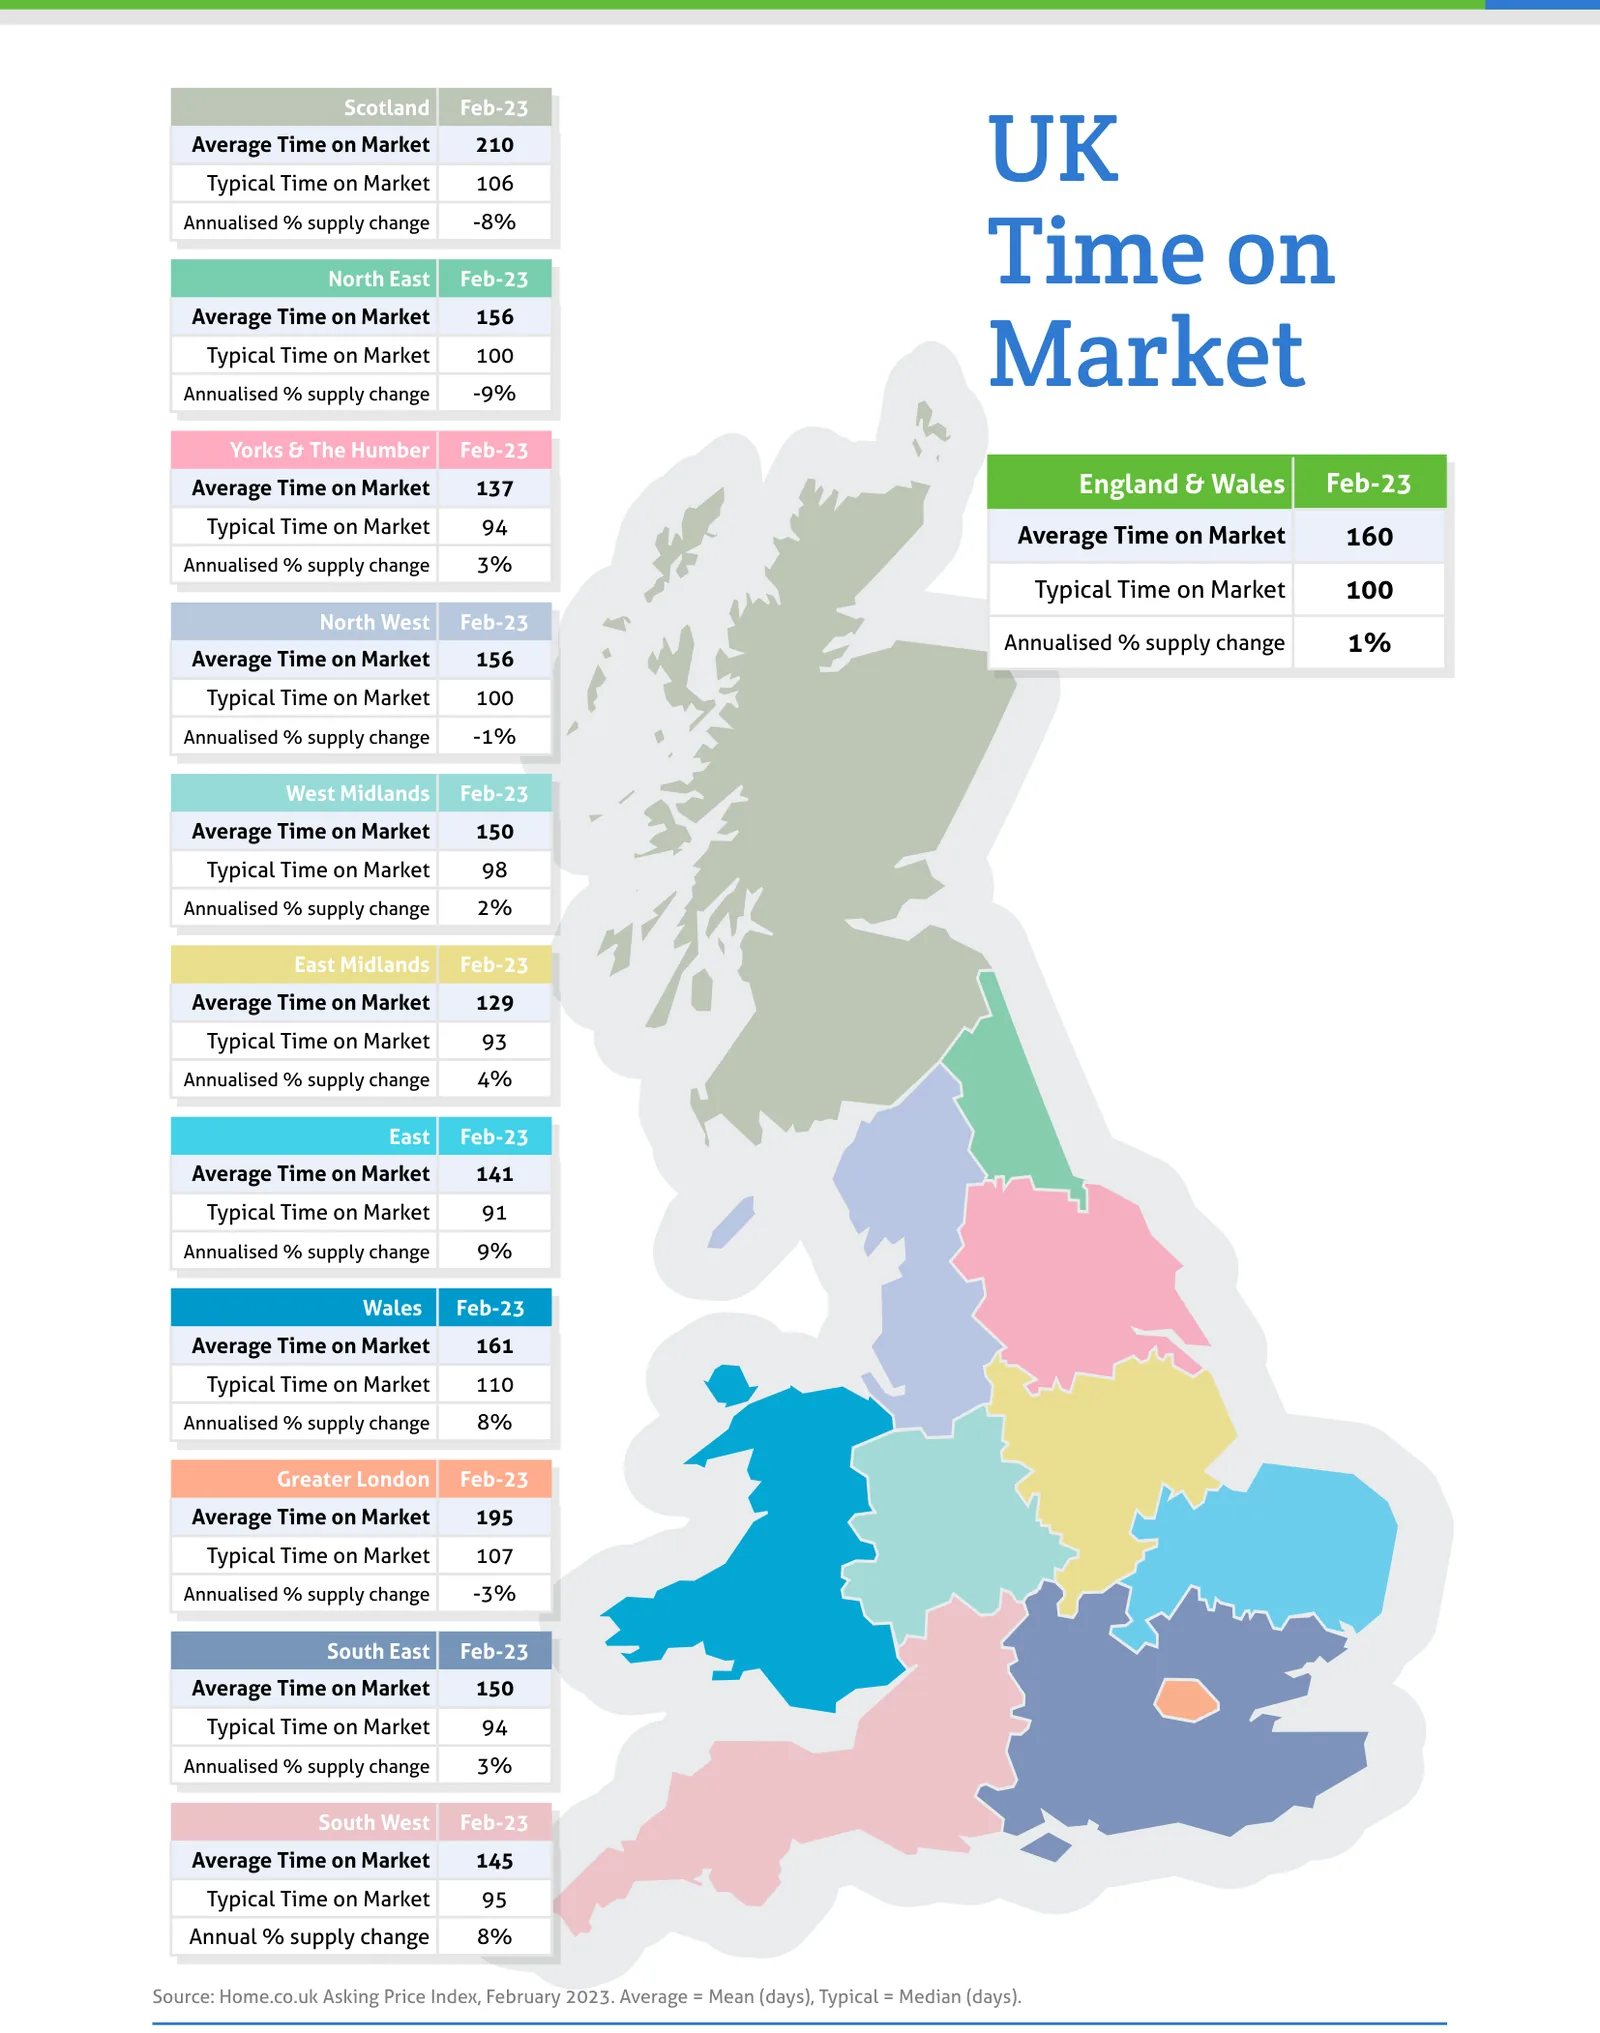
Source: Home.co.uk Asking Price Index, February 2023. Average = Mean (days), Typical = Median (days).
Regional tables
UK Asking Prices, Feb-23
| Region | Average Asking Price | Monthly % change | Annual % change |
|---|---|---|---|
| Scotland | £218,397 | 0.5% | 5.9% |
| North East | £186,505 | 1.1% | 4.9% |
| Yorks & The Humber | £241,340 | 0.3% | 5.3% |
| England & Wales | £350,246 | -0.2% | 1.3% |
| North West | £254,877 | 0.4% | 5.2% |
| West Midlands | £296,004 | 0.4% | 2.8% |
| East Midlands | £283,897 | 0.2% | 2.7% |
| East | £397,049 | 0.1% | -0.6% |
| Wales | £256,897 | -0.7% | 2.9% |
| Greater London | £543,118 | -1.0% | -1.6% |
| South East | £439,649 | -0.4% | -0.1% |
| South West | £376,010 | -0.5% | 2.5% |
UK Time on Market, Feb-23
| Region | Average Time on Market | Typical Time on Market | Annualised % supply change |
|---|---|---|---|
| Scotland | 210 | 106 | -8% |
| North East | 156 | 100 | -9% |
| Yorks & The Humber | 137 | 94 | 3% |
| England & Wales | 160 | 100 | 1% |
| North West | 156 | 100 | -1% |
| West Midlands | 150 | 98 | 2% |
| East Midlands | 129 | 93 | 4% |
| East | 141 | 91 | 9% |
| Wales | 161 | 110 | 8% |
| Greater London | 195 | 107 | -3% |
| South East | 150 | 94 | 3% |
| South West | 145 | 95 |
The report also prints 'Annual % supply change' in 1 of its 12 region boxes (South West 8%), so it is not a column of this table.
From the director's commentary
"The latest 0.5% hike in the base rate by the Bank of England was widely anticipated and has had little effect on the mortgage market. Perhaps surprisingly, some mortgage deals have become cheaper, which strongly suggests that the central bank may cut rates sooner rather than later."
Doug Shephard, Director at Home.co.uk
Read the full February 2023 edition (PDF, 10 pages)
About the Home Asking Price Index
The Home Asking Price Index measures the change in the prices sellers ask for residential property across England, Wales and Scotland. Today it is computed every month from around half a million advertised homes and is mix-adjusted, so a change in what happens to be on the market does not move the figure; earlier editions state the sample they were built from. Because an asking price is set months before a sale completes, the index runs around five months ahead of completed-sale measures such as the UK House Price Index.
Every edition in the archive, back to October 2006, is listed on the index page. How we measure the UK property market explains the listing data behind it, and today's figures by area are on house prices and rental prices.
Text and figures above are quoted from the February 2023 edition as published, with punctuation normalised for the web, and are not revised. Later editions may restate them.
More in What is happening to house prices: the Home guide
Thinking about your next move?
See what your home's worth in seconds, with the UK's longest-running property data behind it.
Get an instant valuation