

























Home Asking Price Index, February 2021: prices flatline while supply plunges due to lockdown
Asking prices across England and Wales stayed unchanged in January, annual growth slowed to 4.5%, and new instructions fell 27% year on year during the COVID lockdown.
This is the February 2021 edition of the Home Asking Price Index, released on 12 February 2021, under the headline:
Prices Flatline While Supply Plunges Due to Lockdown
The headlines and summary below are the report's own words, with the key figures as it published them, followed by the report's charts and regional tables as printed.
Headlines
- Asking prices across England and Wales remain unchanged overall since last month while annualised growth slips to 4.5%.
- January indicated a dramatic drop in new sales listings due to the latest COVID lockdown. New instructions were down 27% year-on-year and gave the lowest January total in the history of this Index.
- Supply is down as much as 33% in some regions but Greater London is the exception with new listings down a mere 1% compared to January 2020.
- Total stock for sale in England and Wales has fallen again to set a new record low and this will serve to support prices and boost vendors' confidence.
- The northern property markets continue to indicate phenomenal 12-month growth, with the Yorkshire and Humber region showing stunning year-on-year price growth of 9.1%.
- Welsh home prices have rallied the most over the last six months, boosting the annualised growth to 8.4%.
- Greater London and the South East are currently the UK's worst-performing regions with only 3.2% growth. Next is the South West where prices have risen only 3.3% over the last twelve months.
- Average prices dipped in six English regions during the last month.
- Market momentum is slowing with the Typical Time on Market for unsold property in England and Wales rising ten days since last month to 111 days, counter to the normal seasonal trend. However, this figure is five days less than in February 2020.
- Rents continue to plummet in the Greater London lettings market, down 17.0% year-on-year overall compared to 2020, although some more central boroughs registered reductions in the average rent in excess of 30%.
- By contrast, a dramatic supply shortage is evident in all other English regions, Scotland and Wales, thereby forcing up rents. Some regions indicate drops of over 50% in the total of newly available properties to let entering the market compared to a year ago.
- The largest annualised rent hikes are in the North East (+16.6%) and the West Midlands (+20.7%).
- Greater London continues to indicate worsening oversupply in properties available to rent (+43% year-on-year). This alarming situation coupled with falling rents and the growing problem of rent arrears is a nightmare scenario for many London landlords.
Summary
The current lockdown is radically reducing the supply of new listings entering the market. Less than three quarters of the expected number of new instructions materialised during January. Vendors' hesitation is understandable amidst worrying developments in the ongoing health crisis and many sensible and responsible buyers are staying away from physical viewings altogether. Huge drops in supply are evident in Scotland, Wales and all English regions with the exception of Greater London, where de-urbanisation continues to bloat estate agents' portfolios.
The annualised mix-adjusted average price growth across England and Wales is currently a remarkable +4.5%; in February 2020, the annualised rate of increase of home prices was just 0.9%.
Key figures
| Measure | Figure |
|---|---|
| Annual price growth (England and Wales) | 4.5% |
| Prior year annual growth (February 2020) | 0.9% |
| New instructions (year-on-year) | -27% |
| Typical Time on Market | 111 days |
| Typical Time on Market (previous month) | 101 days |
| UK rental supply (year-on-year) | -21% |
| Stock on sales market (year-on-year) | -14.8% |
Figures are for England and Wales unless the report states otherwise, as published in the edition.
Charts from the report
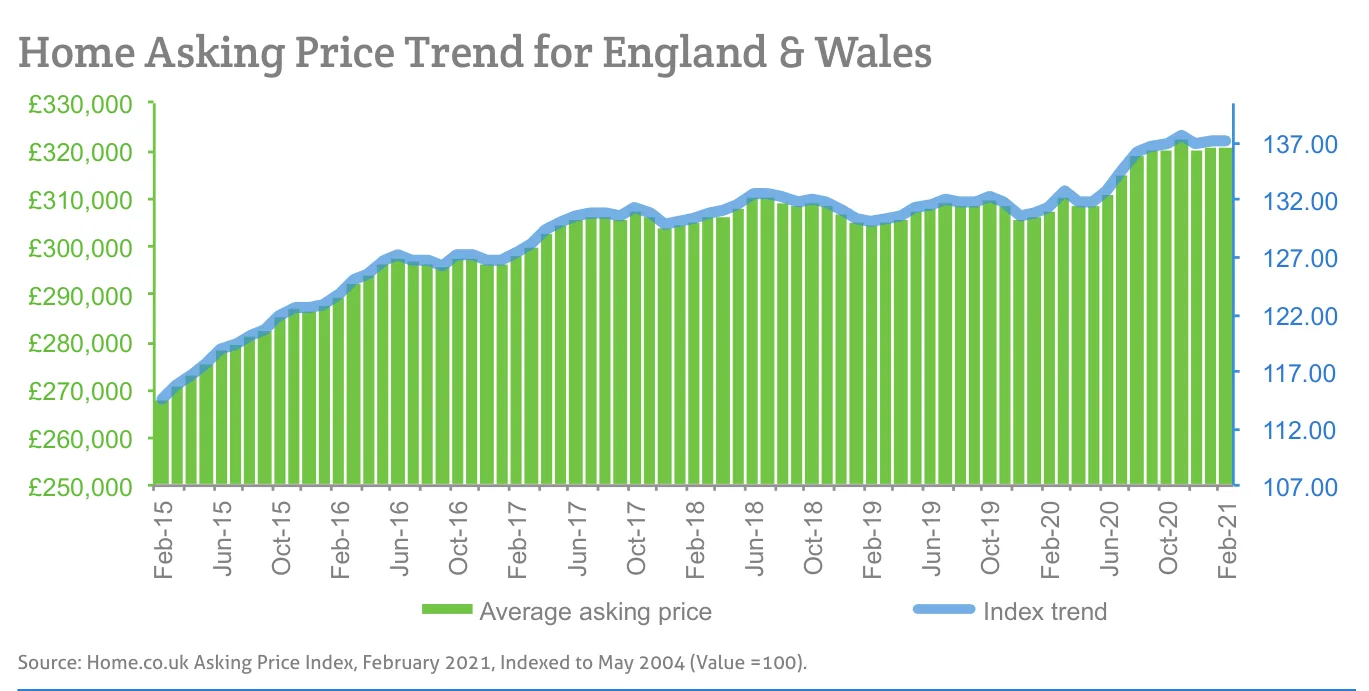
Source: Home.co.uk Asking Price Index, February 2021, Indexed to May 2004 (Value =100).
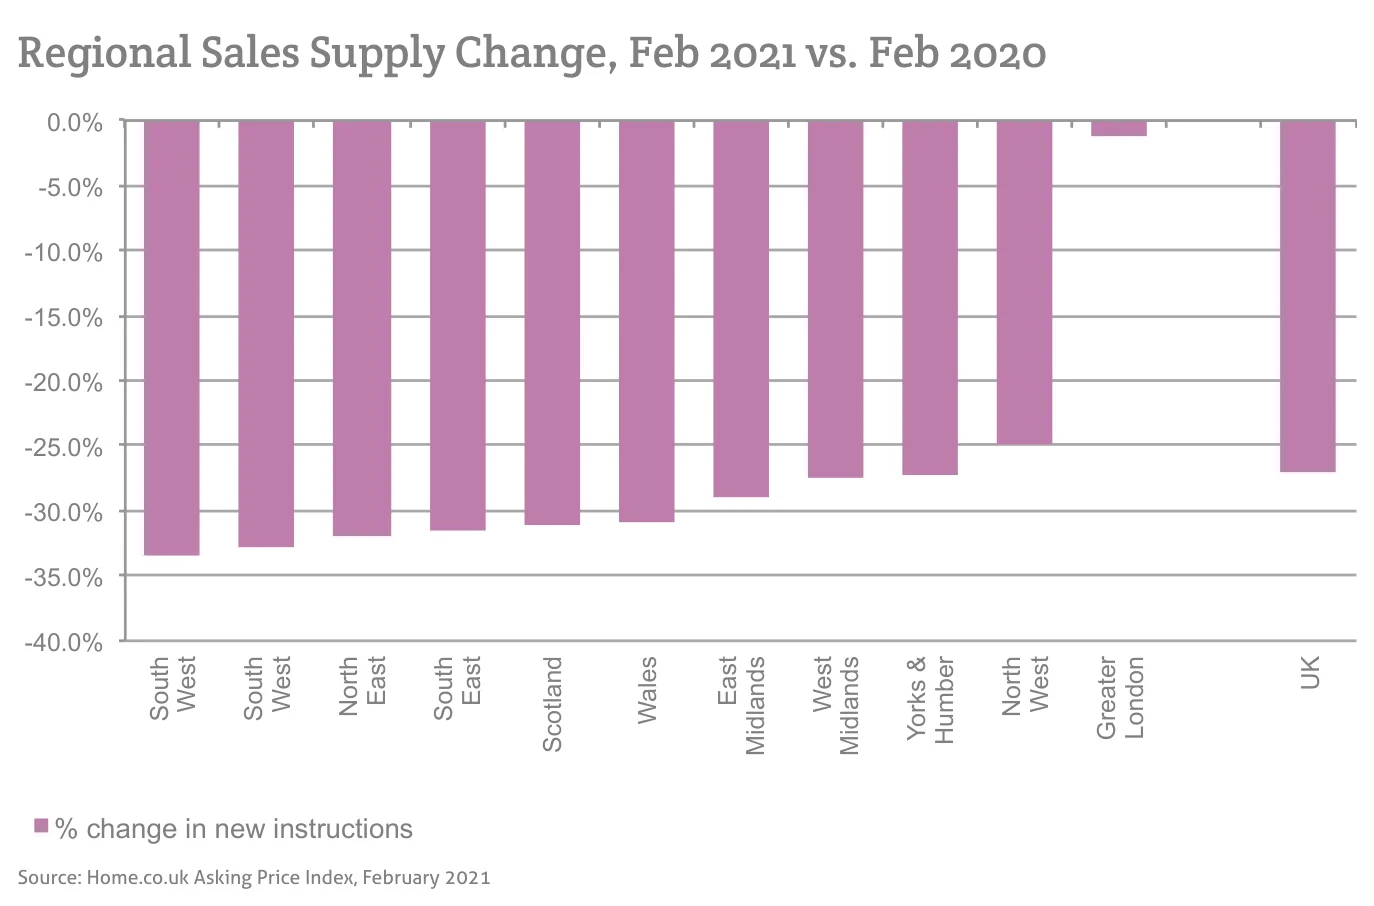
Source: Home.co.uk Asking Price Index, February 2021
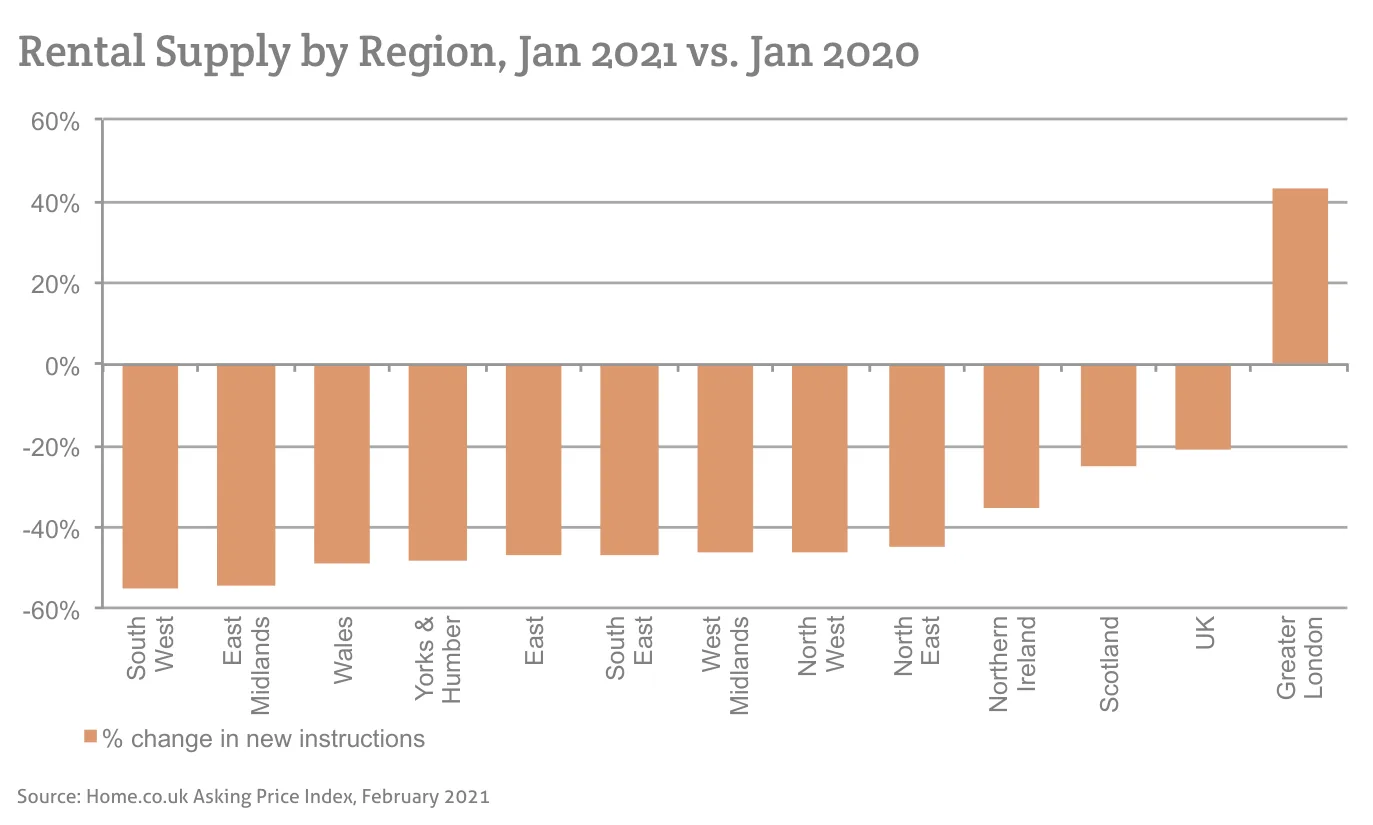
Source: Home.co.uk Asking Price Index, February 2021
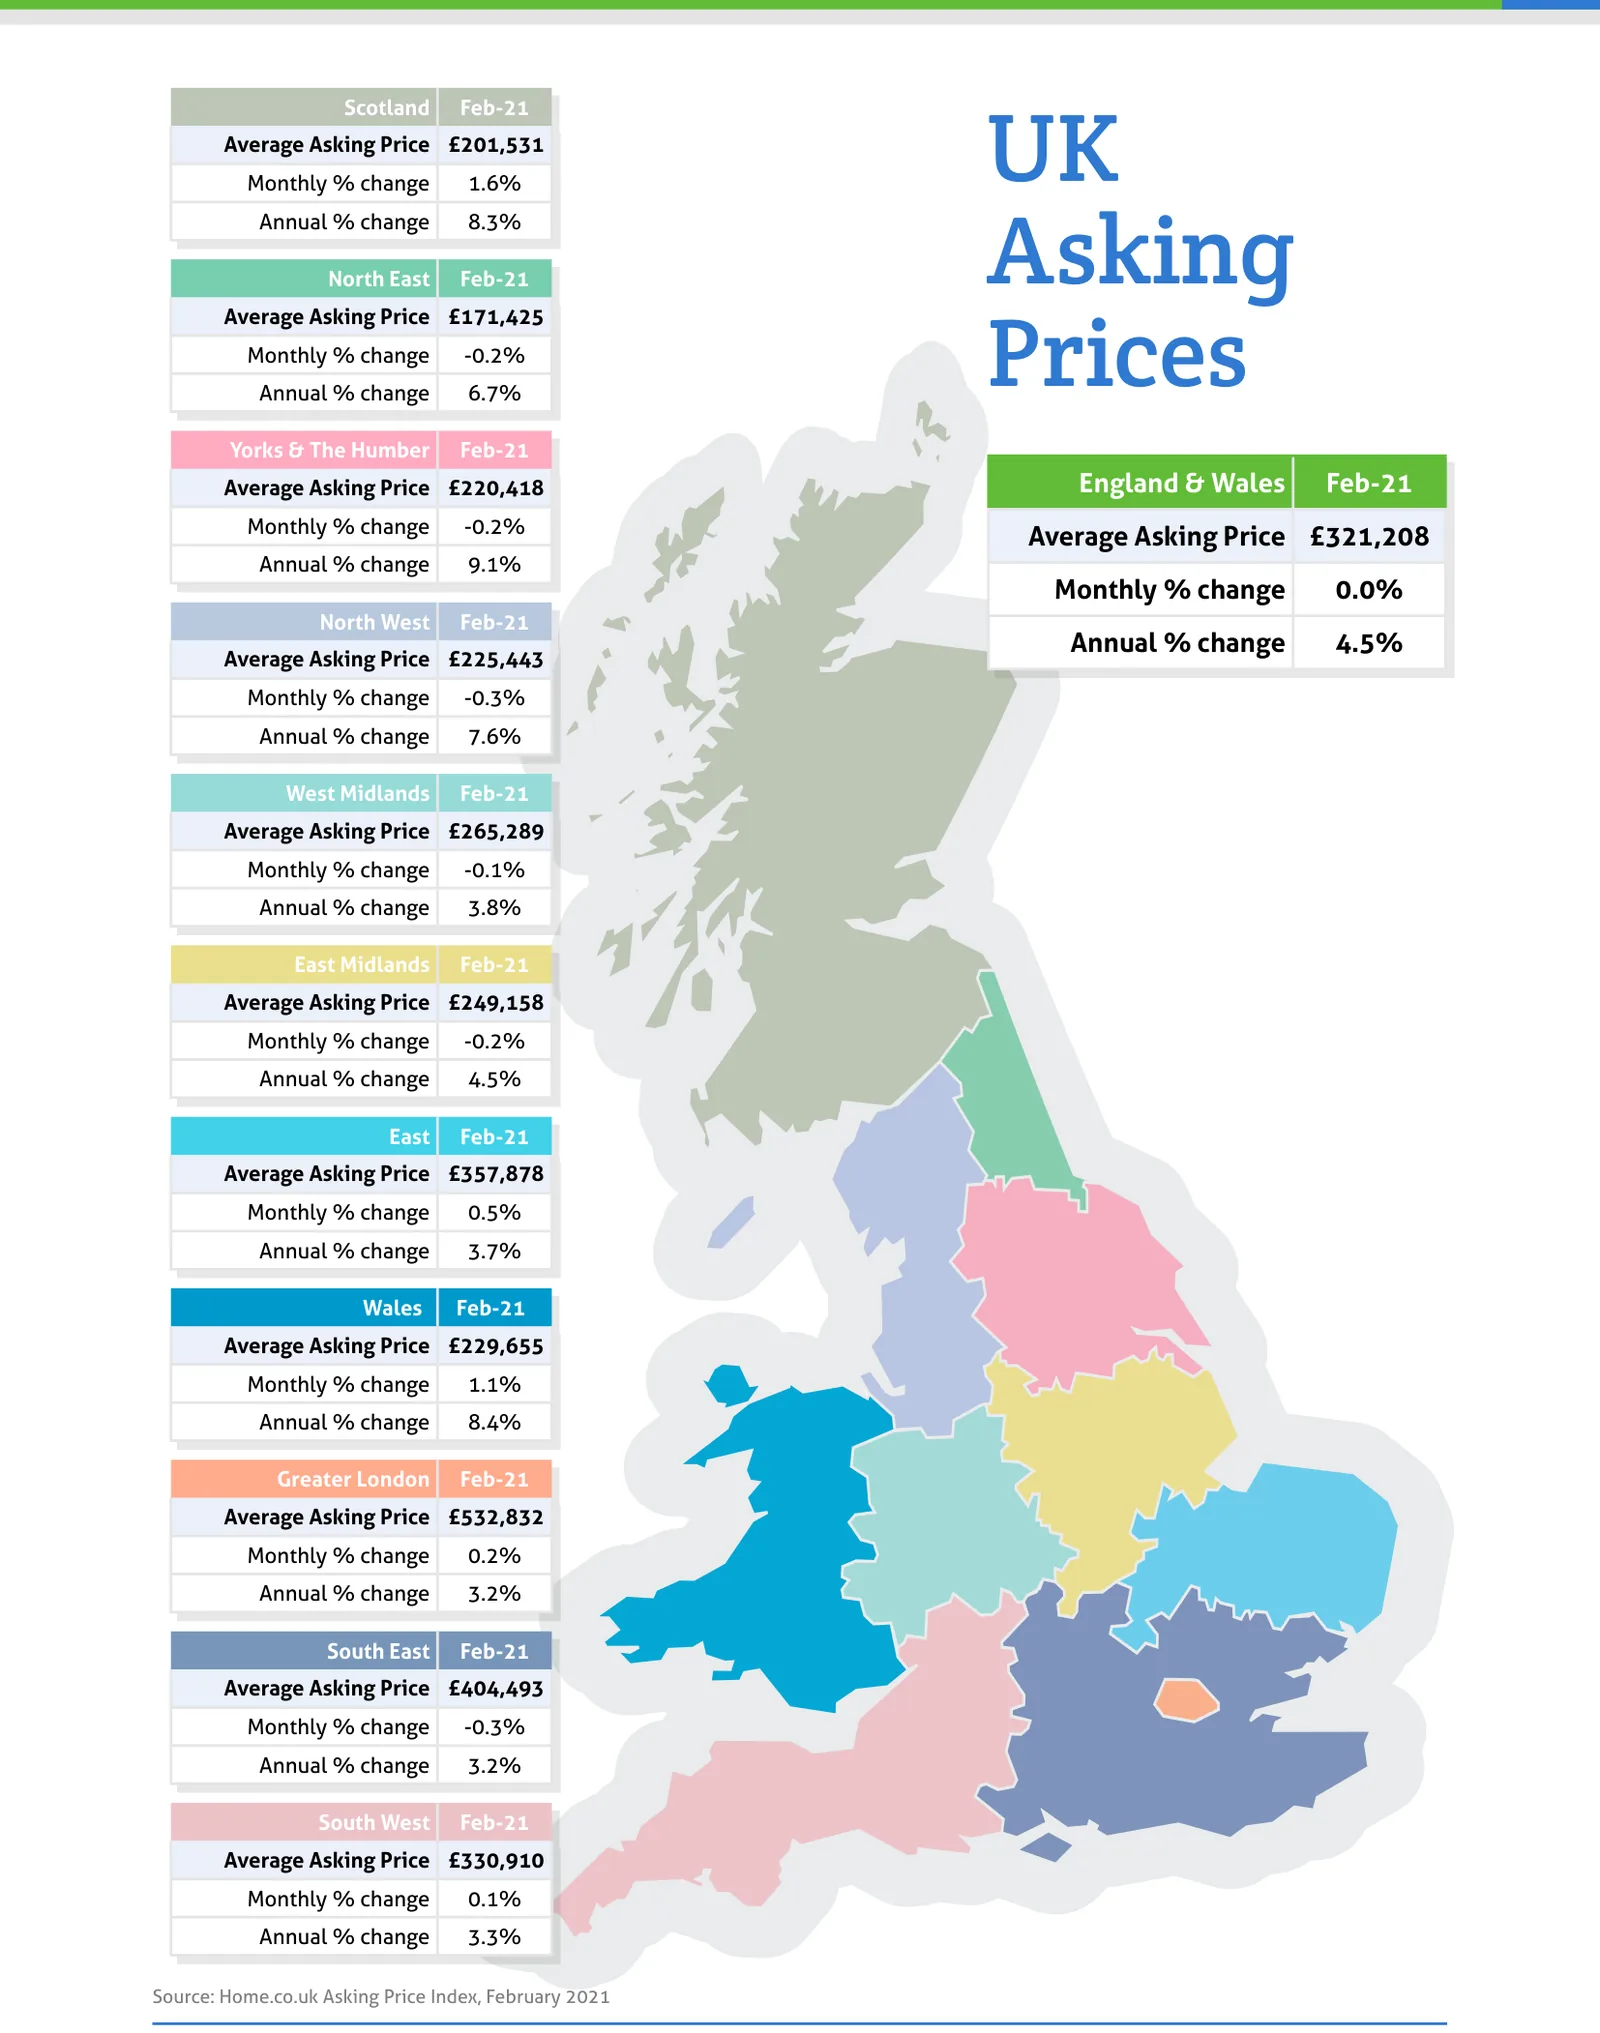
Source: Home.co.uk Asking Price Index, February 2021
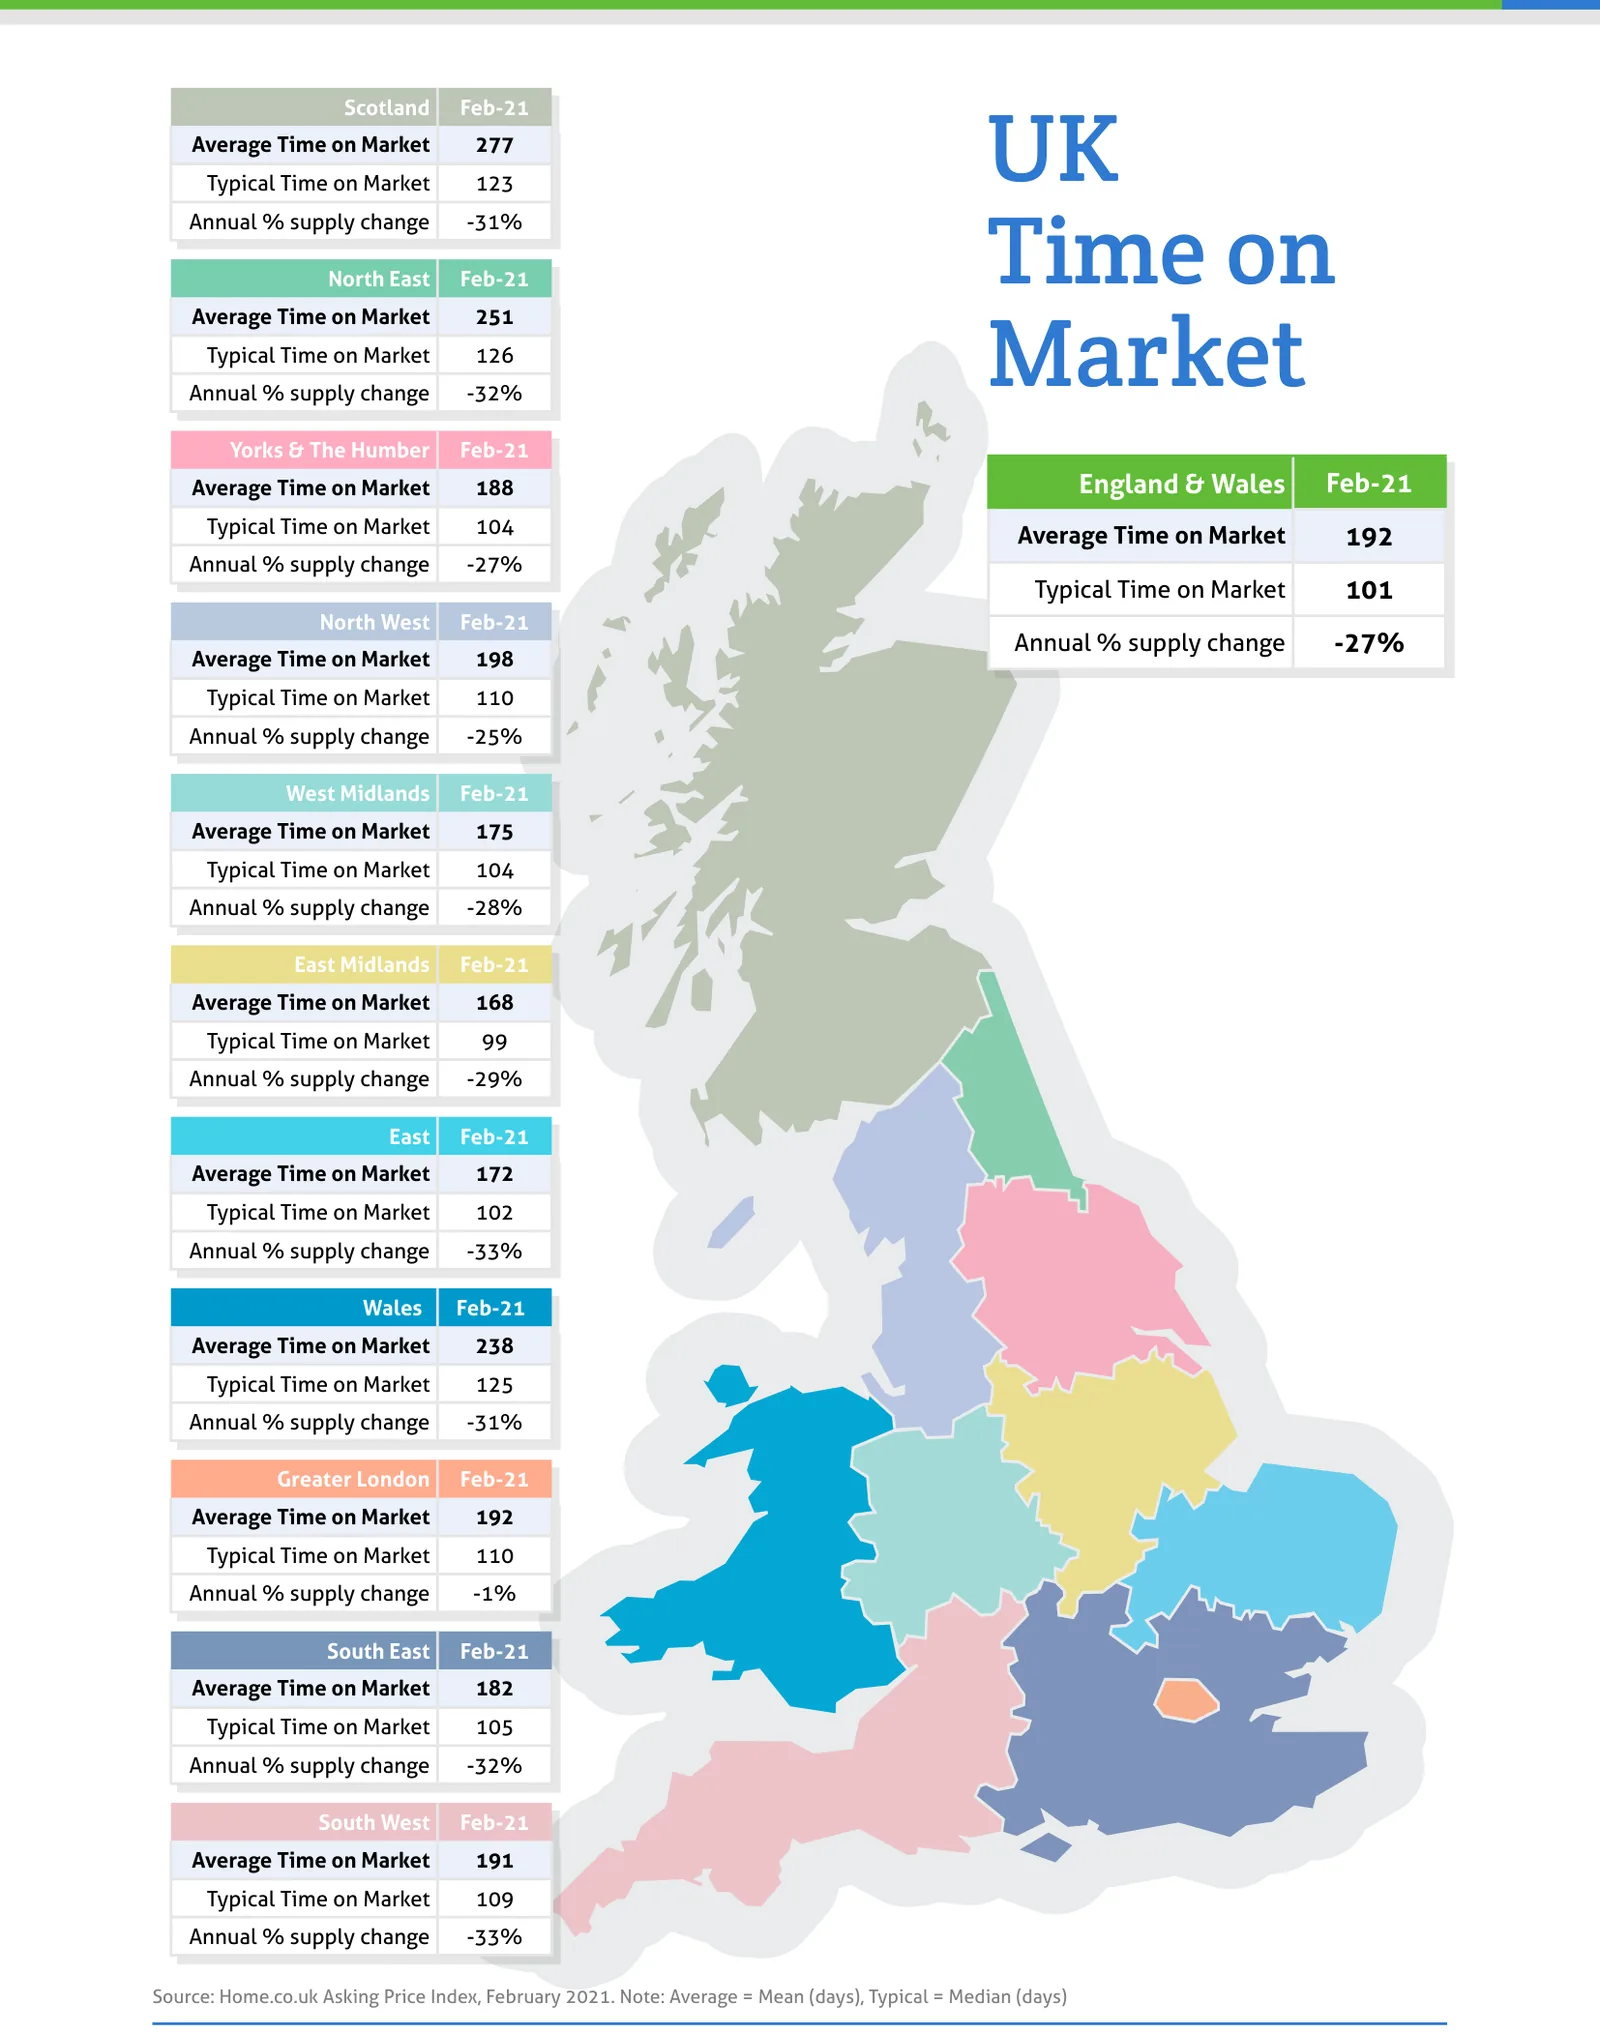
Source: Home.co.uk Asking Price Index, February 2021. Note: Average = Mean (days), Typical = Median (days)
Regional tables
UK Asking Prices, Feb-21
| Region | Average Asking Price | Monthly % change | Annual % change |
|---|---|---|---|
| Scotland | £201,531 | 1.6% | 8.3% |
| North East | £171,425 | -0.2% | 6.7% |
| Yorks & The Humber | £220,418 | -0.2% | 9.1% |
| England & Wales | £321,208 | 0.0% | 4.5% |
| North West | £225,443 | -0.3% | 7.6% |
| West Midlands | £265,289 | -0.1% | 3.8% |
| East Midlands | £249,158 | -0.2% | 4.5% |
| East | £357,878 | 0.5% | 3.7% |
| Wales | £229,655 | 1.1% | 8.4% |
| Greater London | £532,832 | 0.2% | 3.2% |
| South East | £404,493 | -0.3% | 3.2% |
| South West | £330,910 | 0.1% | 3.3% |
UK Time on Market, Feb-21
| Region | Average Time on Market | Typical Time on Market | Annual % supply change |
|---|---|---|---|
| Scotland | 277 | 123 | -31% |
| North East | 251 | 126 | -32% |
| Yorks & The Humber | 188 | 104 | -27% |
| England & Wales | 192 | 101 | -27% |
| North West | 198 | 110 | -25% |
| West Midlands | 175 | 104 | -28% |
| East Midlands | 168 | 99 | -29% |
| East | 172 | 102 | -33% |
| Wales | 238 | 125 | -31% |
| Greater London | 192 | 110 | -1% |
| South East | 182 | 105 | -32% |
| South West | 191 | 109 | -33% |
The edition's headline bullet gives the England & Wales Typical Time on Market as 111 days; the map page prints 101, which is what this table carries.
From the director's commentary
"Lack of newly available letting stock outside of London is driving rents up so fast that it might be termed hyperinflationary. House price movements are naturally slower than rents but the growth evident in the north of England, Scotland and Wales is simply stunning given the overall economic malaise."
Doug Shephard, Director at Home.co.uk
Read the full February 2021 edition (PDF, 7 pages)
About the Home Asking Price Index
The Home Asking Price Index measures the change in the prices sellers ask for residential property across England, Wales and Scotland. Today it is computed every month from around half a million advertised homes and is mix-adjusted, so a change in what happens to be on the market does not move the figure; earlier editions state the sample they were built from. Because an asking price is set months before a sale completes, the index runs around five months ahead of completed-sale measures such as the UK House Price Index.
Every edition in the archive, back to October 2006, is listed on the index page. How we measure the UK property market explains the listing data behind it, and today's figures by area are on house prices and rental prices.
Text and figures above are quoted from the February 2021 edition as published, with punctuation normalised for the web, and are not revised. Later editions may restate them.
More in What is happening to house prices: the Home guide
Thinking about your next move?
See what your home's worth in seconds, with the UK's longest-running property data behind it.
Get an instant valuation