

























Home Asking Price Index, February 2018: Midlands forges ahead while London prices slide
England and Wales asking prices rose 0.2% in the month and 2.3% year on year, as Midlands and northern markets gained momentum while London prices continued falling.

This is the February 2018 edition of the Home Asking Price Index, released on 13 February 2018, under the headline:
Midlands Forges Ahead while London Prices Slide
The headlines and summary below are the report's own words, with the key figures as it published them, followed by the report's charts and regional tables as printed.
Headlines
- Strong price growth in the Midlands and Yorkshire keeps national average positive despite London falls.
- No signs of recovery for London as the downward, now 21-month slide continues.
- Supply surges in the East, South East and South West of England.
- Typical Time on Market rises even further in London (+7.5%), the South East (+10.0%) and East (+7.7%) but year-on-year improvements are apparent in all other regions.
- Home prices tick up by 0.2% this month, taking the mix-adjusted average for England and Wales up 2.3% year-on-year (YoY).
- Asking prices in the capital region have now fallen 3.7% since their peak in May 2016, which equates to an average price reduction of £20,500.
- Prices have risen in all English regions, Scotland and Wales since last month, with the exception of London and the South West.
- Typical Time on Market for England and Wales has increased to 106 days, three days less than in Feb 2017.
- The total stock of properties on the market in England and Wales nudges up again to give a rise of 2.7% YoY.
Summary
As we head towards spring and the corresponding rise in housing market activity, two opposing trends dominate the UK home market. London's post-boom malaise continues with the number of properties on the market increasing as prices deflate. The East and South East of England are also suffering the same post-boom hangover with overly high valuations weighing heavily on prices and lengthening marketing times. For the time being these two regions still show year-on-year price gains but, going forward, the trend is towards zero and then slow deflation, perhaps towards the end of the year.
Counter to this, the Midlands and the northern markets are in great shape and, indeed, gaining momentum. In these regions the established growth trends continue and marketing times are significantly lower year-on-year. Unlike the frenzied pace of price rises observed previously in London and the Home Counties, the growth observed in the North and Midlands is, for the time being, more moderate and therefore appears more sustainable. Moreover, if we look back over the last ten years we can see that prices in the London the real rate of depreciation in capital value is around 6%.
Key figures
| Measure | Figure |
|---|---|
| Monthly change in asking prices | +0.2% |
| Annual change in asking prices (YoY) | 2.3% |
| Typical Time on Market | 106 days |
| Total stock of properties, YoY change | +2.7% |
| Overall UK supply, YoY change | +12% |
Figures are for England and Wales unless the report states otherwise, as published in the edition.
Charts from the report
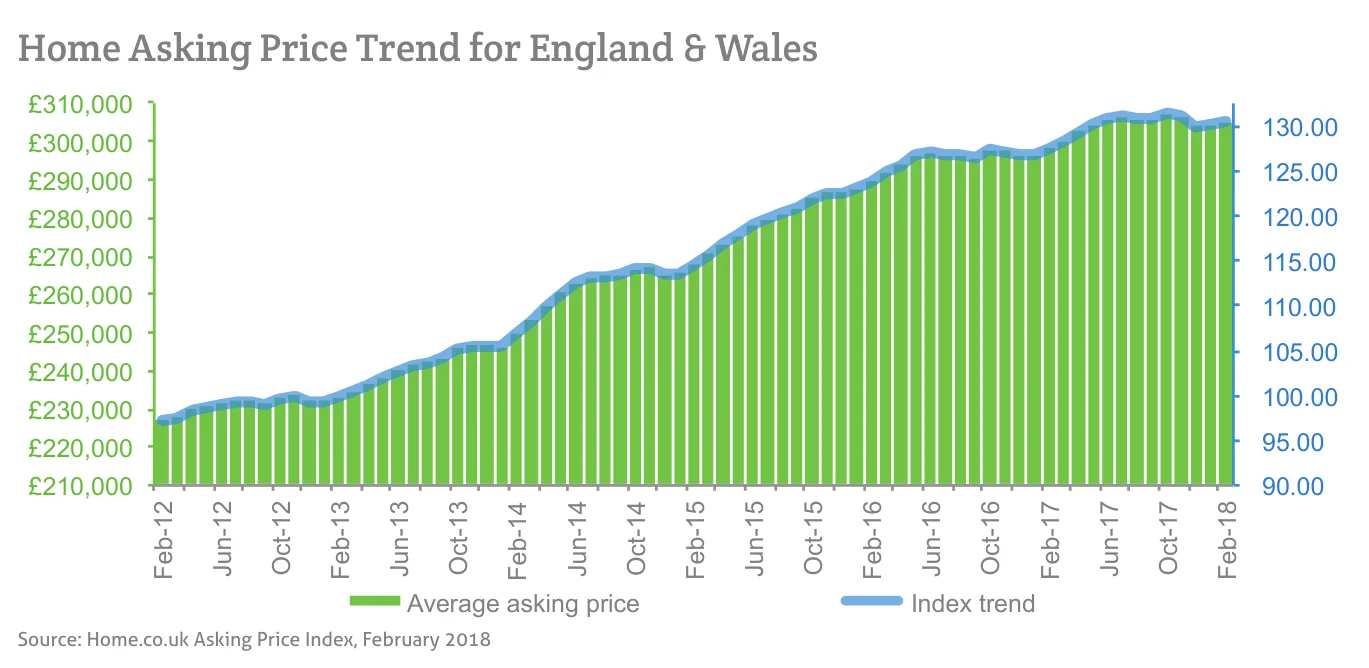
Source: Home.co.uk Asking Price Index, February 2018
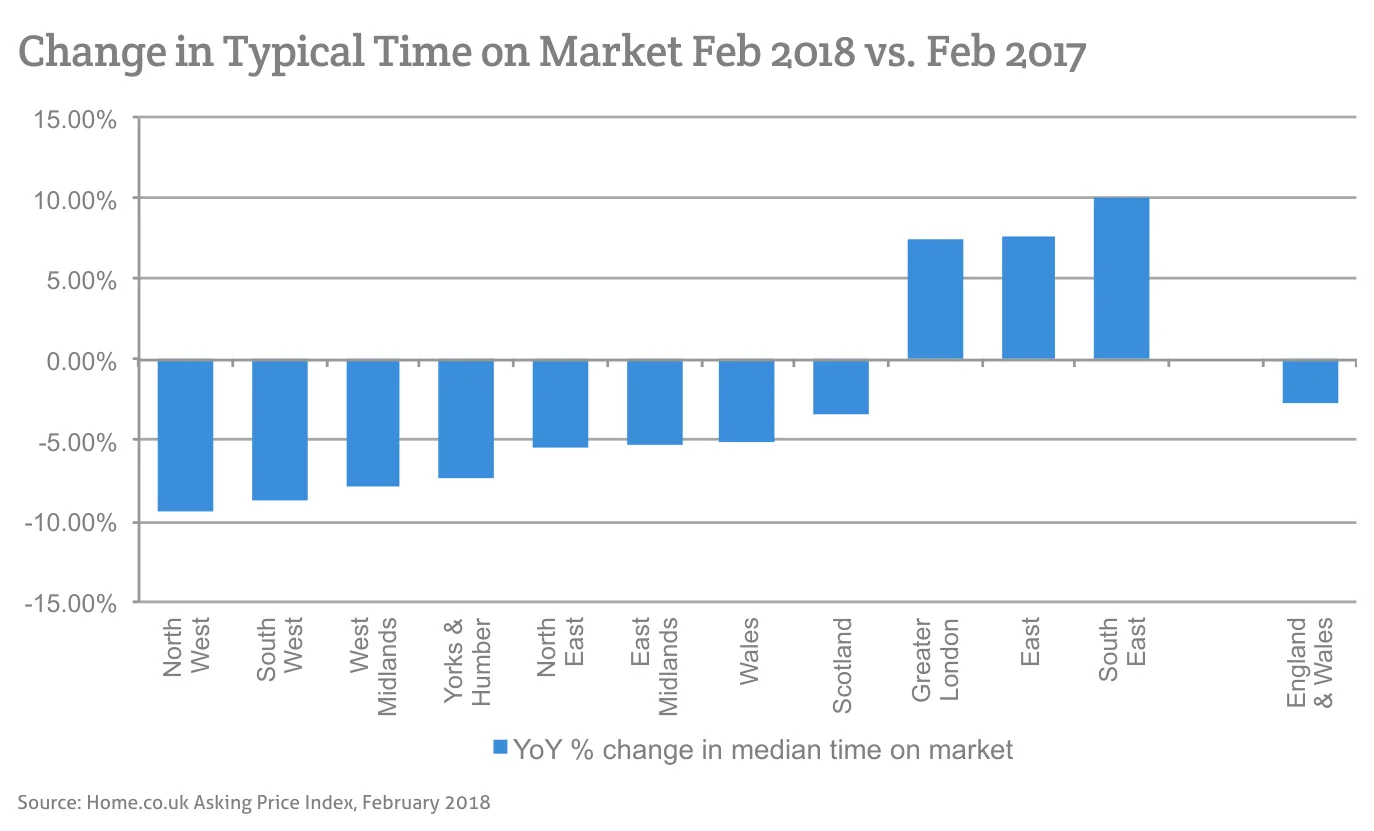
Source: Home.co.uk Asking Price Index, February 2018
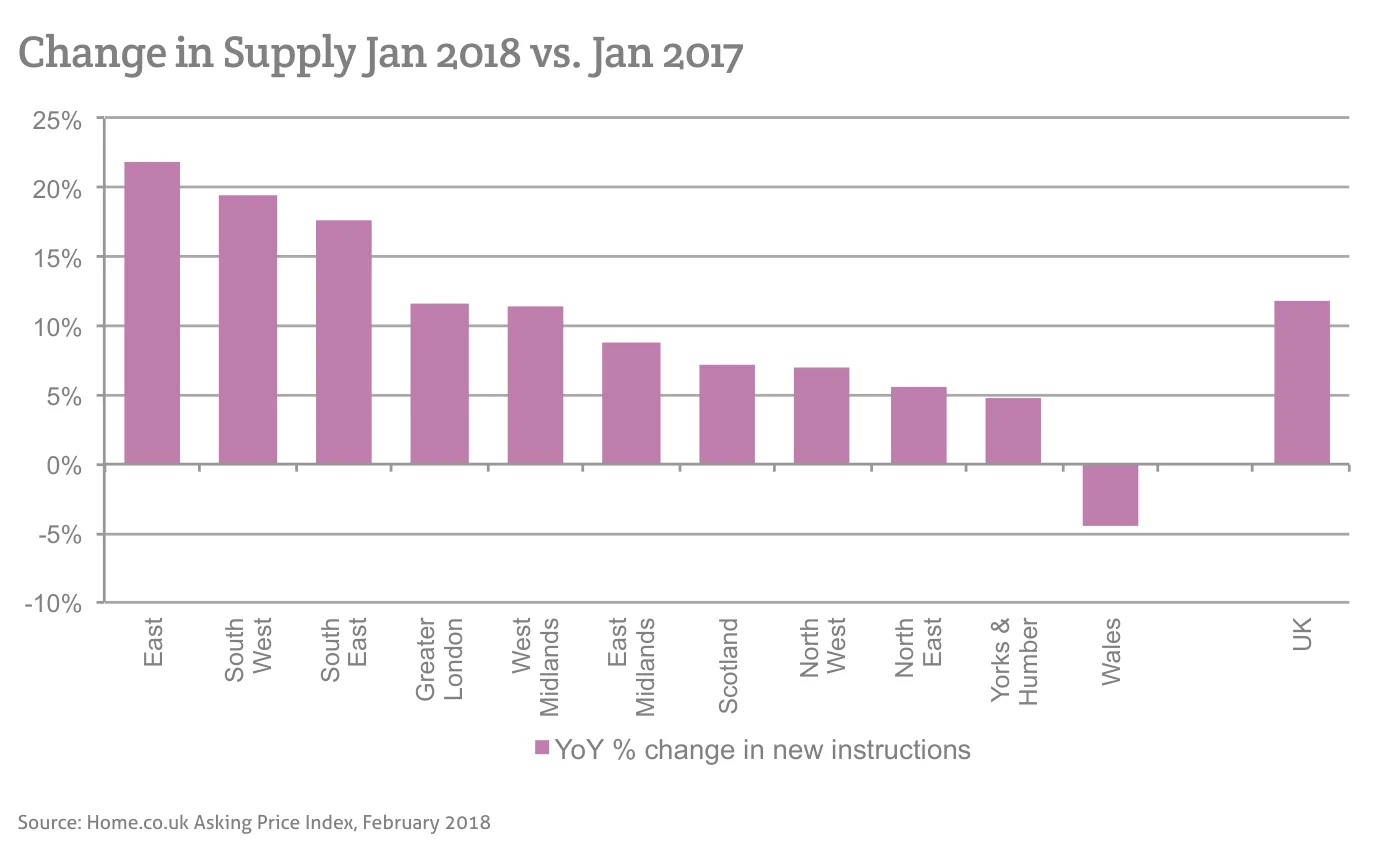
Source: Home.co.uk Asking Price Index, February 2018
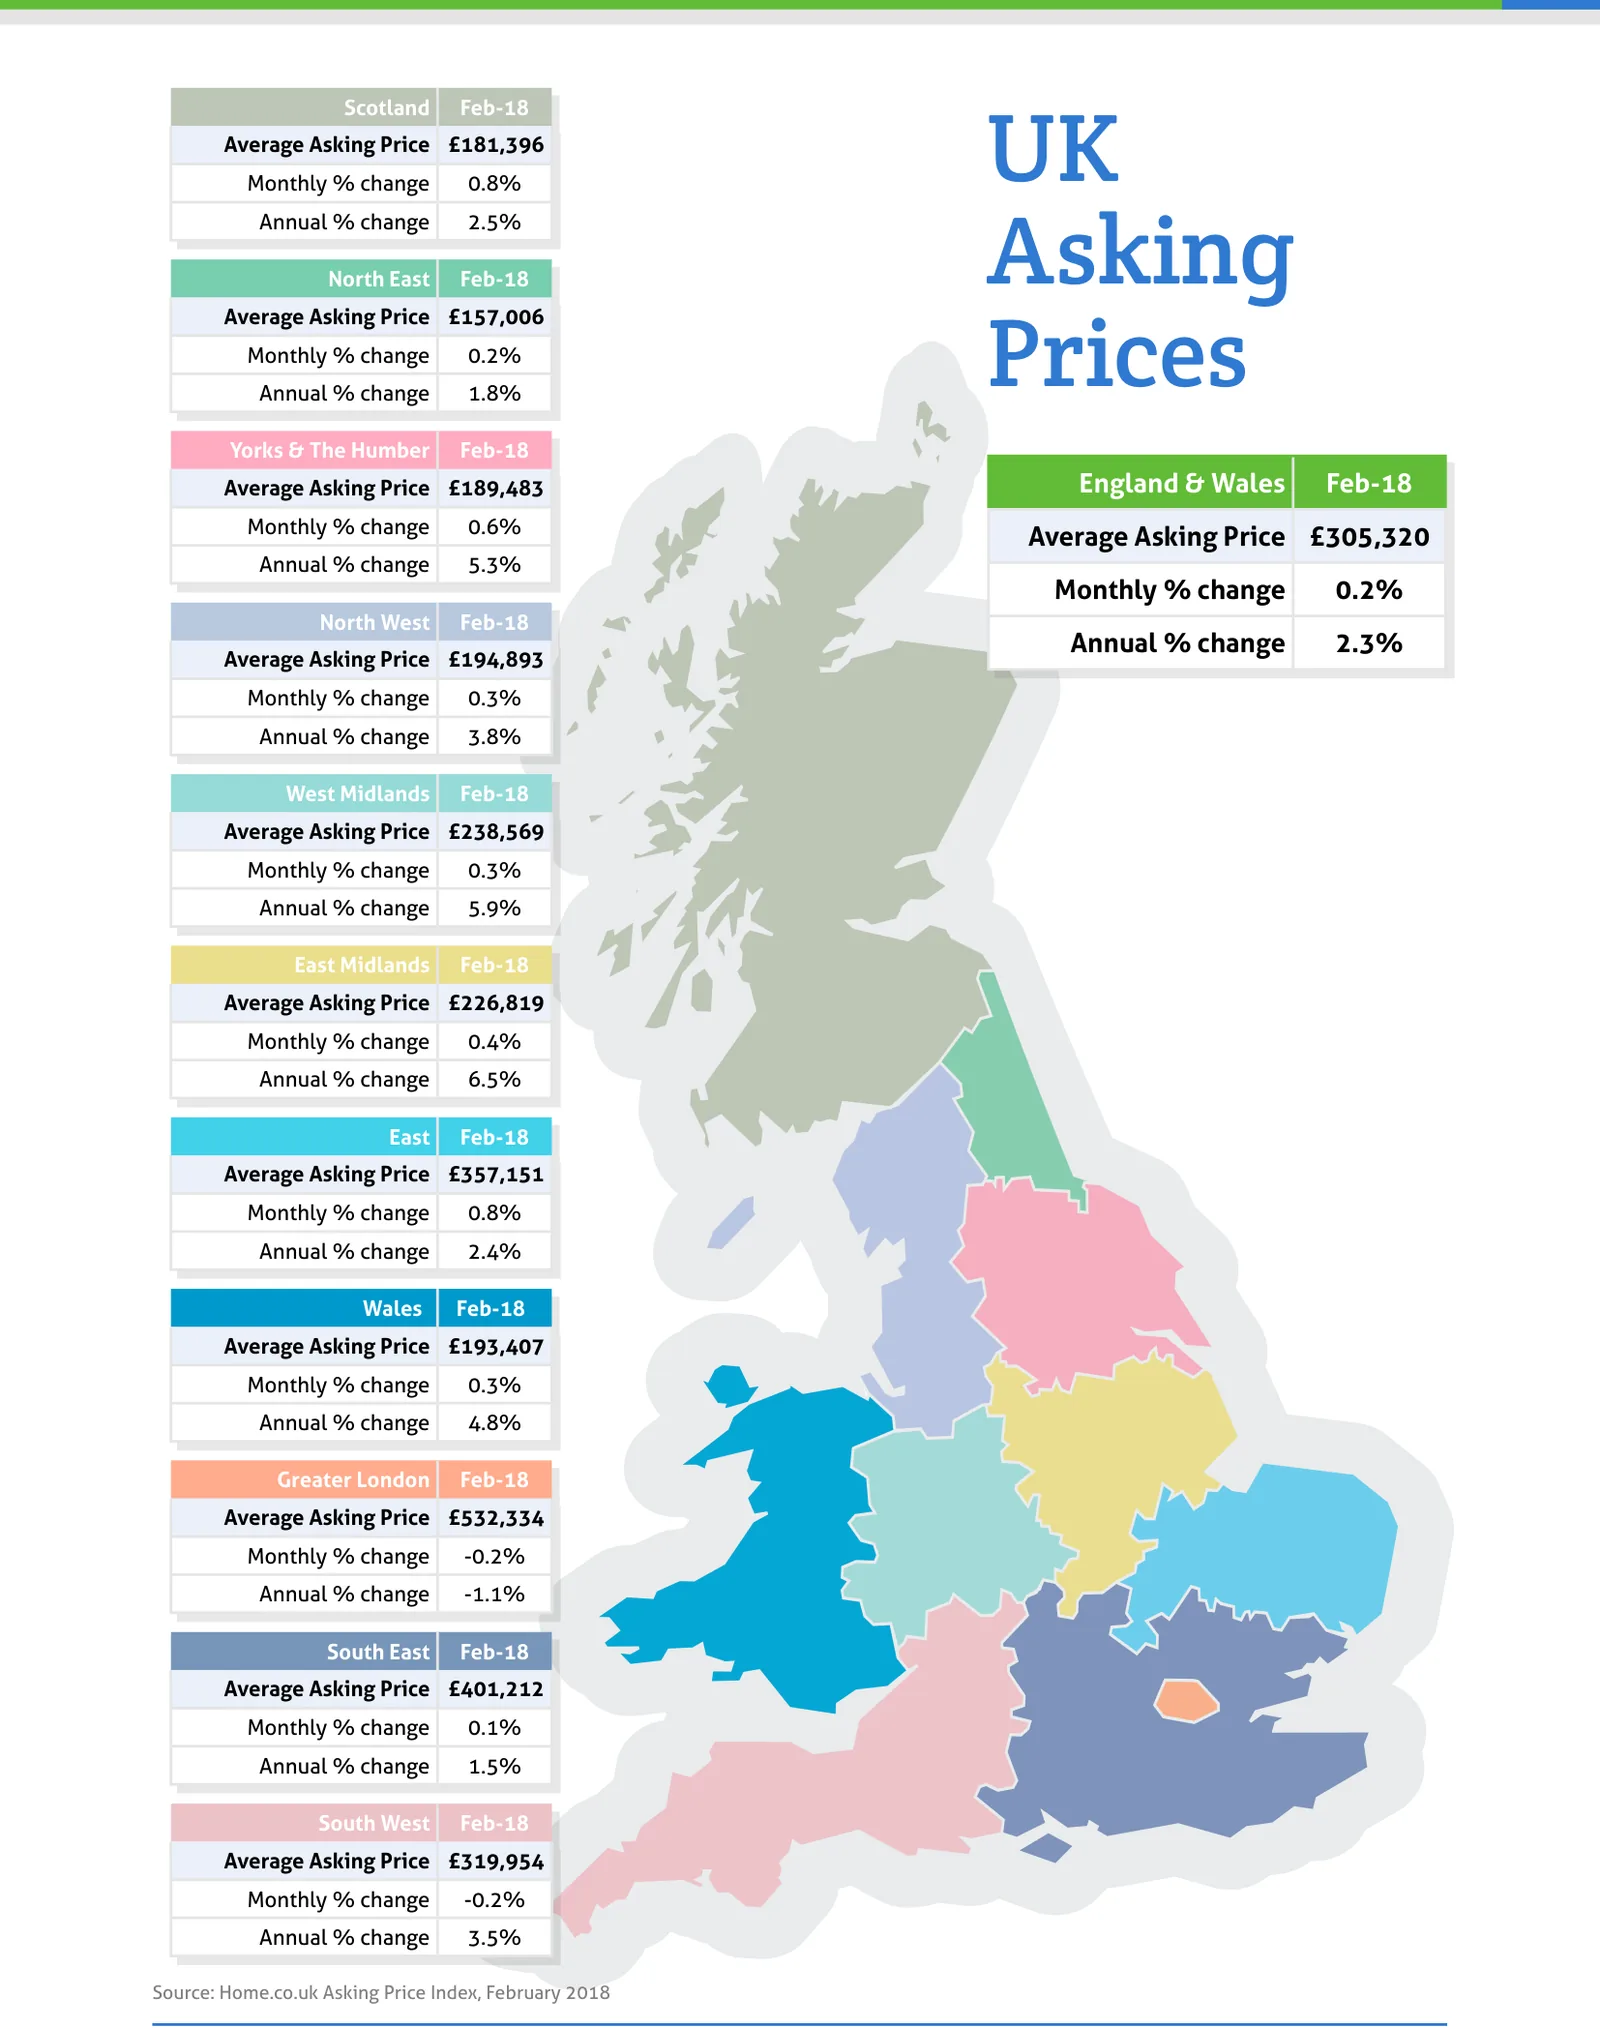
Source: Home.co.uk Asking Price Index, February 2018
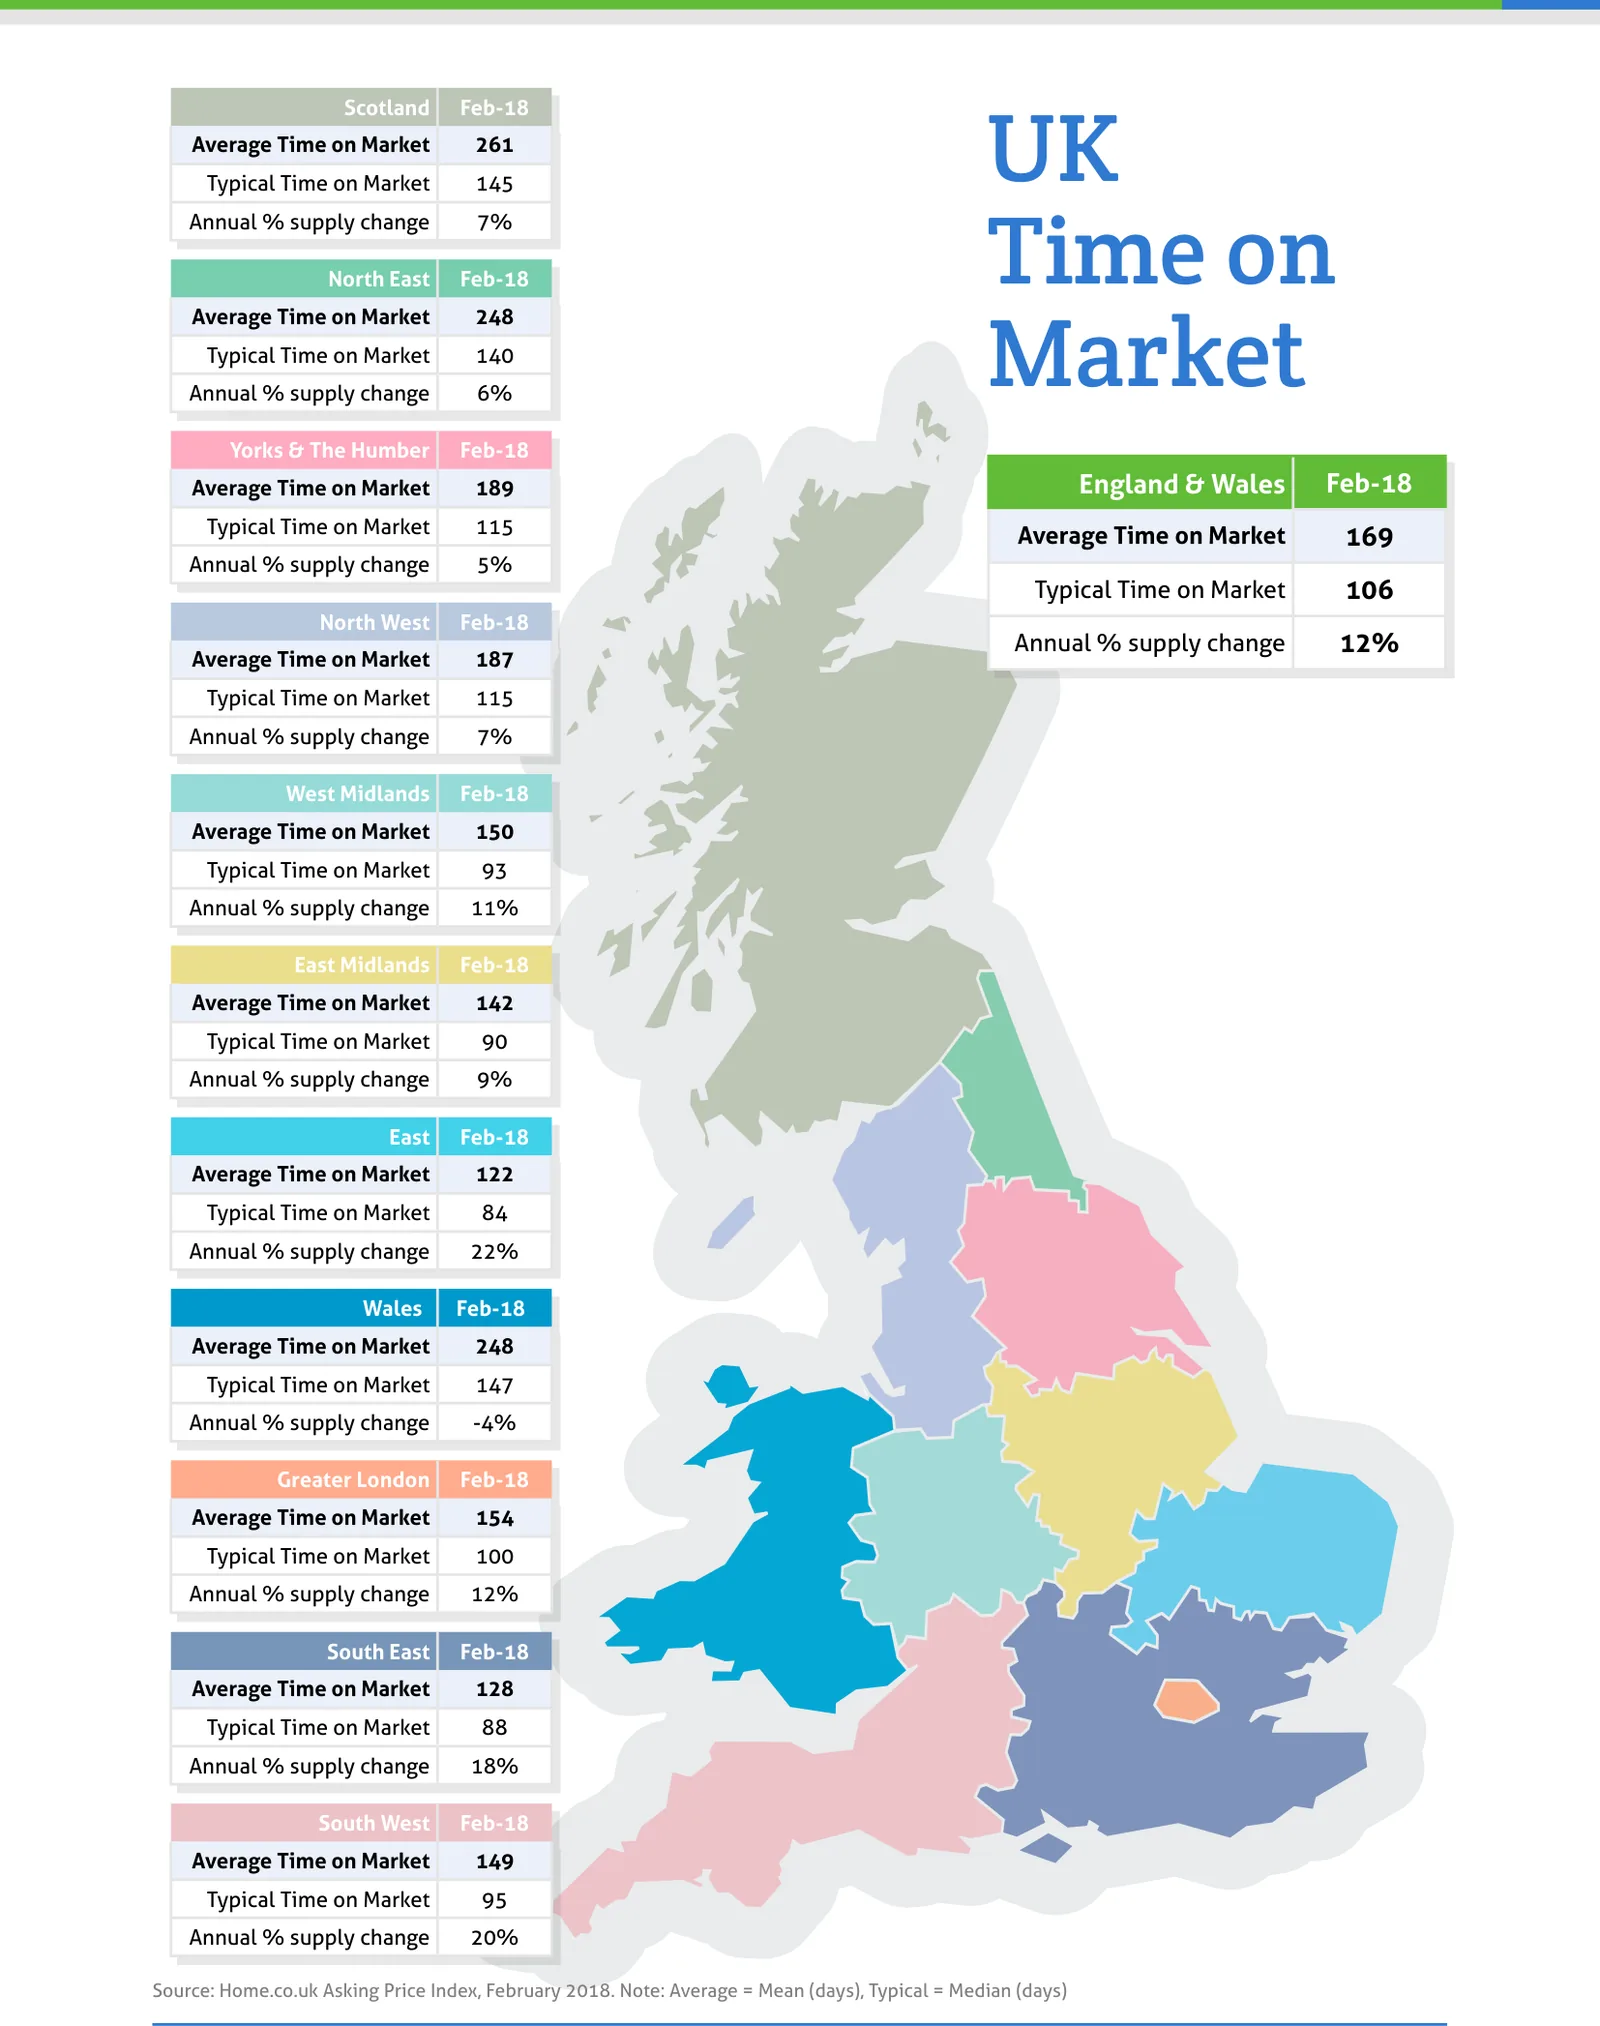
Source: Home.co.uk Asking Price Index, February 2018. Note: Average = Mean (days), Typical = Median (days)
Regional tables
UK Asking Prices, Feb-18
| Region | Average Asking Price | Monthly % change | Annual % change |
|---|---|---|---|
| Scotland | £181,396 | 0.8% | 2.5% |
| North East | £157,006 | 0.2% | 1.8% |
| Yorks & The Humber | £189,483 | 0.6% | 5.3% |
| England & Wales | £305,320 | 0.2% | 2.3% |
| North West | £194,893 | 0.3% | 3.8% |
| West Midlands | £238,569 | 0.3% | 5.9% |
| East Midlands | £226,819 | 0.4% | 6.5% |
| East | £357,151 | 0.8% | 2.4% |
| Wales | £193,407 | 0.3% | 4.8% |
| Greater London | £532,334 | -0.2% | -1.1% |
| South East | £401,212 | 0.1% | 1.5% |
| South West | £319,954 | -0.2% | 3.5% |
UK Time on Market, Feb-18
| Region | Average Time on Market | Typical Time on Market | Annual % supply change |
|---|---|---|---|
| Scotland | 261 | 145 | 7% |
| North East | 248 | 140 | 6% |
| Yorks & The Humber | 189 | 115 | 5% |
| England & Wales | 169 | 106 | 12% |
| North West | 187 | 115 | 7% |
| West Midlands | 150 | 93 | 11% |
| East Midlands | 142 | 90 | 9% |
| East | 122 | 84 | 22% |
| Wales | 248 | 147 | -4% |
| Greater London | 154 | 100 | 12% |
| South East | 128 | 88 | 18% |
| South West | 149 | 95 | 20% |
From the director's commentary
"London's malaise continues as the froth settles but prices, thus far, appear to be correcting in an orderly way and, as long as interest rates remain low, we expect that trend to continue."
Doug Shephard, Director at Home.co.uk
Read the full February 2018 edition (PDF, 7 pages)
About the Home Asking Price Index
The Home Asking Price Index measures the change in the prices sellers ask for residential property across England, Wales and Scotland. Today it is computed every month from around half a million advertised homes and is mix-adjusted, so a change in what happens to be on the market does not move the figure; earlier editions state the sample they were built from. Because an asking price is set months before a sale completes, the index runs around five months ahead of completed-sale measures such as the UK House Price Index.
Every edition in the archive, back to October 2006, is listed on the index page. How we measure the UK property market explains the listing data behind it, and today's figures by area are on house prices and rental prices.
Text and figures above are quoted from the February 2018 edition as published, with punctuation normalised for the web, and are not revised. Later editions may restate them.
More in What is happening to house prices: the Home guide
Thinking about your next move?
See what your home's worth in seconds, with the UK's longest-running property data behind it.
Get an instant valuation