

























Home Asking Price Index, December 2024: huge stock drop confirms strong demand
Unsold property stock in England and Wales fell by around 30,000, the largest drop since December 2019, while annual price growth slowed to 1.7%.

This is the December 2024 edition of the Home Asking Price Index, released on 13 December 2024, under the headline:
Huge Stock Drop Confirms Strong Demand
The headlines and summary below are the report's own words, with the key figures as it published them, followed by the report's charts and regional tables as printed.
Headlines
- The unsold sales stock count for England and Wales plummeted by around 30,000 properties during the last month, making the current total 465,129. This is the largest such fall since December 2019.
- Asking prices continue their seasonal decline, falling by 1.0% since last month across England and Wales; this is a drop that slightly exceeds purely seasonal variance. Annualised home price growth reduced to just 1.7% overall.
- The UK property market continues to indicate significant momentum. Property turnover continues to be higher than during most of the last ten years and Typical Time on Market remains significantly lower than in pre-pandemic December 2019.
- The total number of new instructions entering the market during November 2024 was 10% more than during November 2023. London saw the highest regional increase, up by 17%.
Summary
Overall, the vital signs of the UK property sales market confirm that it is operating normally. Property throughput is currently higher than many of the pre-COVID years. Room for further price growth appears limited due to affordability constraints. The mix-adjusted average asking price for England and Wales remains notably lower than the peak pricing observed in the summer months of 2022.
Properties continue to move swiftly through the market, thanks to elevated demand. Consequently, agents' portfolios have been thinned out, thereby reducing the national stock level despite increased supply. Pricing remains tight, however, with all regions indicating average price reductions, the magnitude of which is more than merely seasonal. Vendors are clearly motivated and therefore pricing competitively.
Whilst expectations of lower interest rates going forward have buoyed confidence in the market, fears of increased taxation and restrictive legislation persist, especially among landlords. Consequently, we expect landlords to continue to offload their least profitable properties, thereby adding to sales supply but reducing rental property availability. On a regional basis, yields continue to be better in the North than in London and the South.
Key figures
| Measure | Figure |
|---|---|
| Monthly stock fall | around 30,000 |
| Monthly change in asking prices | -1.0% |
| Annual change in asking prices | +1.7% |
| New instructions vs year ago | +10% |
| Annualised asking rent growth | +0.8% |
Figures are for England and Wales unless the report states otherwise, as published in the edition.
Charts from the report
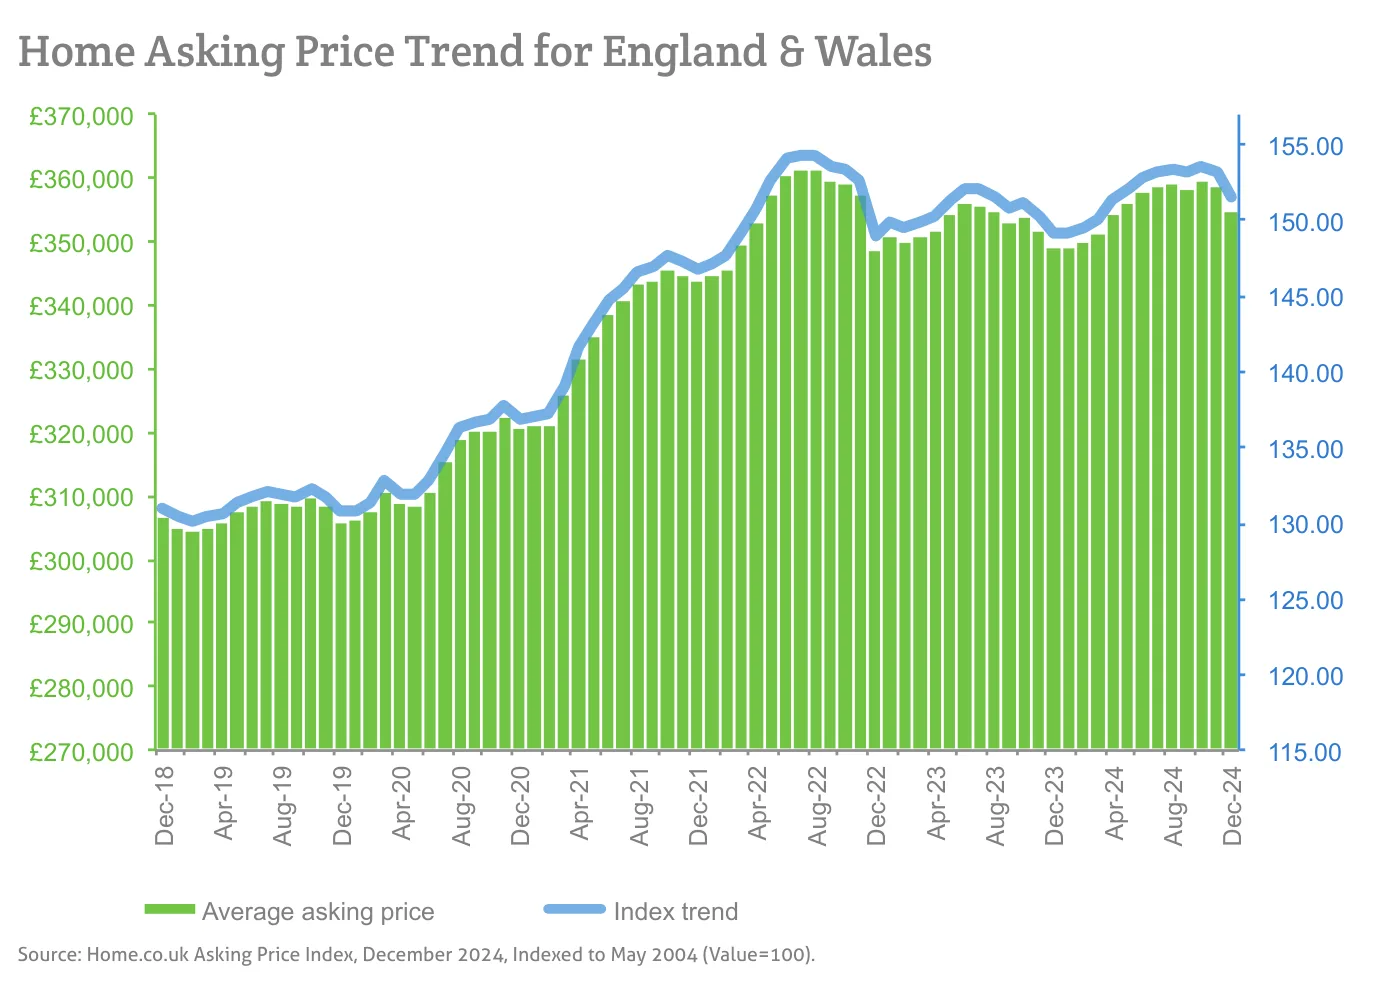
Source: Home.co.uk Asking Price Index, December 2024, Indexed to May 2004 (Value=100).
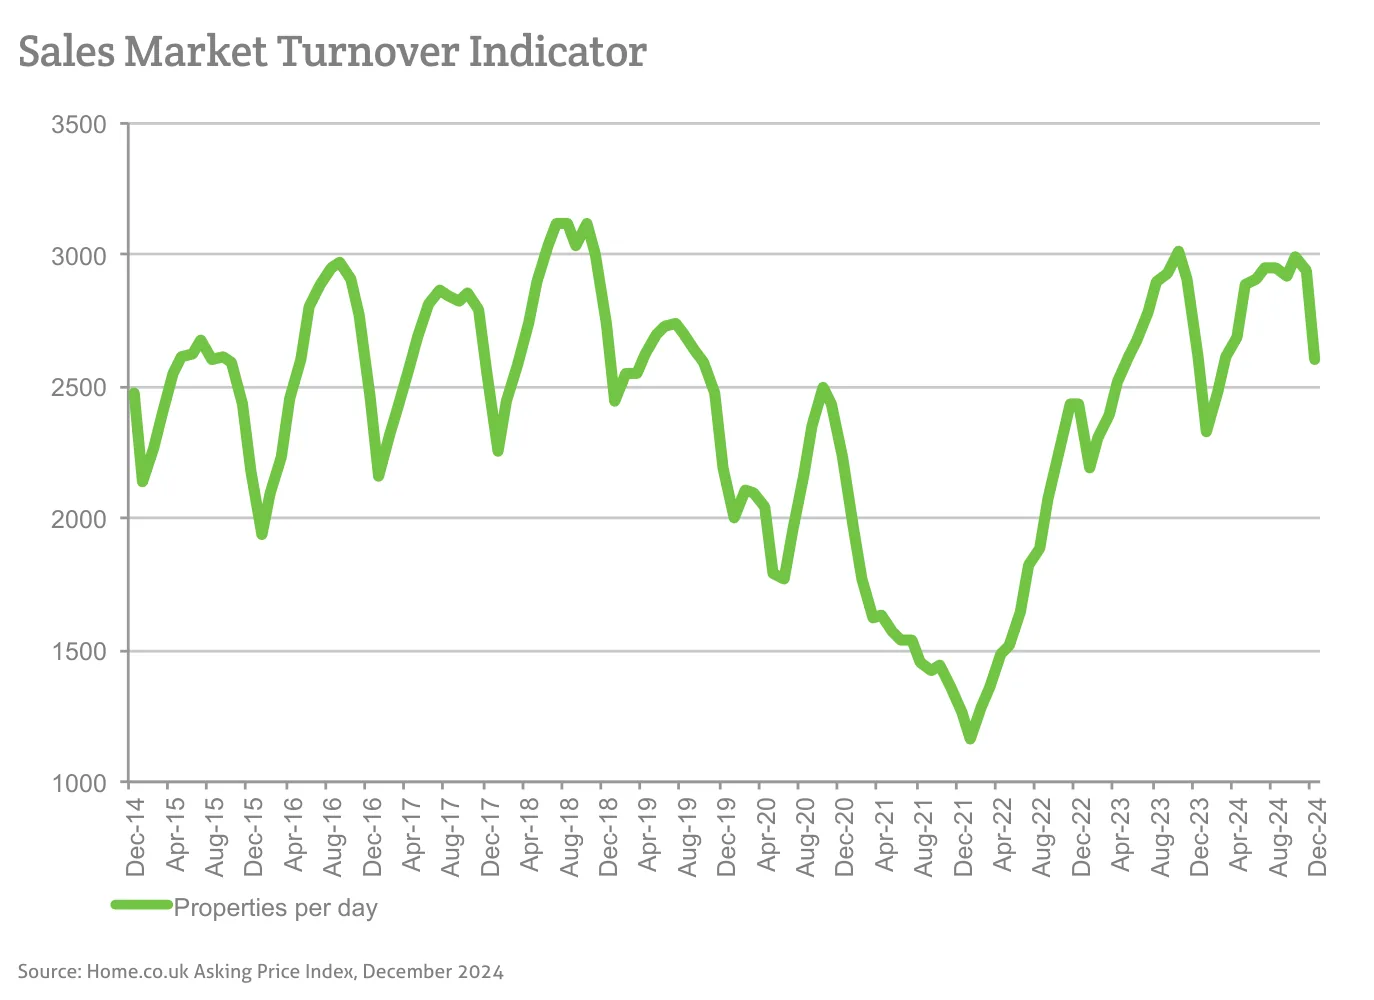
Source: Home.co.uk Asking Price Index, December 2024
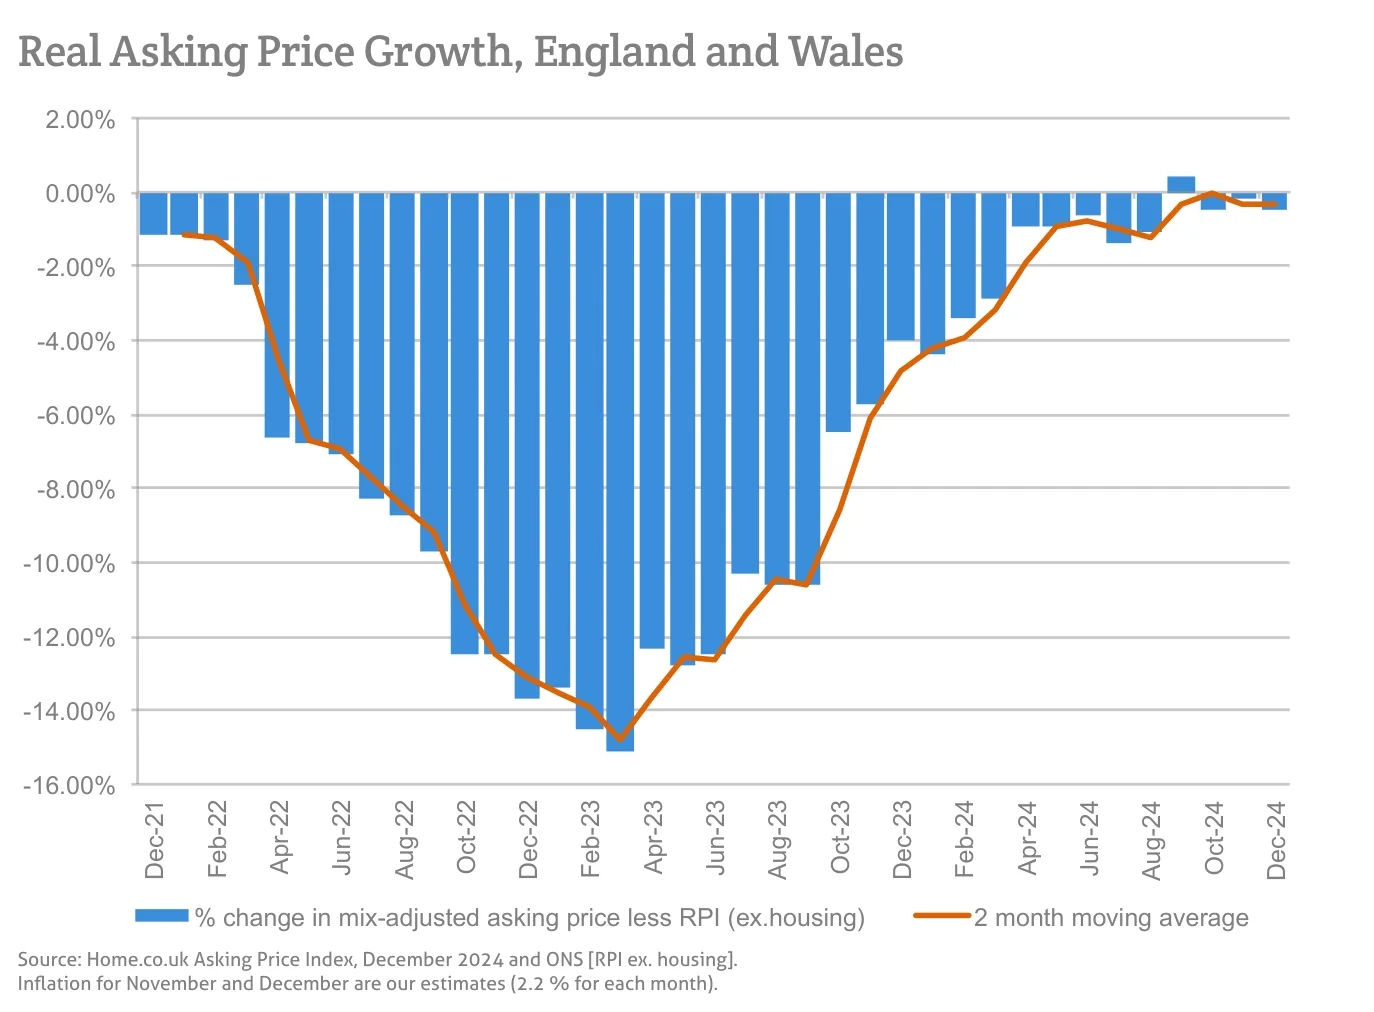
Source: Home.co.uk Asking Price Index, December 2024 and ONS [RPI ex. housing].
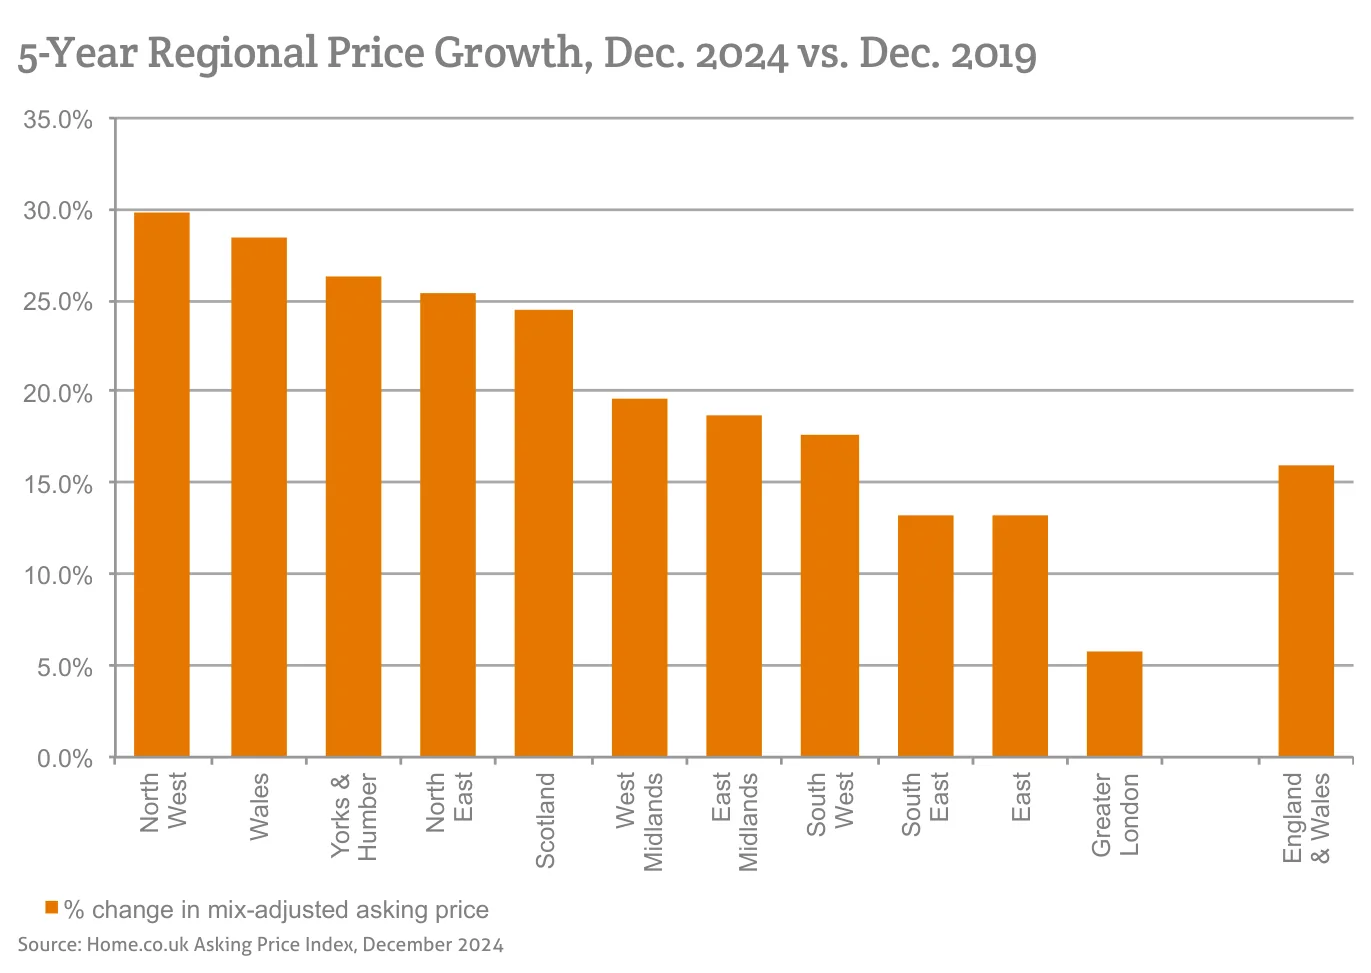
Source: Home.co.uk Asking Price Index, December 2024
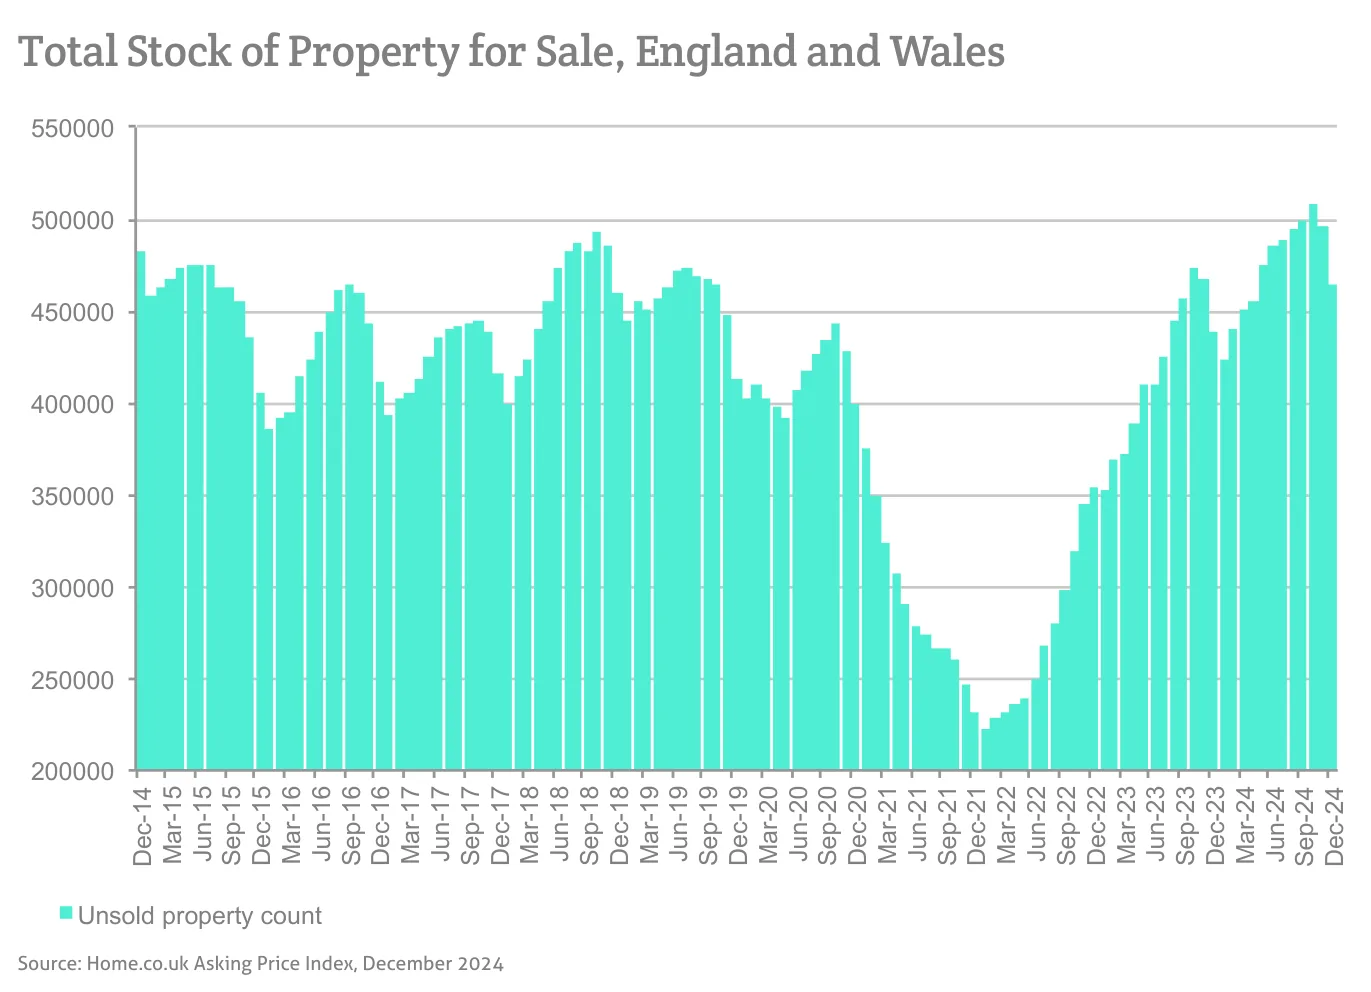
Source: Home.co.uk Asking Price Index, December 2024
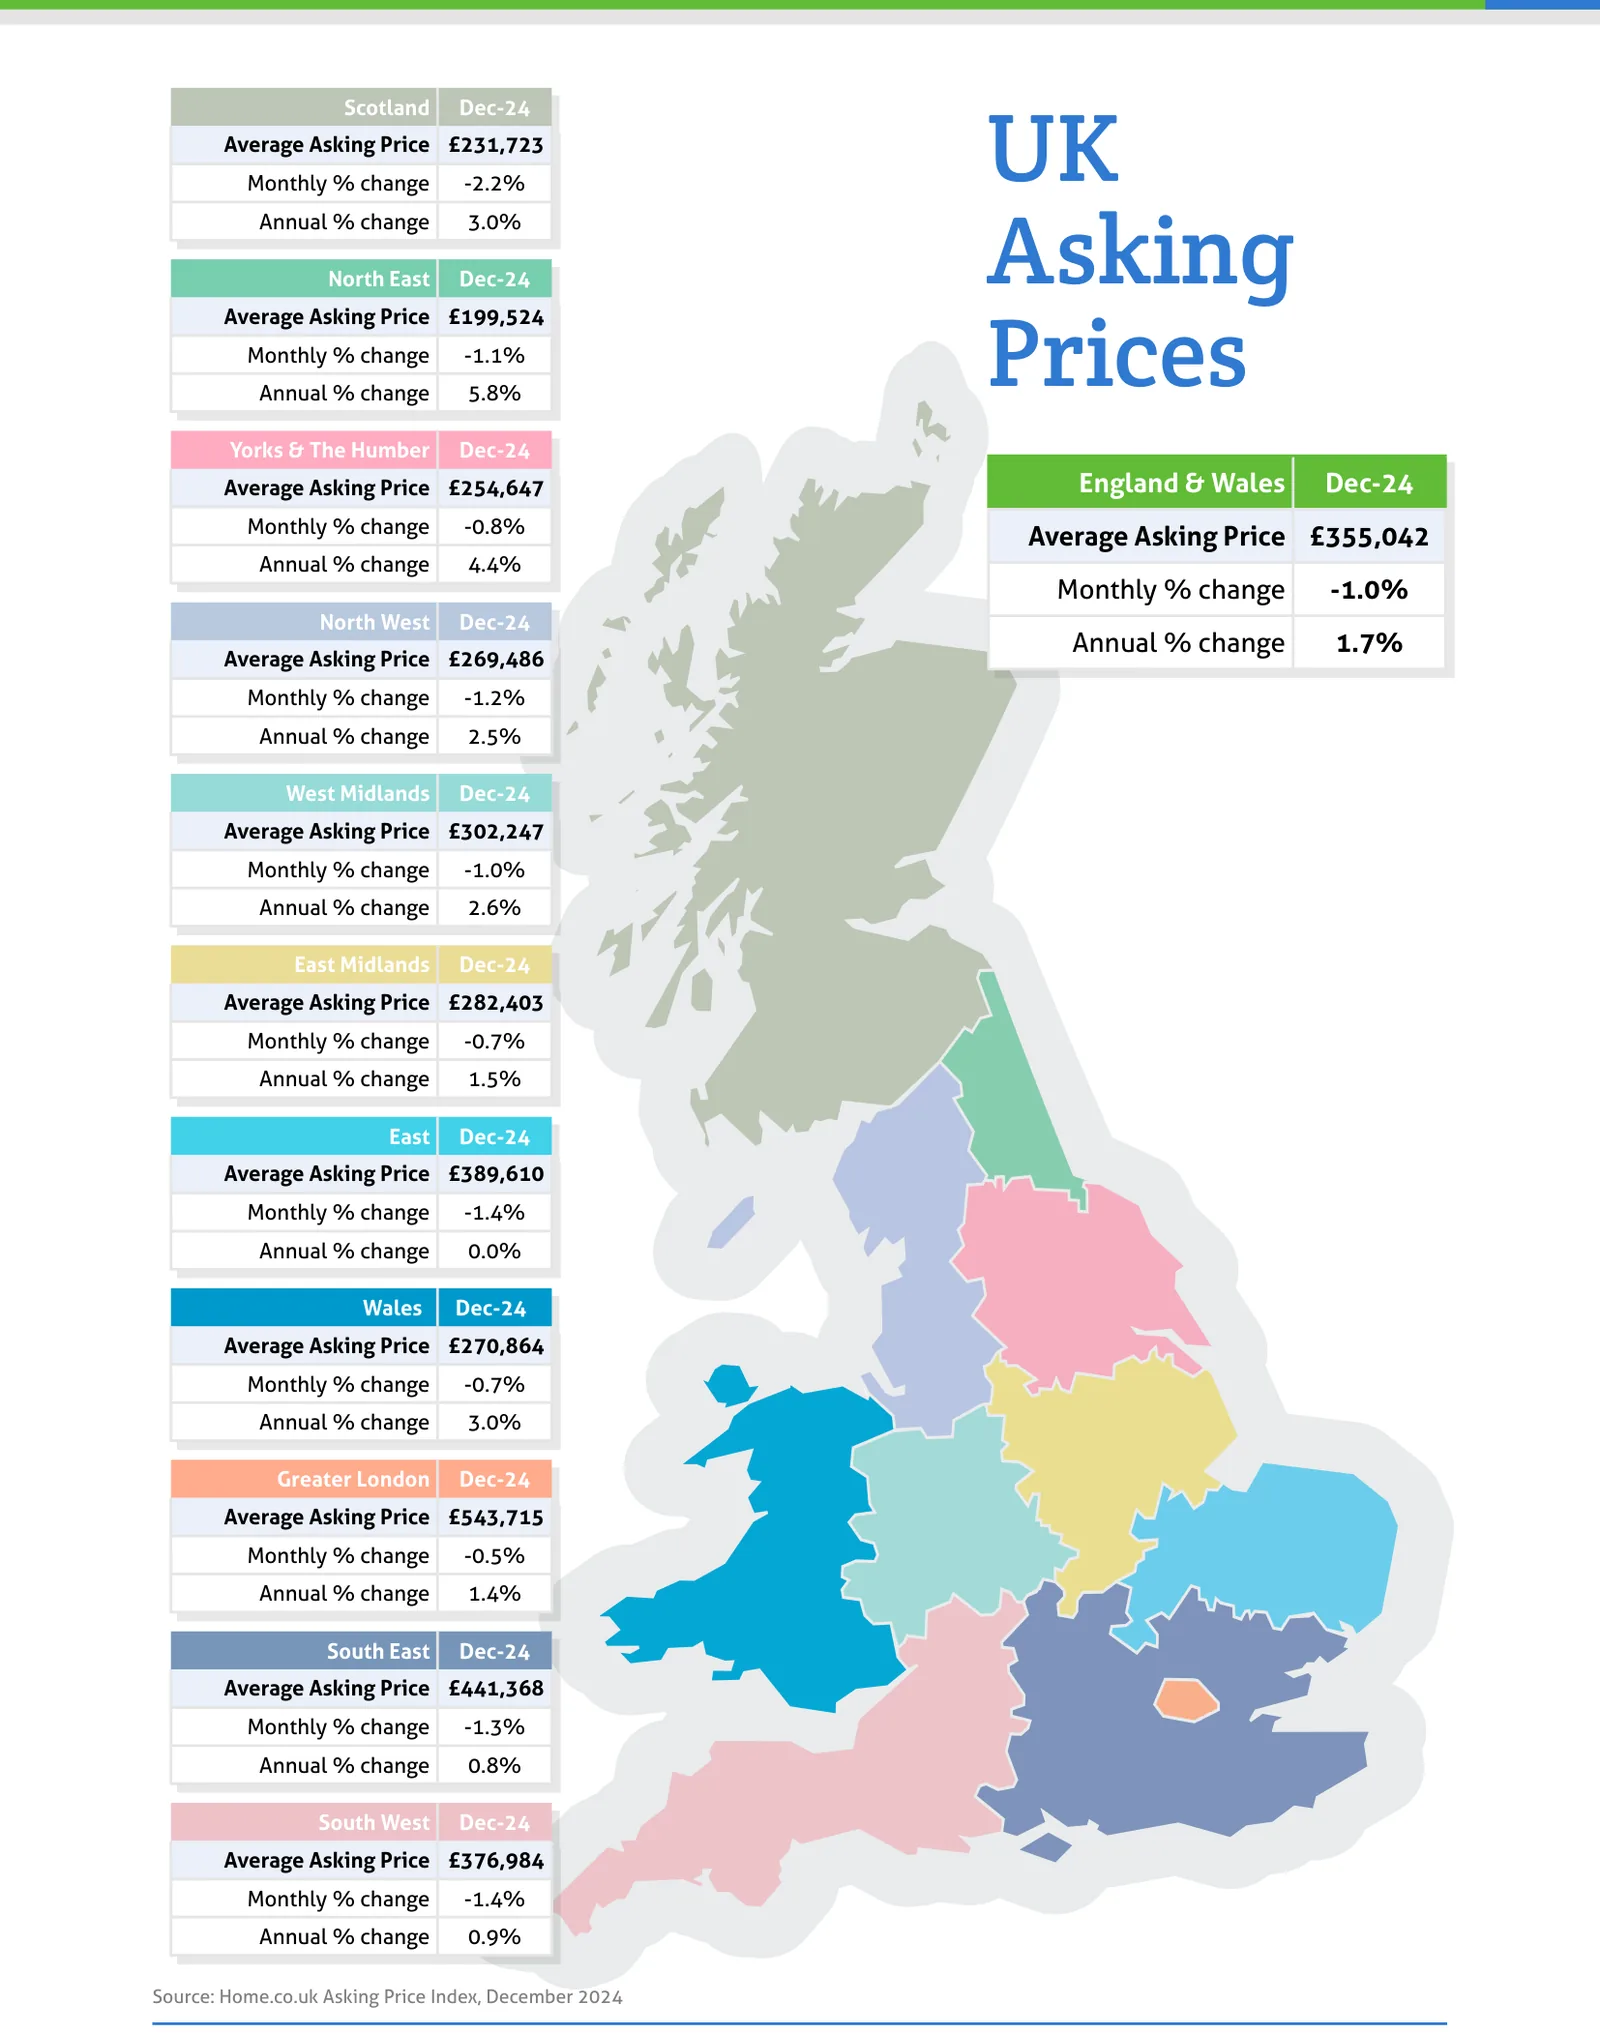
Source: Home.co.uk Asking Price Index, December 2024
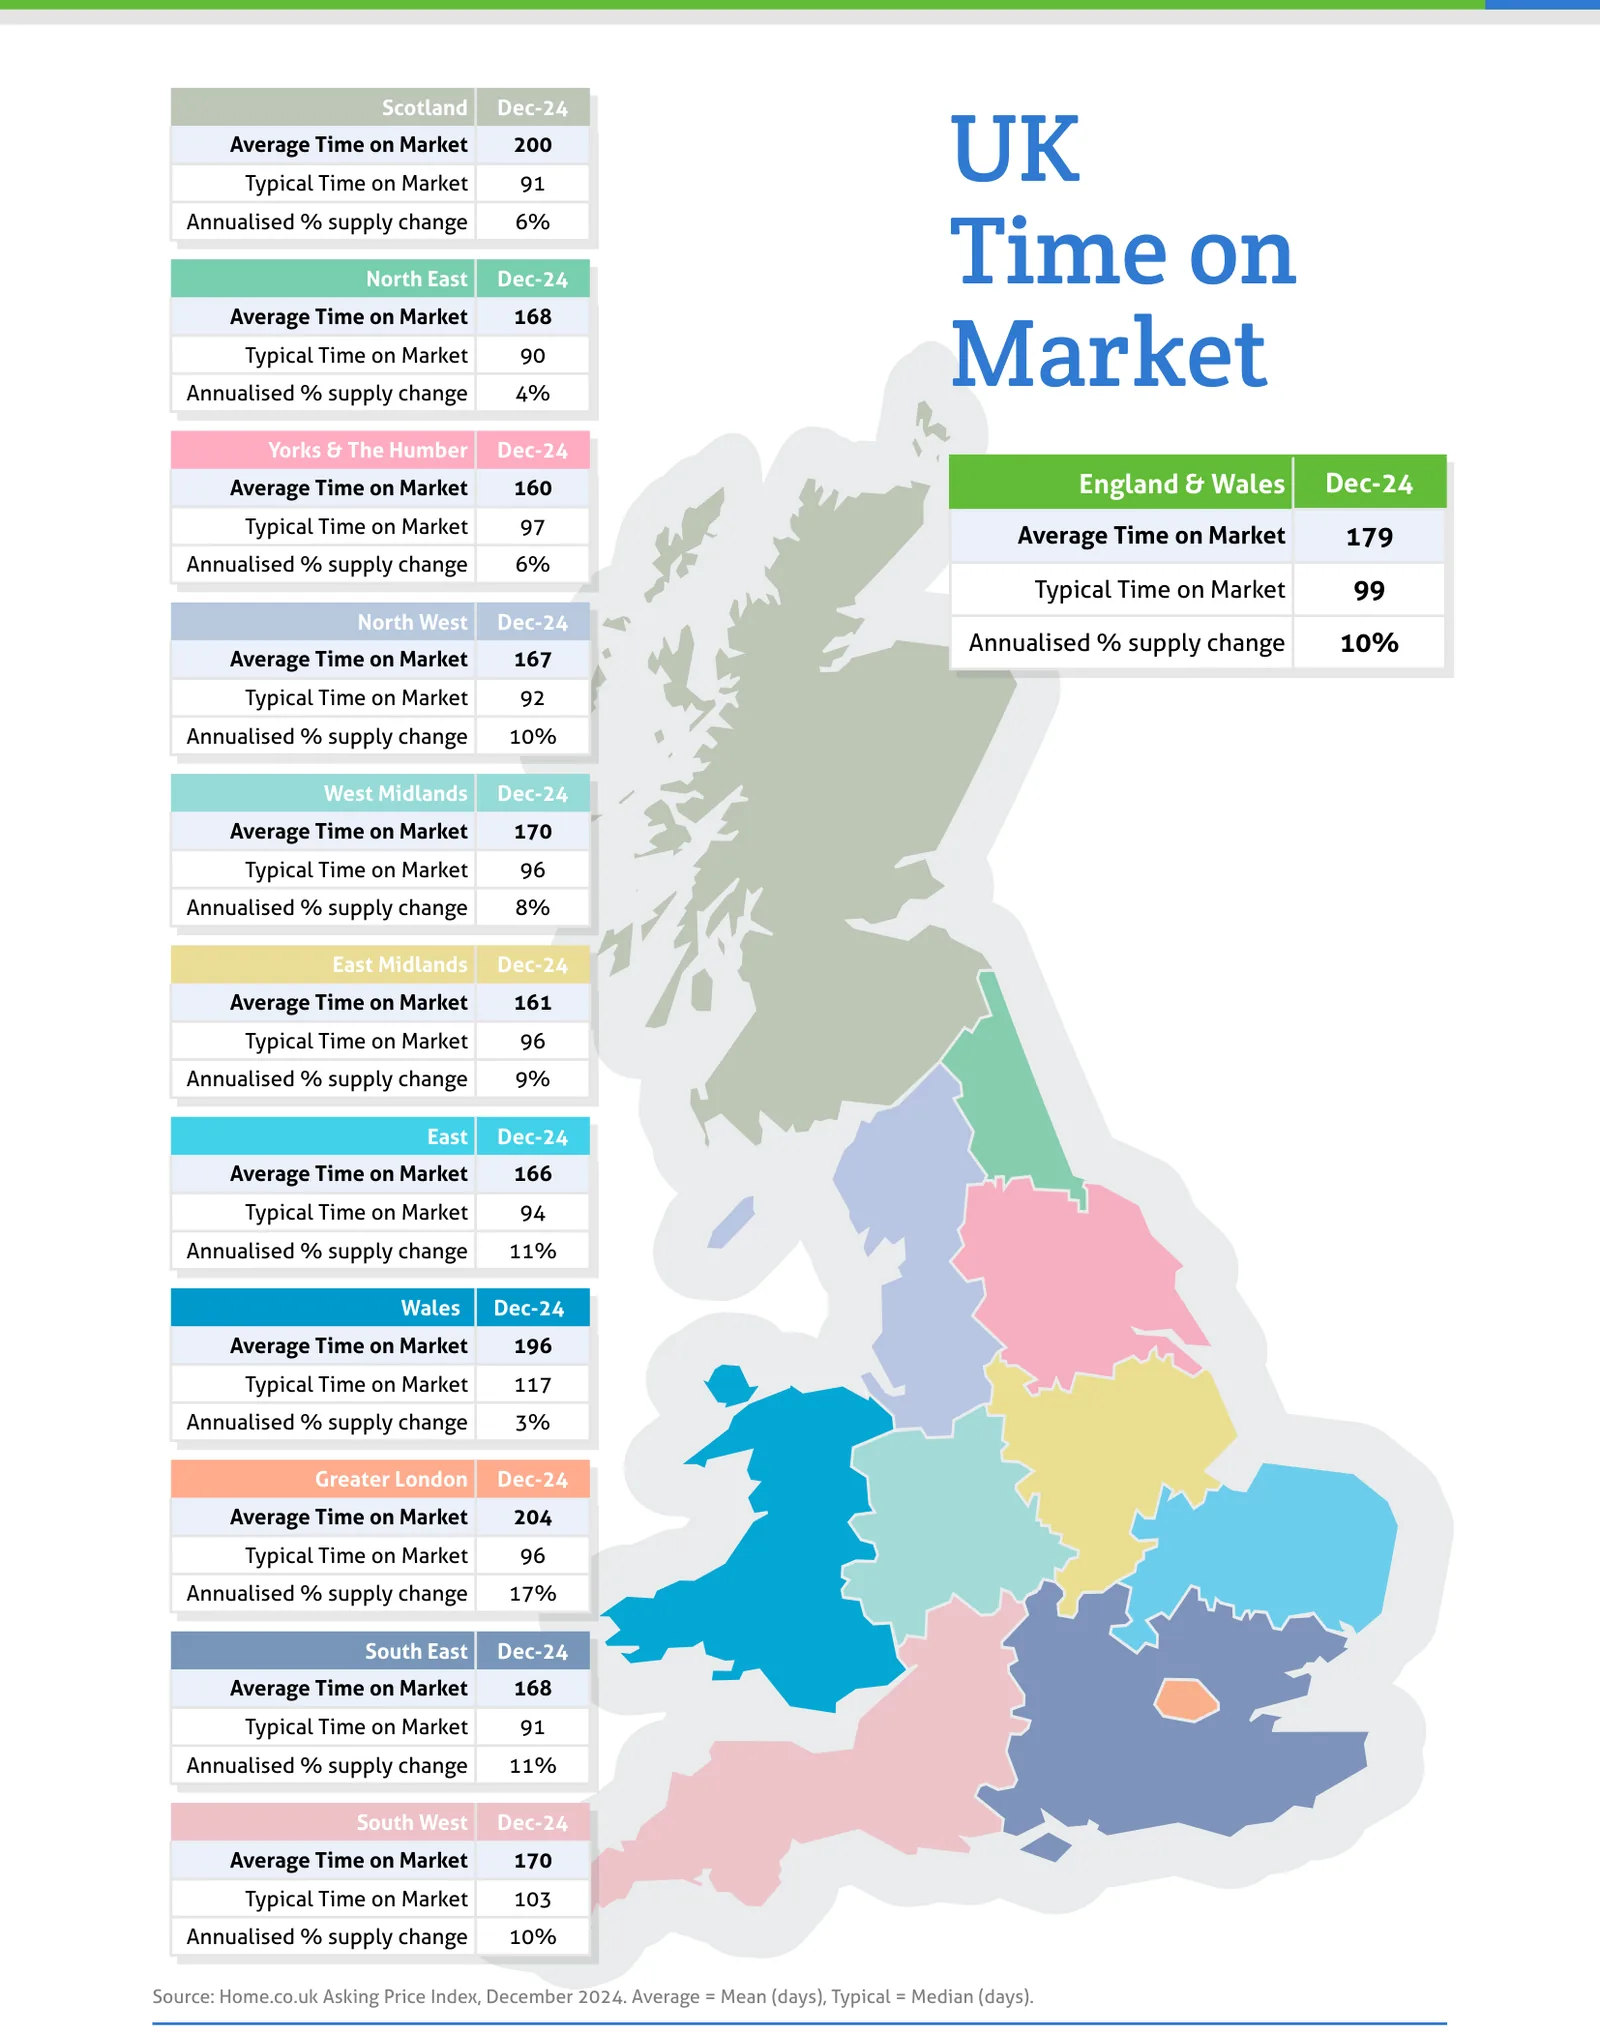
Source: Home.co.uk Asking Price Index, December 2024. Average = Mean (days), Typical = Median (days).
Regional tables
UK Asking Prices, Dec-24
| Region | Average Asking Price | Monthly % change | Annual % change |
|---|---|---|---|
| Scotland | £231,723 | -2.2% | 3.0% |
| North East | £199,524 | -1.1% | 5.8% |
| Yorks & The Humber | £254,647 | -0.8% | 4.4% |
| England & Wales | £355,042 | -1.0% | 1.7% |
| North West | £269,486 | -1.2% | 2.5% |
| West Midlands | £302,247 | -1.0% | 2.6% |
| East Midlands | £282,403 | -0.7% | 1.5% |
| East | £389,610 | -1.4% | 0.0% |
| Wales | £270,864 | -0.7% | 3.0% |
| Greater London | £543,715 | -0.5% | 1.4% |
| South East | £441,368 | -1.3% | 0.8% |
| South West | £376,984 | -1.4% | 0.9% |
UK Time on Market, Dec-24
| Region | Average Time on Market | Typical Time on Market | Annualised % supply change |
|---|---|---|---|
| Scotland | 200 | 91 | 6% |
| North East | 168 | 90 | 4% |
| Yorks & The Humber | 160 | 97 | 6% |
| England & Wales | 179 | 99 | 10% |
| North West | 167 | 92 | 10% |
| West Midlands | 170 | 96 | 8% |
| East Midlands | 161 | 96 | 9% |
| East | 166 | 94 | 11% |
| Wales | 196 | 117 | 3% |
| Greater London | 204 | 96 | 17% |
| South East | 168 | 91 | 11% |
| South West | 170 | 103 | 10% |
From the director's commentary
"That pressure has been exacerbated by what is seen by many as an attack on the buy-to-let market. So, without a significant cut in the Bank of England base rate, 2025 could get very ugly for significant numbers of mortgagees and landlords alike."
Doug Shephard, Director at Home.co.uk
Read the full December 2024 edition (PDF, 10 pages)
About the Home Asking Price Index
The Home Asking Price Index measures the change in the prices sellers ask for residential property across England, Wales and Scotland. Today it is computed every month from around half a million advertised homes and is mix-adjusted, so a change in what happens to be on the market does not move the figure; earlier editions state the sample they were built from. Because an asking price is set months before a sale completes, the index runs around five months ahead of completed-sale measures such as the UK House Price Index.
Every edition in the archive, back to October 2006, is listed on the index page. How we measure the UK property market explains the listing data behind it, and today's figures by area are on house prices and rental prices.
Text and figures above are quoted from the December 2024 edition as published, with punctuation normalised for the web, and are not revised. Later editions may restate them.
More in What is happening to house prices: the Home guide
Thinking about your next move?
See what your home's worth in seconds, with the UK's longest-running property data behind it.
Get an instant valuation