

























Home Asking Price Index, December 2023: stock levels drop further and prices post marginal year-on-year gain
Asking prices in England and Wales fell 0.7% in November but ended the year up 0.1%, while unsold stock dropped to 439,006 properties.
This is the December 2023 edition of the Home Asking Price Index, released on 13 December 2023, under the headline:
Stock Levels Drop Further and Prices Post Marginal Year-on-Year Gain
The headlines and summary below are the report's own words, with the key figures as it published them, followed by the report's charts and regional tables as printed.
Headlines
- Despite a seasonal monthly fall of 0.7% since last month, asking prices across England and Wales end the year up 0.1% vs. Dec 2022.
- The total sales stock count for England and Wales has plunged since the November reading. The current total of unsold property is 439,006, around 30,000 less than last month and typical for the time of year.
- The supply rate of new instructions entering the market remains remarkably restrained overall: down 1% year-on-year and down 8% vs. November 2018. The largest year-on-year fall in supply was in Greater London again (-8%).
- The Typical Time on Market for unsold property in England and Wales notched up an additional seven days during November in line with seasonal expectations. The current median is 100 days; in pre-COVID December 2019, the same measure was 106 days.
- Prices have fallen in all English regions, Scotland and Wales since last month in line with seasonal expectations; the largest falls were in Scotland (1.4%) and the East of England (1.3%).
- The regional property market growth league table has a new leader: the North East displaces Scotland with a year-on-year gain of 4.7%, just ahead of the North West at 4.6%. Greater London is now the worst performer at -2.0%.
- Rents across the UK fell by 2.0% over the last three months, thereby trimming the annualised change to just 5.3%. The regional leader in rental growth is the North West at 16.5%. Greater London is now the worst-performing region at just -0.9% due to a sustained surge in supply year-on-year.
- The current rent growth leaders in London asking rents are now the boroughs of Barking and Dagenham and Havering (+24.7% and +15.0% annualised respectively). Rent growth in the capital is becoming increasingly negative and ten prime boroughs now show year-on-year falls in asking rents, up from eight last month.
Summary
Home market values have gone sideways overall during the last year. Having rallied over the summer, prices edged down again in November (by 0.7%) in line with seasonal expectations, but annualised growth posts a positive figure (0.1%) for the first time in nine months. Limited stock for sale will support prices going forward.
Typical Time on Market for unsold property confirms that the market has retained sufficient momentum overall. However, at the regional level, Typical Time on Market figures indicate that the Midlands have slowed significantly when compared to their performance in 2018 and the North East and Scotland show vast improvement in marketing times over the same time frame. Moreover, vigorous northern markets remain significantly positive in terms of year-on-year price growth and are more or less keeping abreast of inflation.
Key figures
| Measure | Figure |
|---|---|
| Monthly change in asking prices | -0.7% |
| Annual change in asking prices | +0.1% |
| Total unsold stock | 439,006 |
| Change in new instructions (year-on-year) | -1% |
| Change in new instructions (vs Nov 2018) | -8% |
| Typical Time on Market | 100 days |
| Change in UK rents (3 months) | -2.0% |
| Annualised UK rent growth | 5.3% |
Figures are for England and Wales unless the report states otherwise, as published in the edition.
Charts from the report
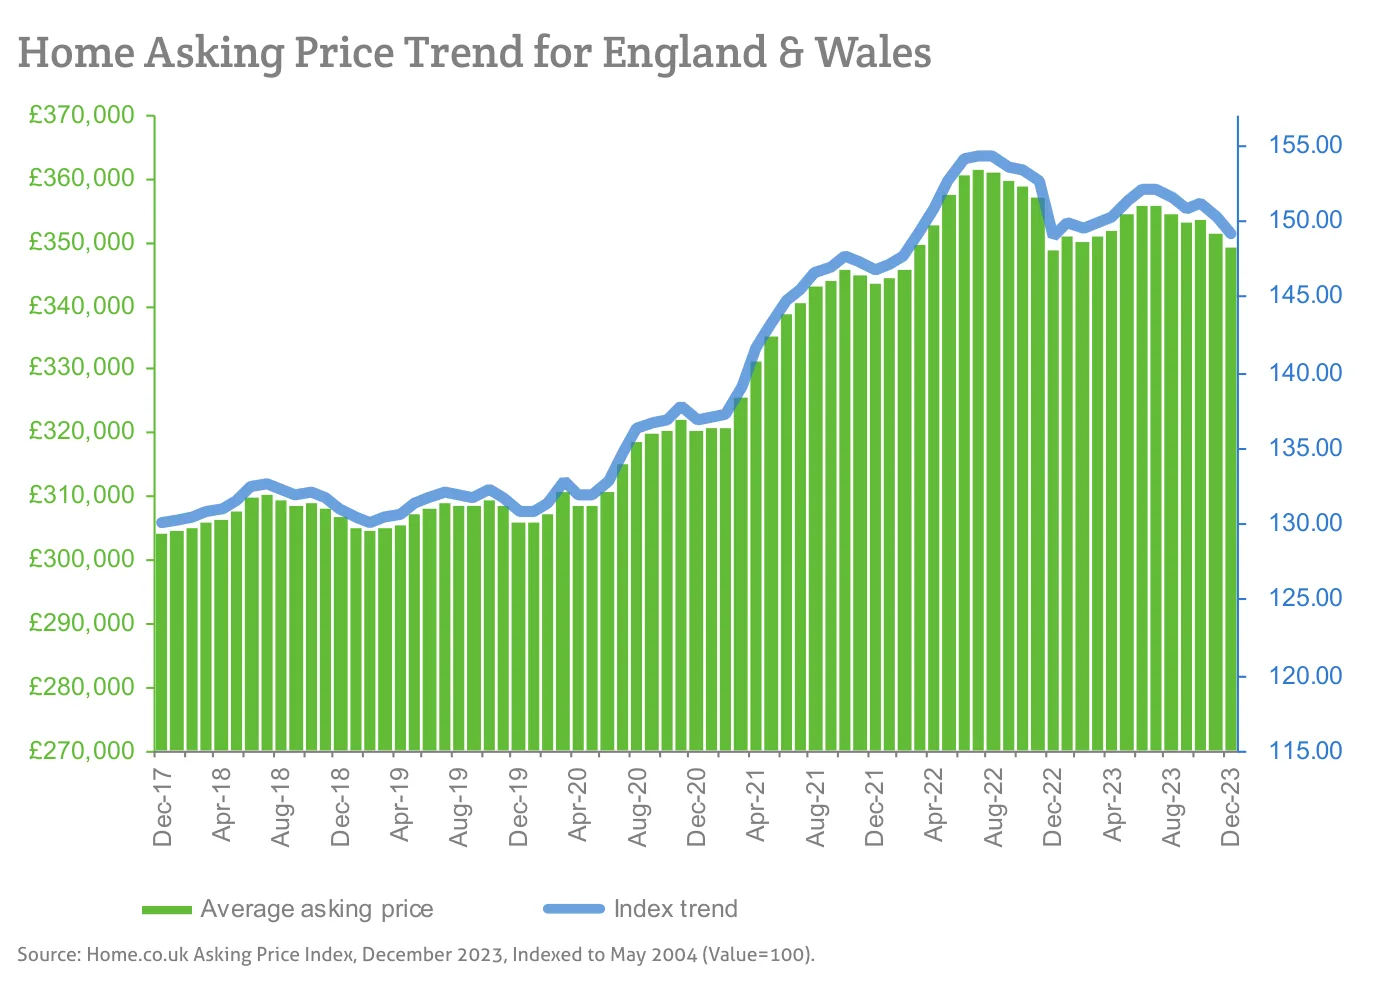
Source: Home.co.uk Asking Price Index, December 2023, Indexed to May 2004 (Value=100).
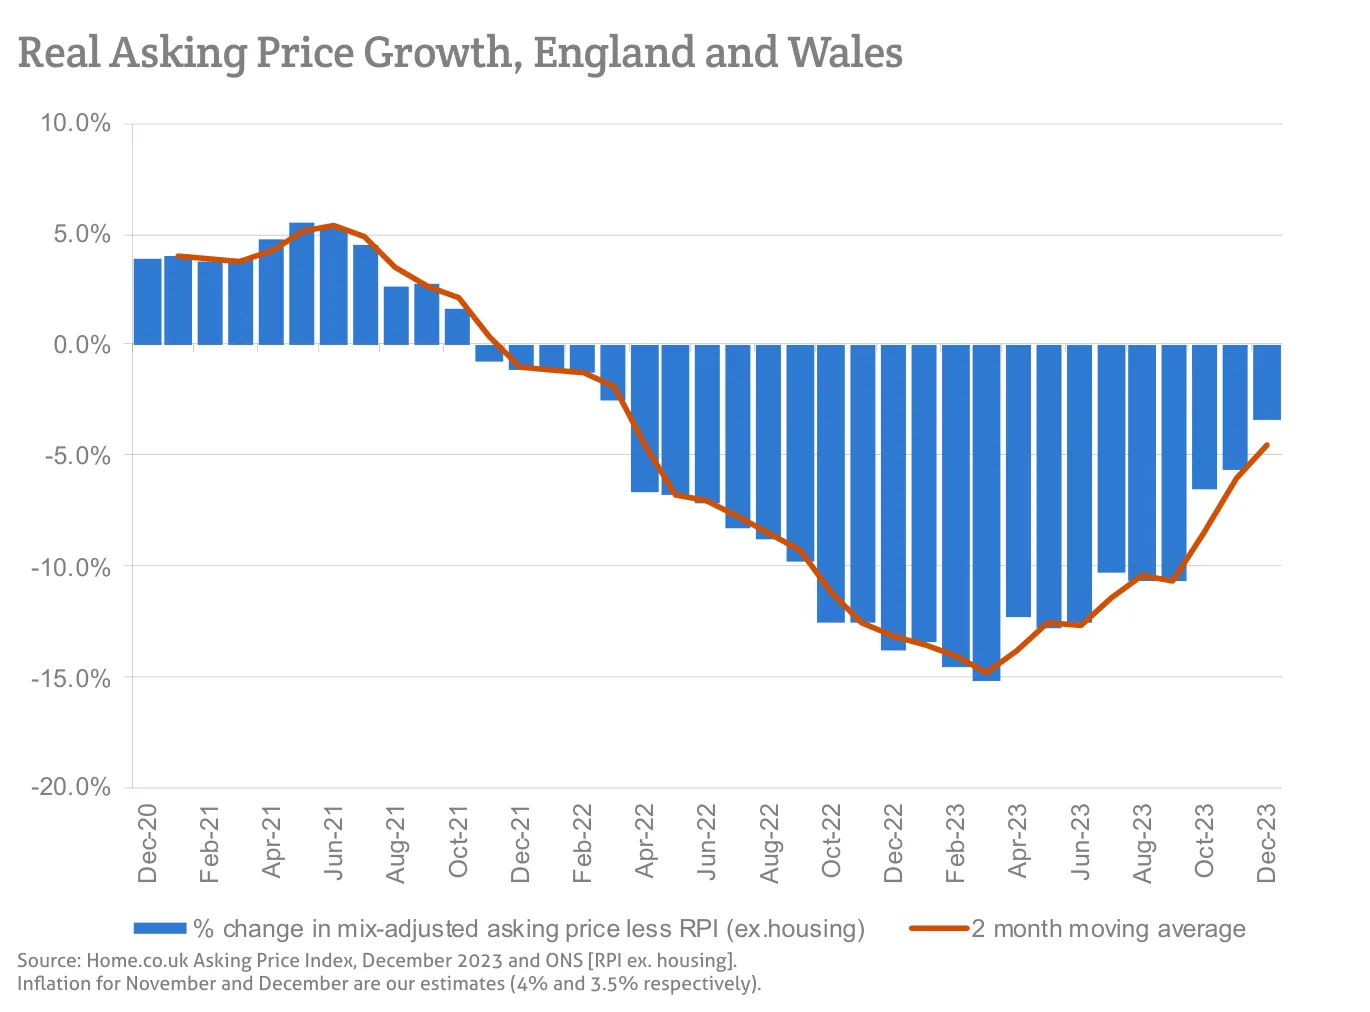
Source: Home.co.uk Asking Price Index, December 2023 and ONS [RPI ex. housing].
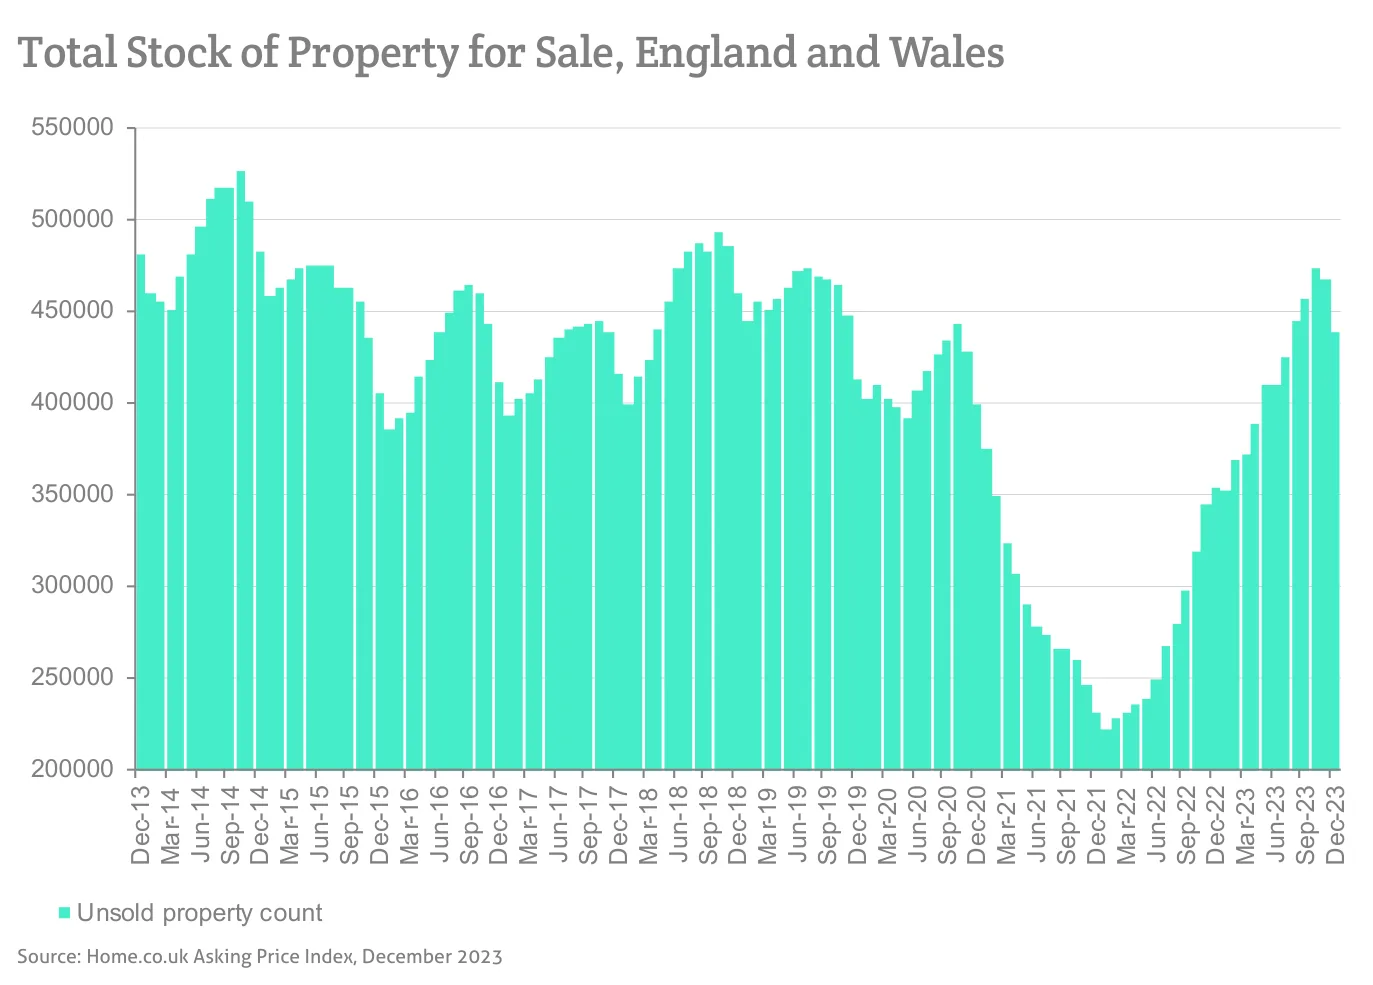
Source: Home.co.uk Asking Price Index, December 2023
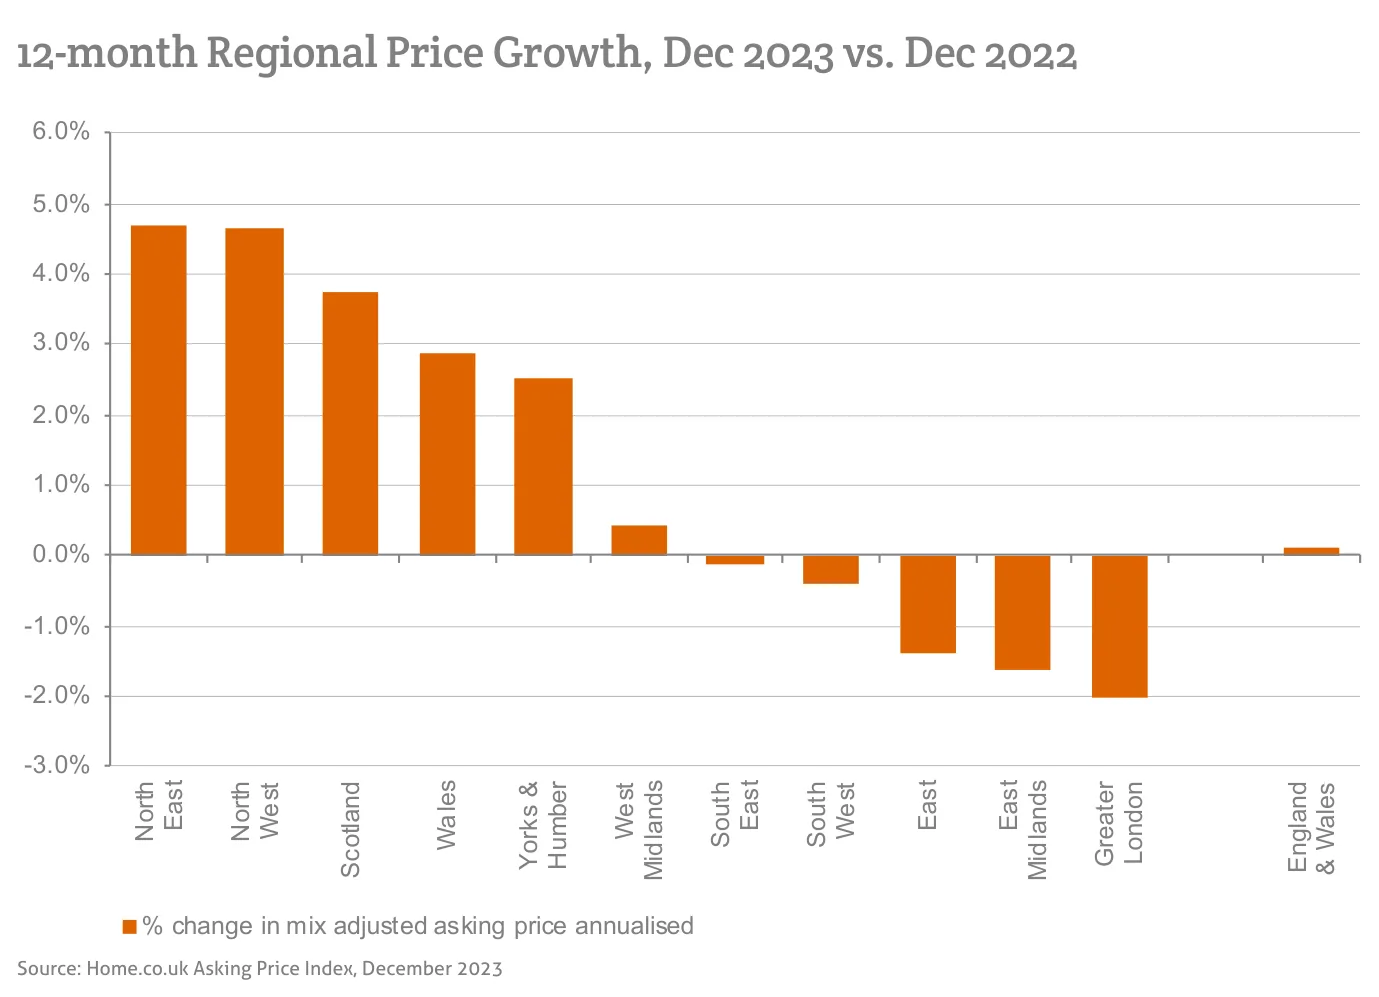
Source: Home.co.uk Asking Price Index, December 2023
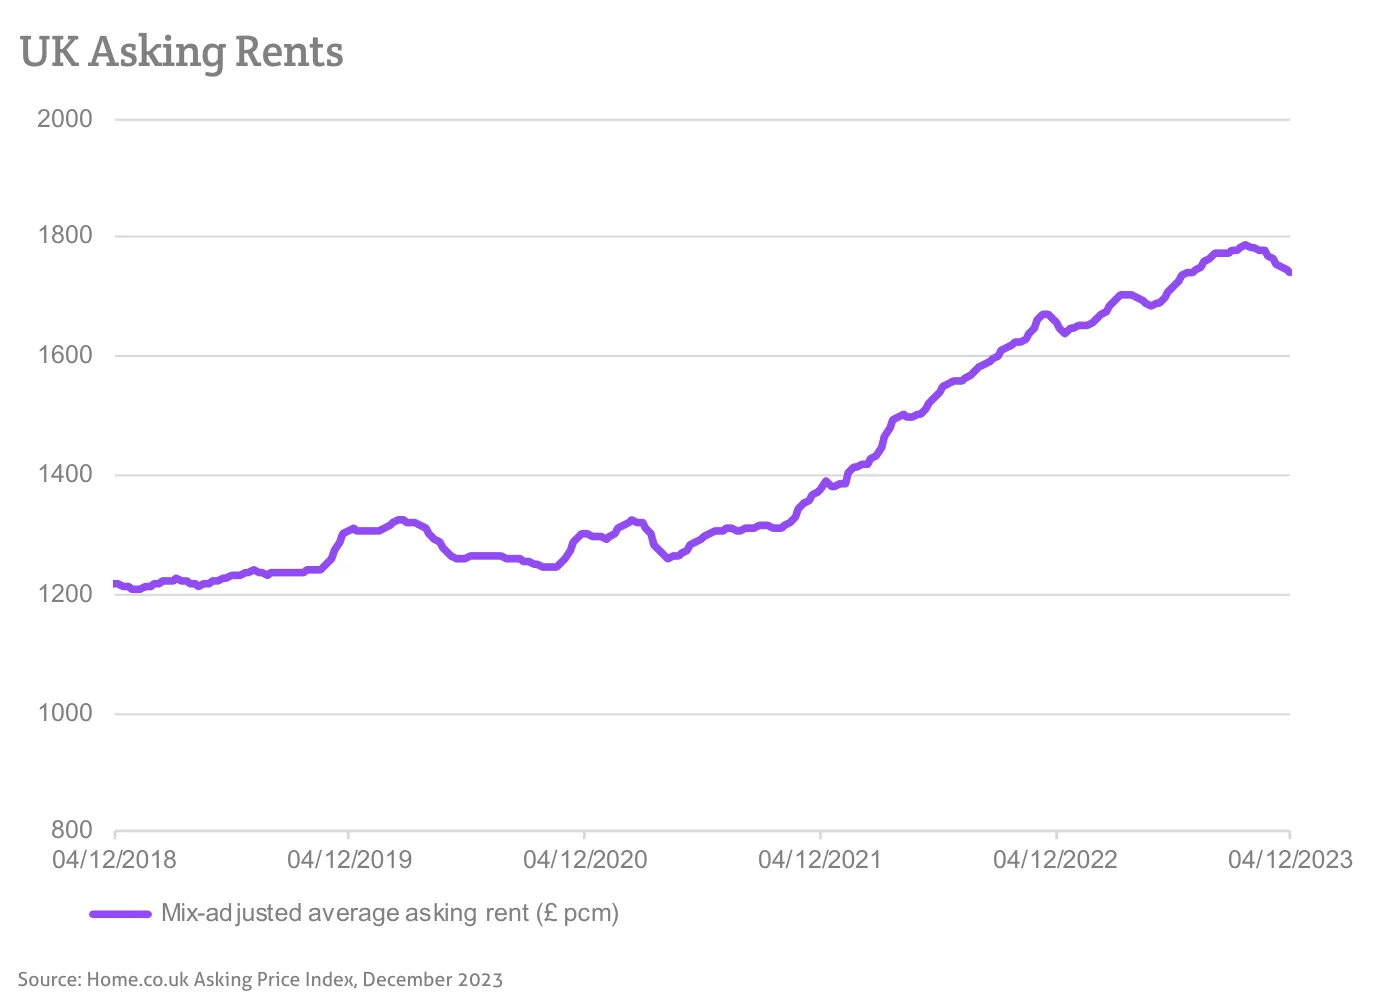
Source: Home.co.uk Asking Price Index, December 2023
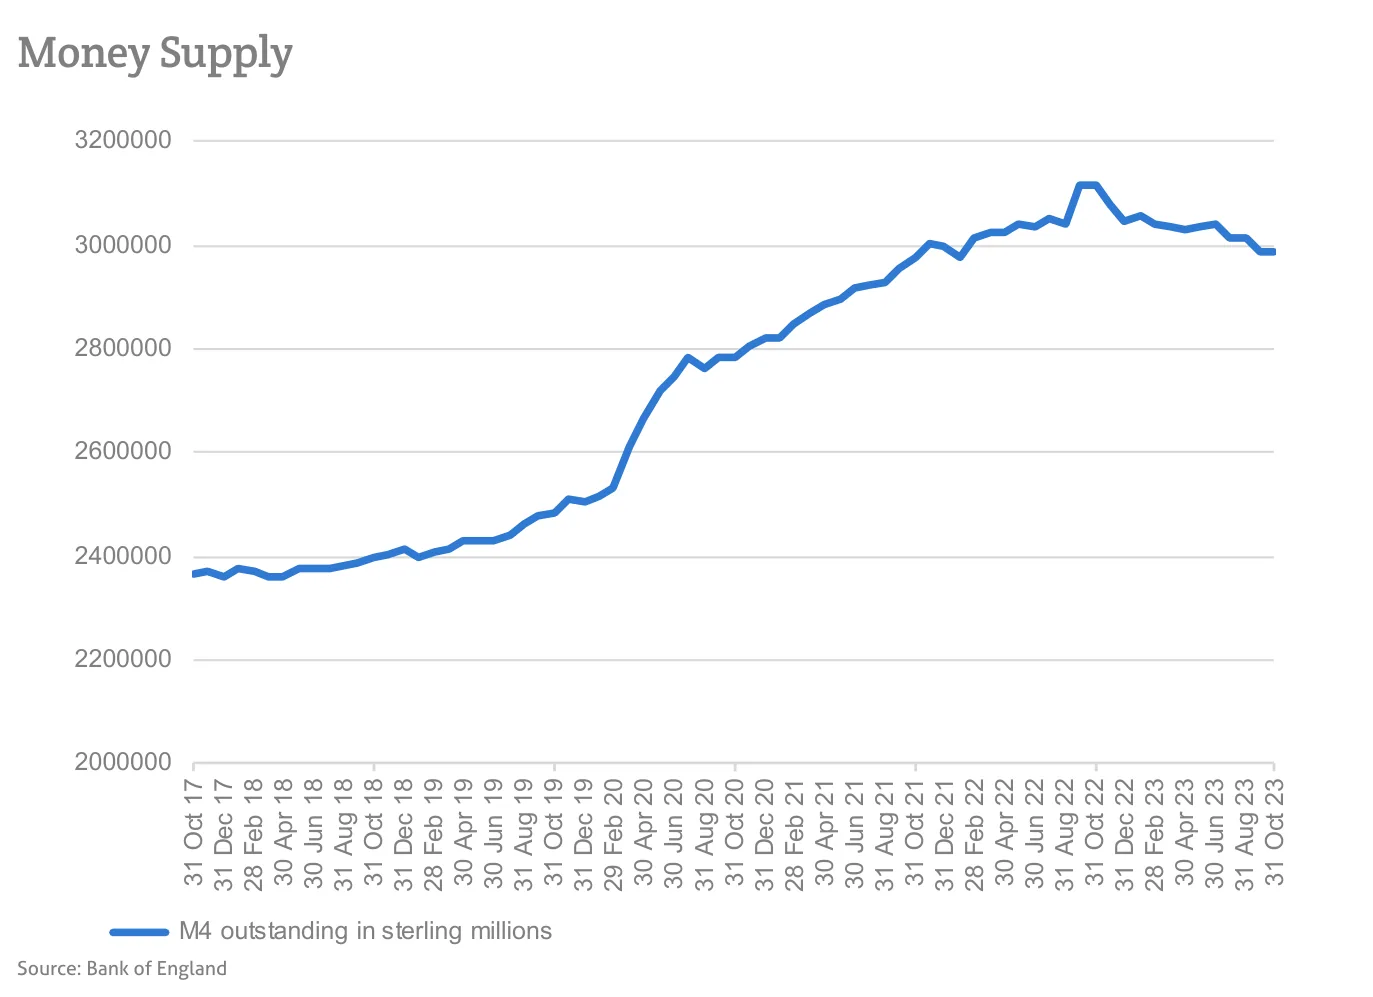
Source: Bank of England
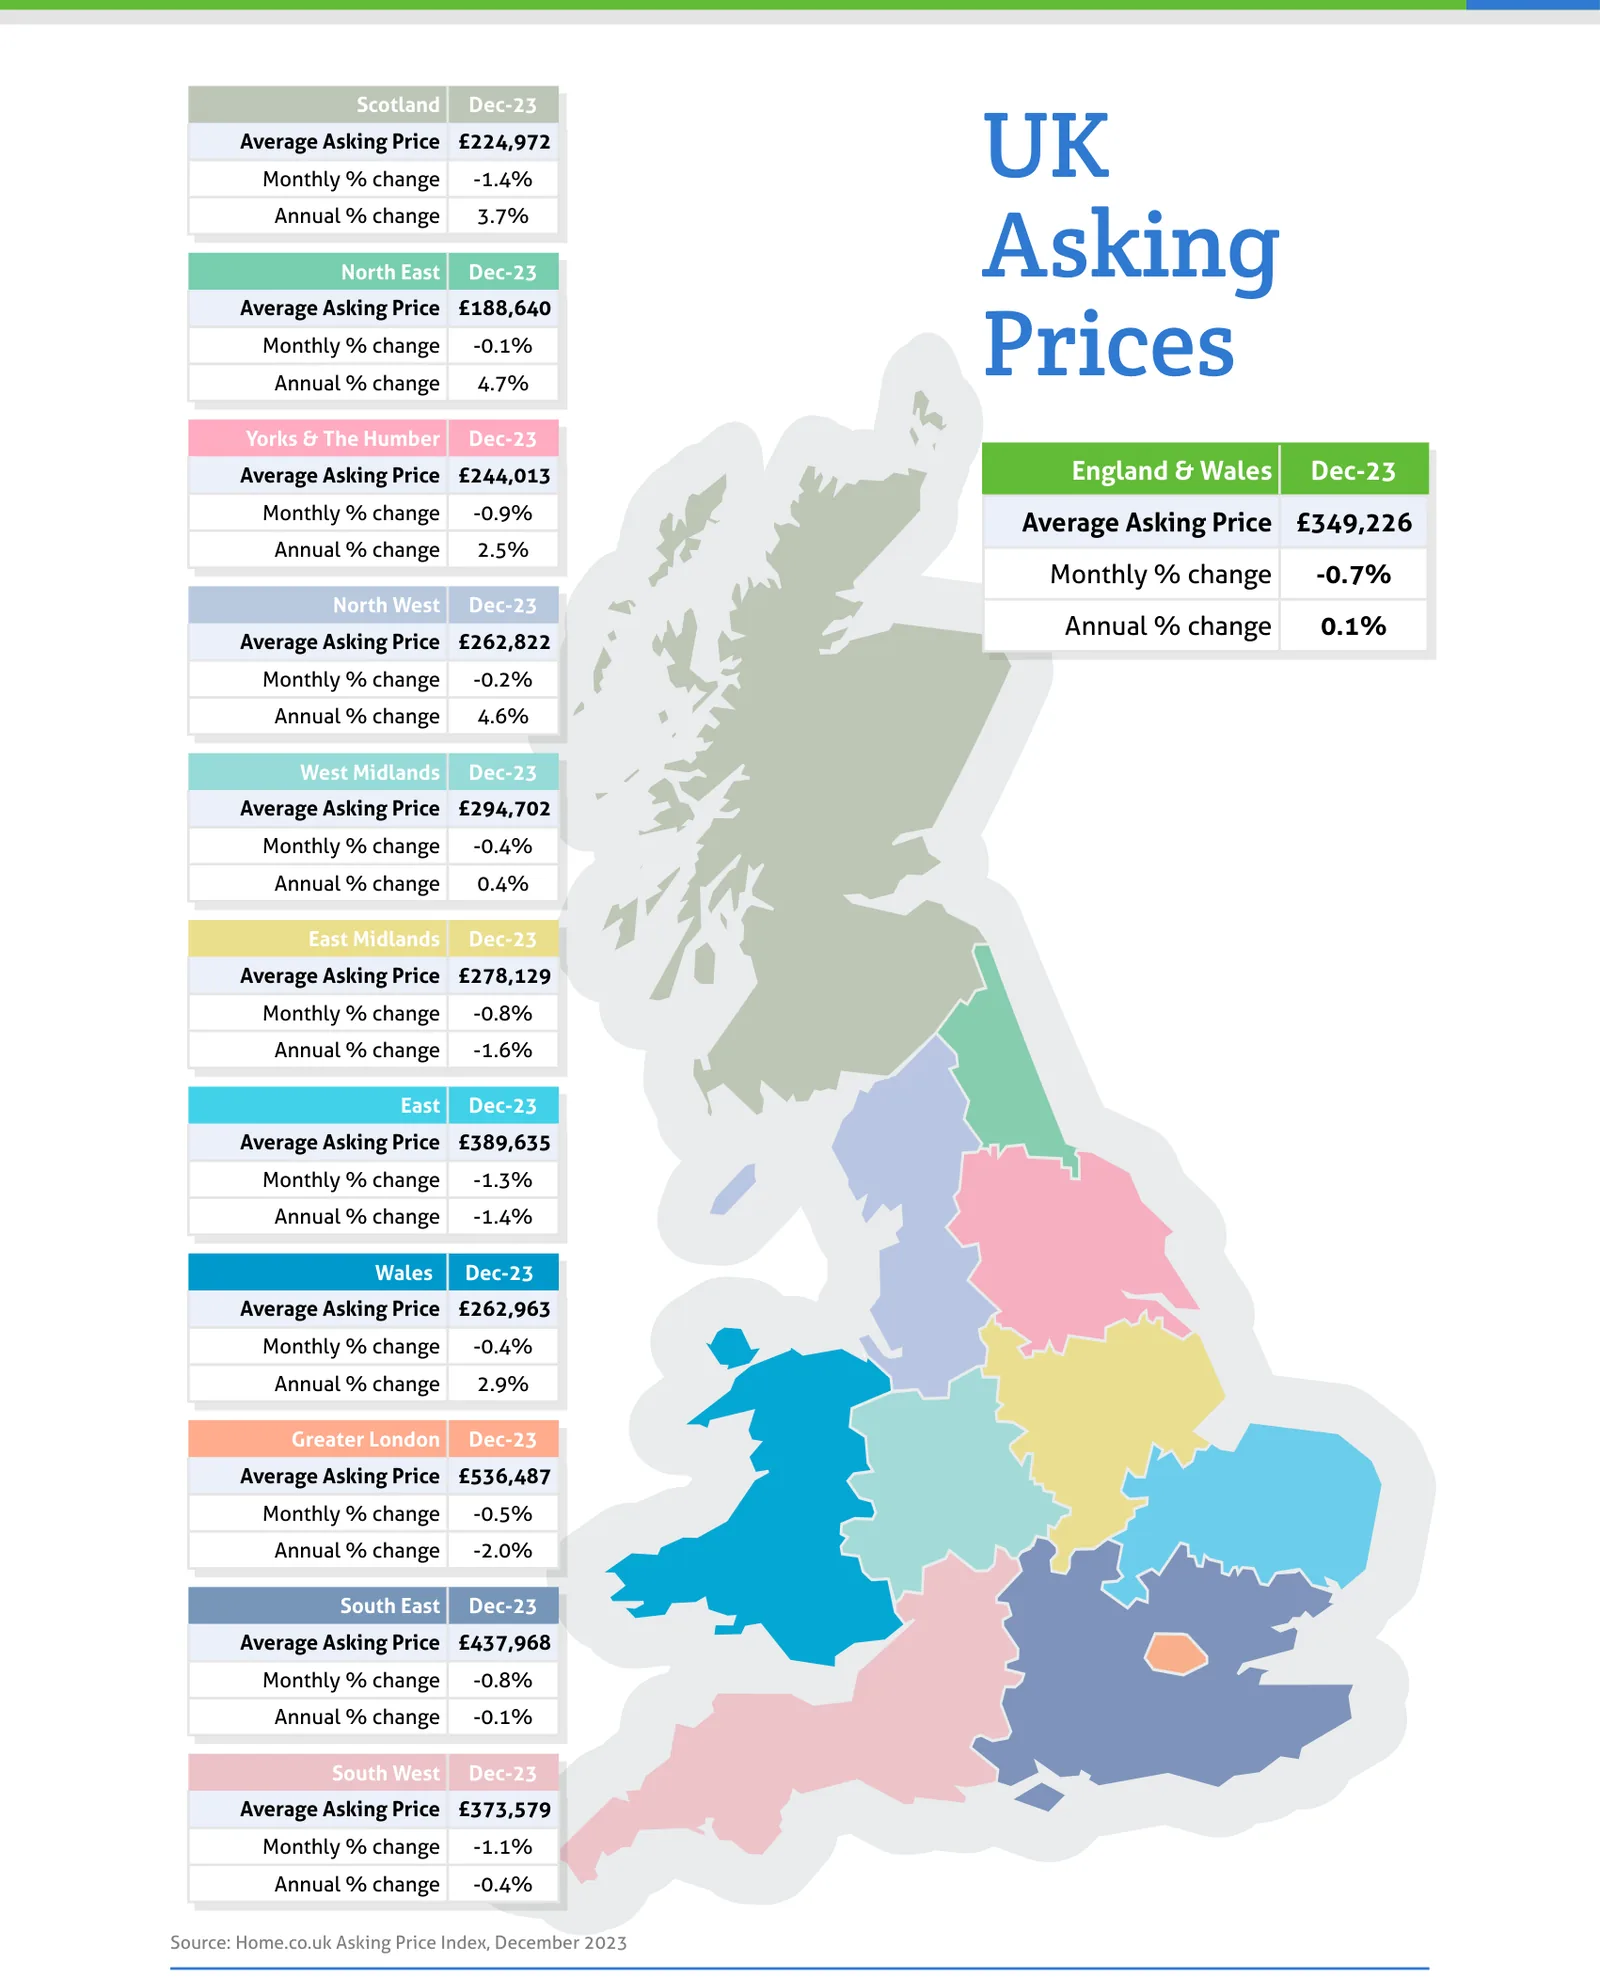
Source: Home.co.uk Asking Price Index, December 2023
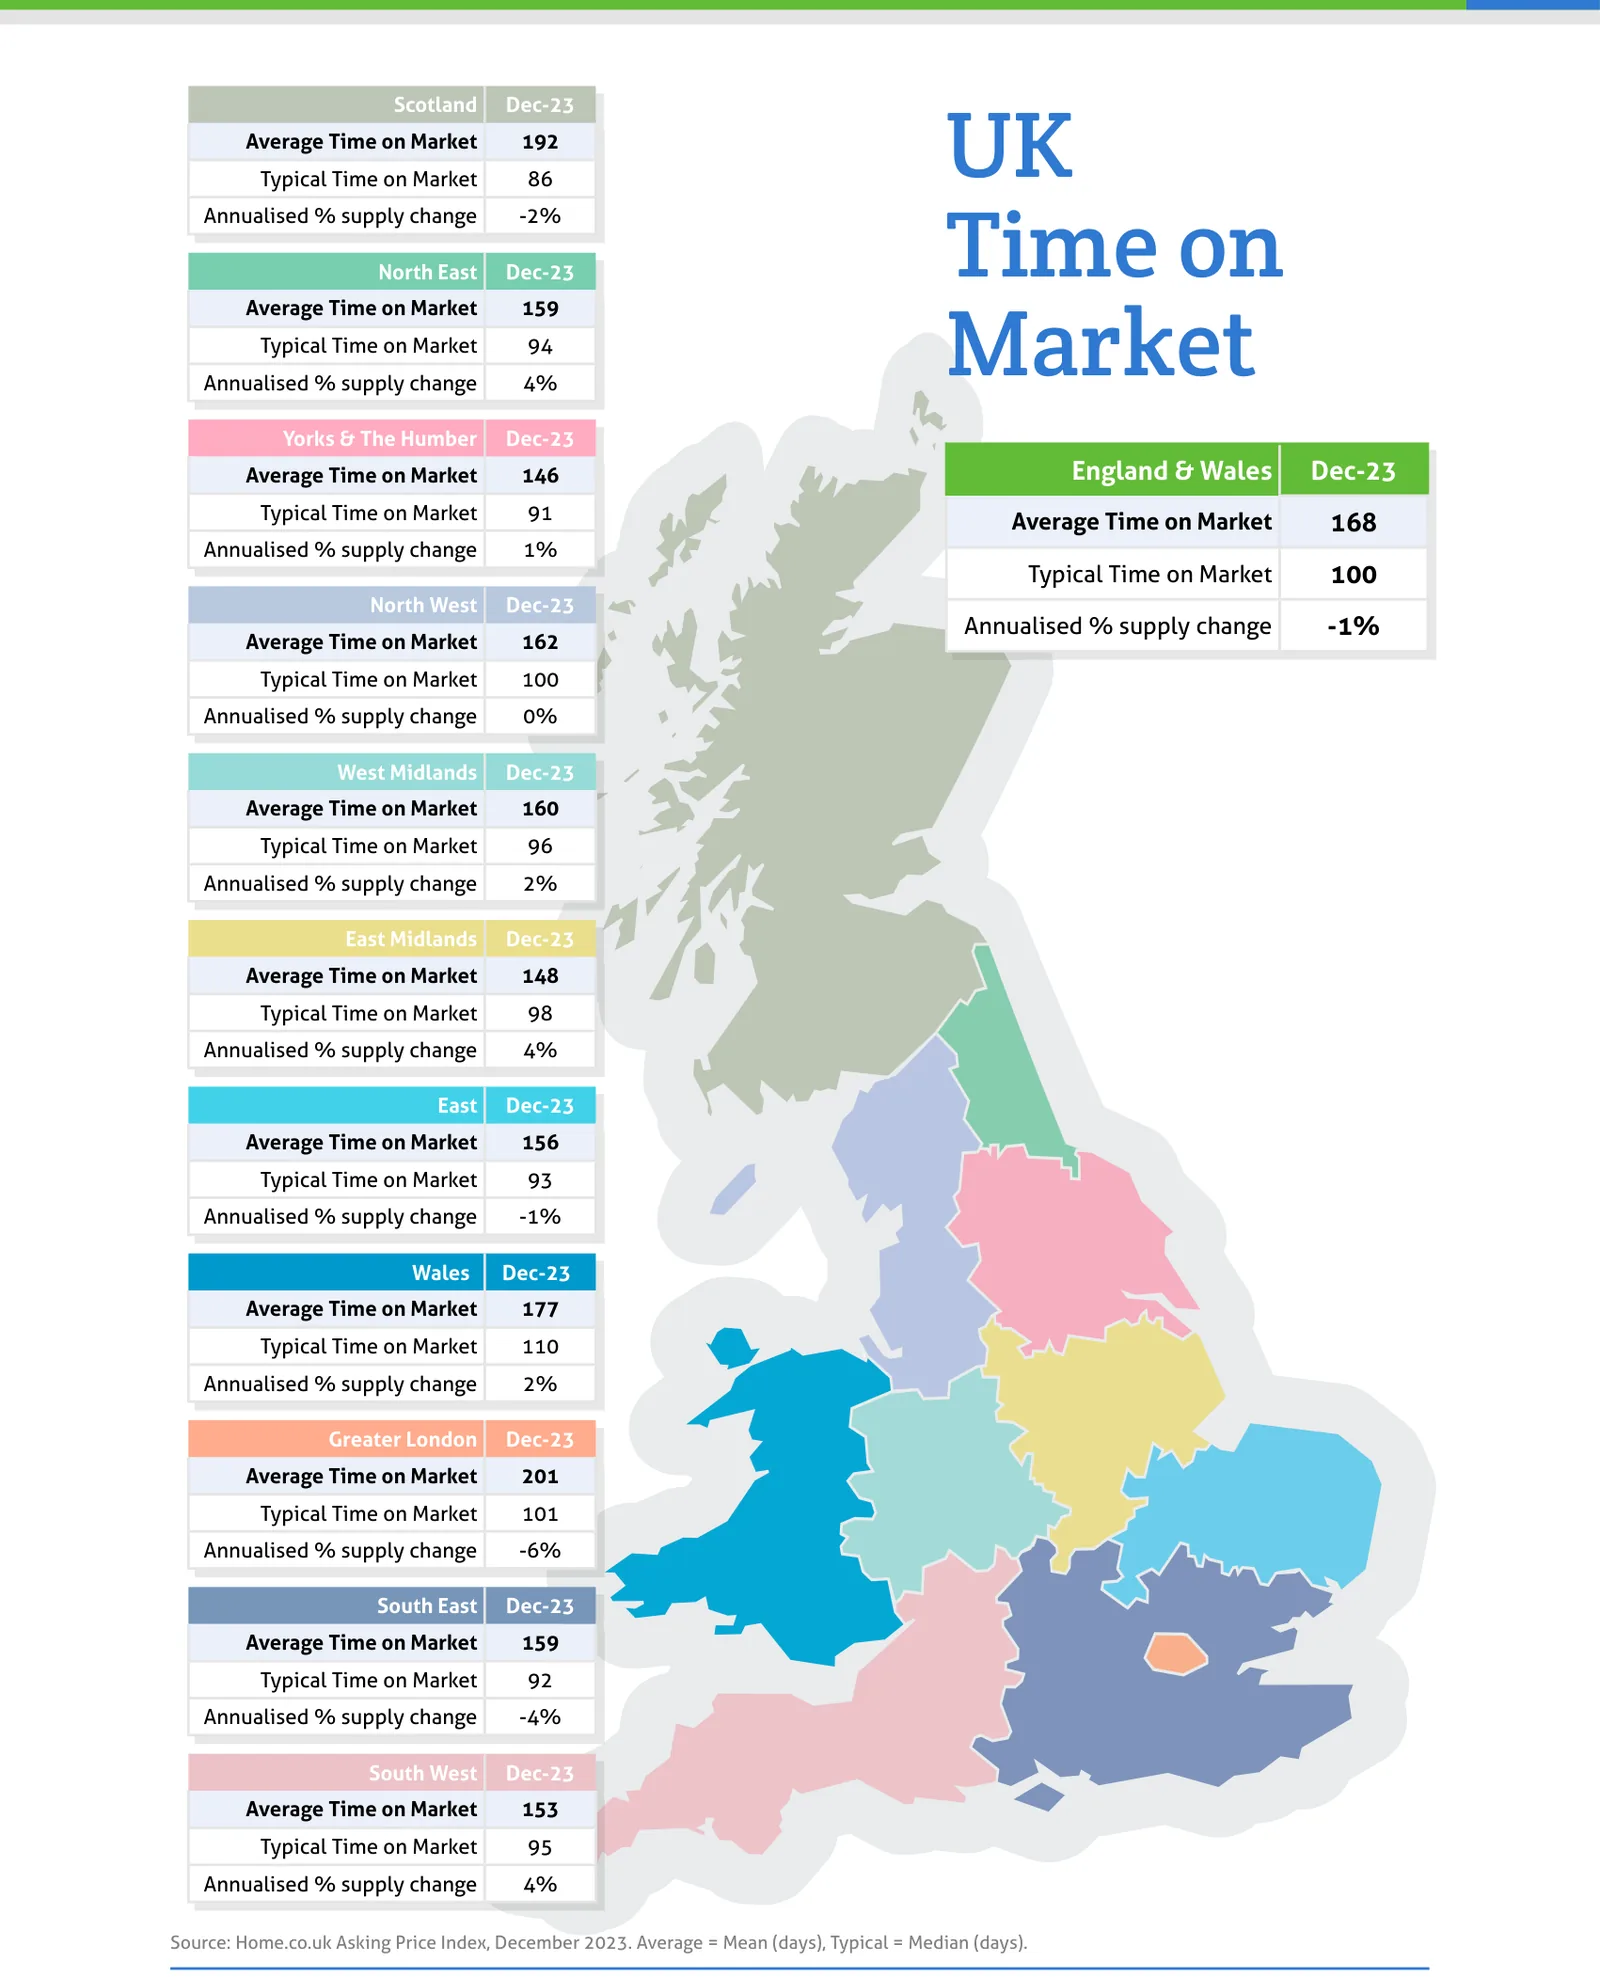
Source: Home.co.uk Asking Price Index, December 2023. Average = Mean (days), Typical = Median (days).
Regional tables
UK Asking Prices, Dec-23
| Region | Average Asking Price | Monthly % change | Annual % change |
|---|---|---|---|
| Scotland | £224,972 | -1.4% | 3.7% |
| North East | £188,640 | -0.1% | 4.7% |
| Yorks & The Humber | £244,013 | -0.9% | 2.5% |
| England & Wales | £349,226 | -0.7% | 0.1% |
| North West | £262,822 | -0.2% | 4.6% |
| West Midlands | £294,702 | -0.4% | 0.4% |
| East Midlands | £278,129 | -0.8% | -1.6% |
| East | £389,635 | -1.3% | -1.4% |
| Wales | £262,963 | -0.4% | 2.9% |
| Greater London | £536,487 | -0.5% | -2.0% |
| South East | £437,968 | -0.8% | -0.1% |
| South West | £373,579 | -1.1% | -0.4% |
UK Time on Market, Dec-23
| Region | Average Time on Market | Typical Time on Market | Annualised % supply change |
|---|---|---|---|
| Scotland | 192 | 86 | -2% |
| North East | 159 | 94 | 4% |
| Yorks & The Humber | 146 | 91 | 1% |
| England & Wales | 168 | 100 | -1% |
| North West | 162 | 100 | 0% |
| West Midlands | 160 | 96 | 2% |
| East Midlands | 148 | 98 | 4% |
| East | 156 | 93 | -1% |
| Wales | 177 | 110 | 2% |
| Greater London | 201 | 101 | -6% |
| South East | 159 | 92 | -4% |
| South West | 153 | 95 | 4% |
From the director's commentary
"Moreover, the drop in the money supply coincides with the sudden property price drop in December 2022, following the ill-fated Truss-Kwarteng budget and the sudden rise in bond yields (and mortgage rates)."
Doug Shephard, Director at Home.co.uk
Read the full December 2023 edition (PDF, 11 pages)
About the Home Asking Price Index
The Home Asking Price Index measures the change in the prices sellers ask for residential property across England, Wales and Scotland. Today it is computed every month from around half a million advertised homes and is mix-adjusted, so a change in what happens to be on the market does not move the figure; earlier editions state the sample they were built from. Because an asking price is set months before a sale completes, the index runs around five months ahead of completed-sale measures such as the UK House Price Index.
Every edition in the archive, back to October 2006, is listed on the index page. How we measure the UK property market explains the listing data behind it, and today's figures by area are on house prices and rental prices.
Text and figures above are quoted from the December 2023 edition as published, with punctuation normalised for the web, and are not revised. Later editions may restate them.
More in What is happening to house prices: the Home guide
Thinking about your next move?
See what your home's worth in seconds, with the UK's longest-running property data behind it.
Get an instant valuation