

























Home Asking Price Index, December 2022: market turmoil as vendors quit and prices take a haircut
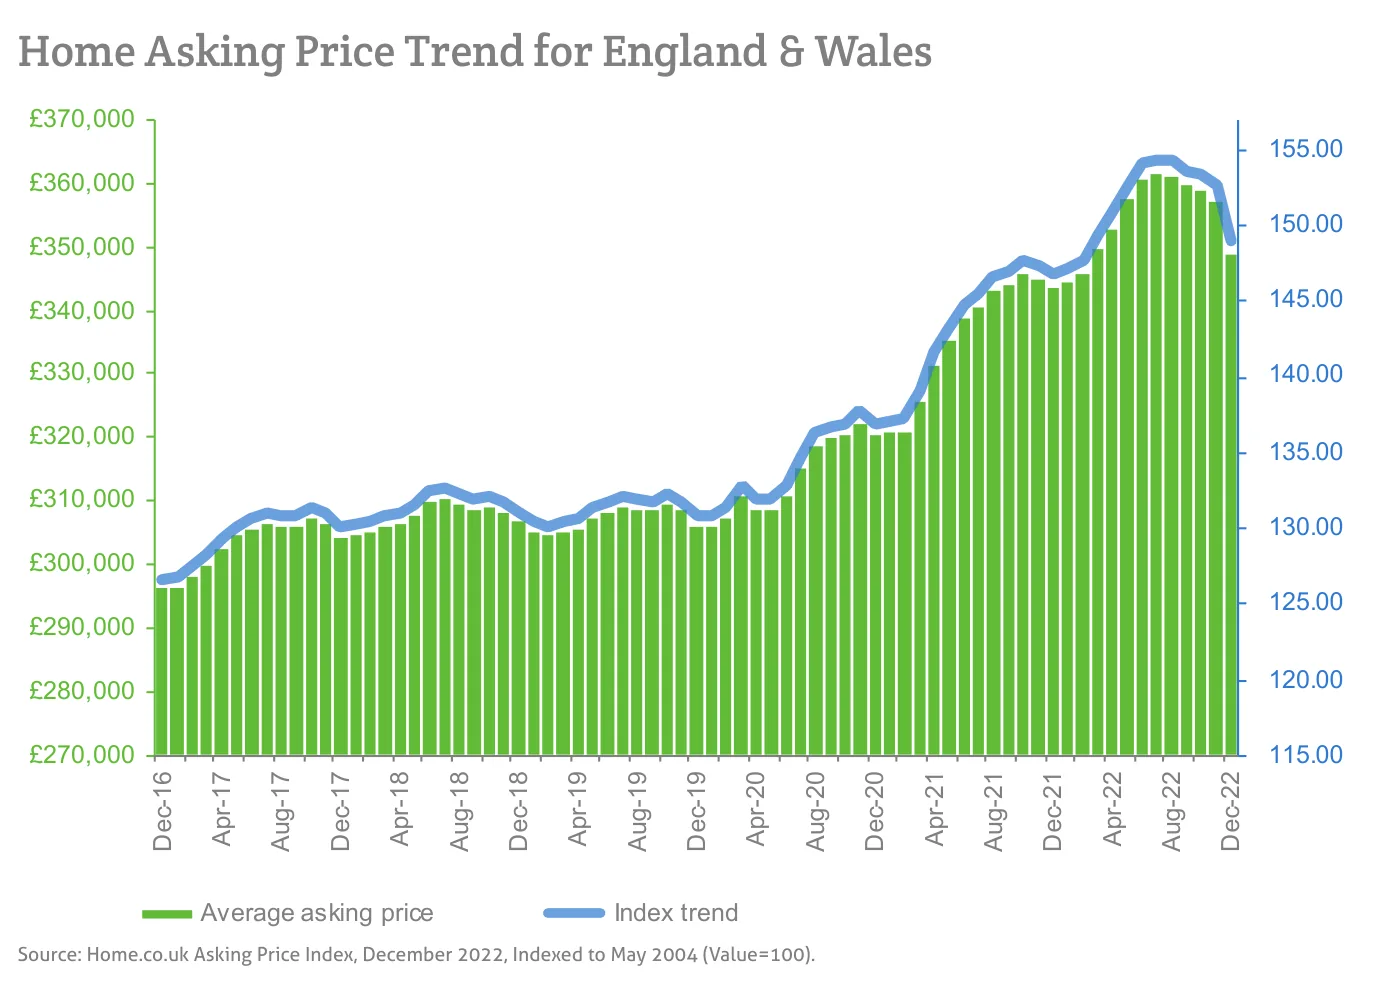
Asking prices across England and Wales fell 2.4% in November, the fourth consecutive monthly drop, cutting annual growth to 1.5%.

This is the December 2022 edition of the Home Asking Price Index, released on 14 December 2022, under the headline:
Market Turmoil as Vendors Quit and Prices Take a Haircut
The headlines and summary below are the report's own words, with the key figures as it published them, followed by the report's charts and regional tables as printed.
Headlines
- Asking prices across England and Wales dropped suddenly by 2.4% during November. This fourth consecutive monthly fall brings year-on-year growth down to just 1.5%.
- Asking prices fell in every English region, Scotland and Wales during November.
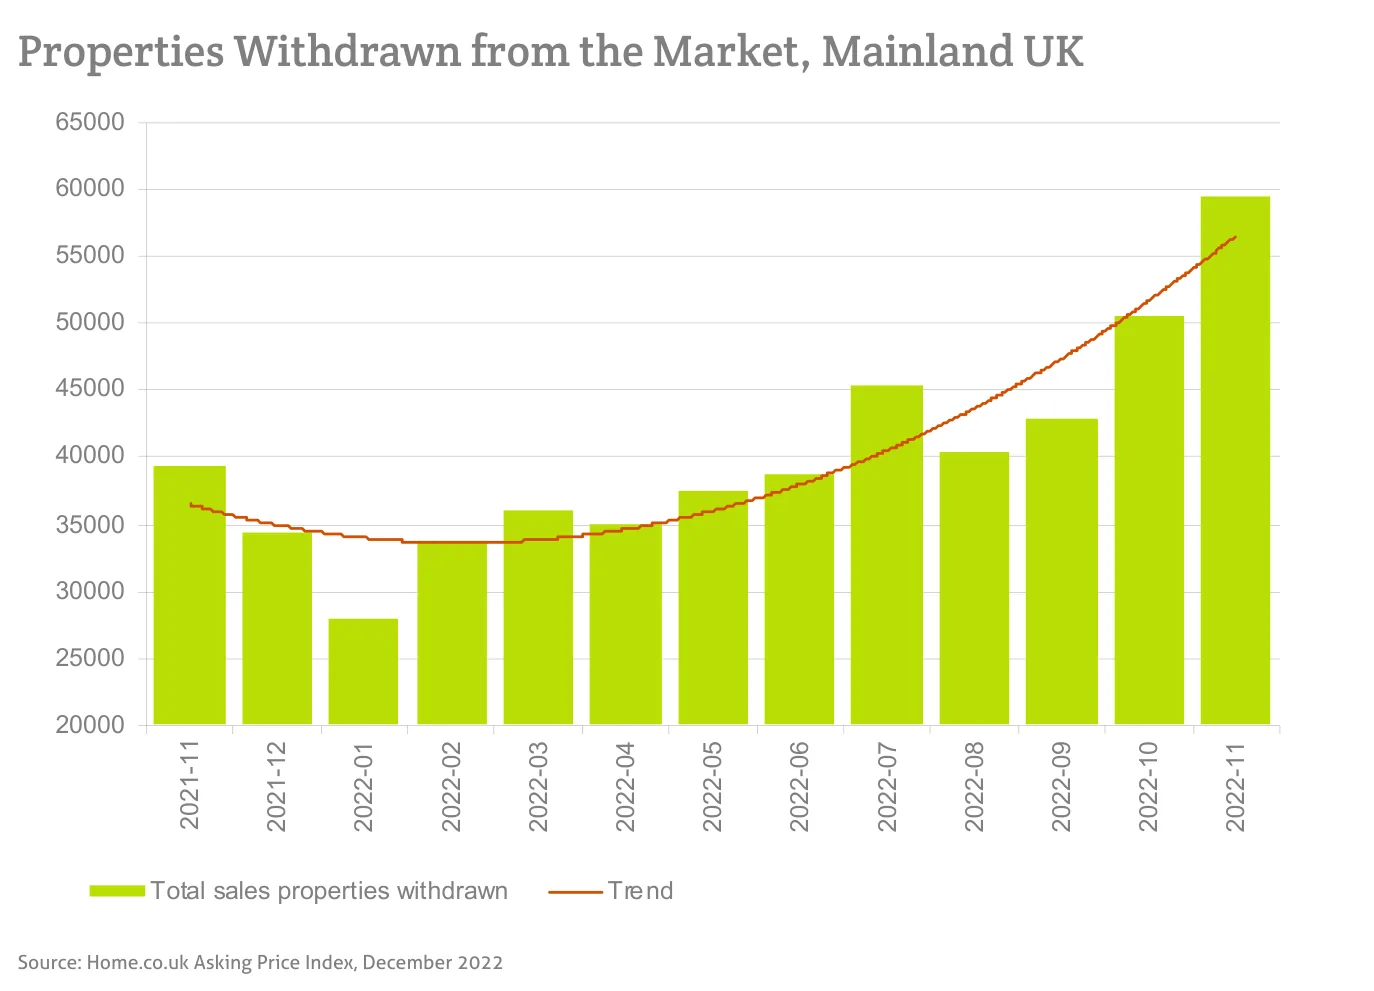
- The number of properties withdrawn from the market soared in November, especially vendors of upmarket properties.
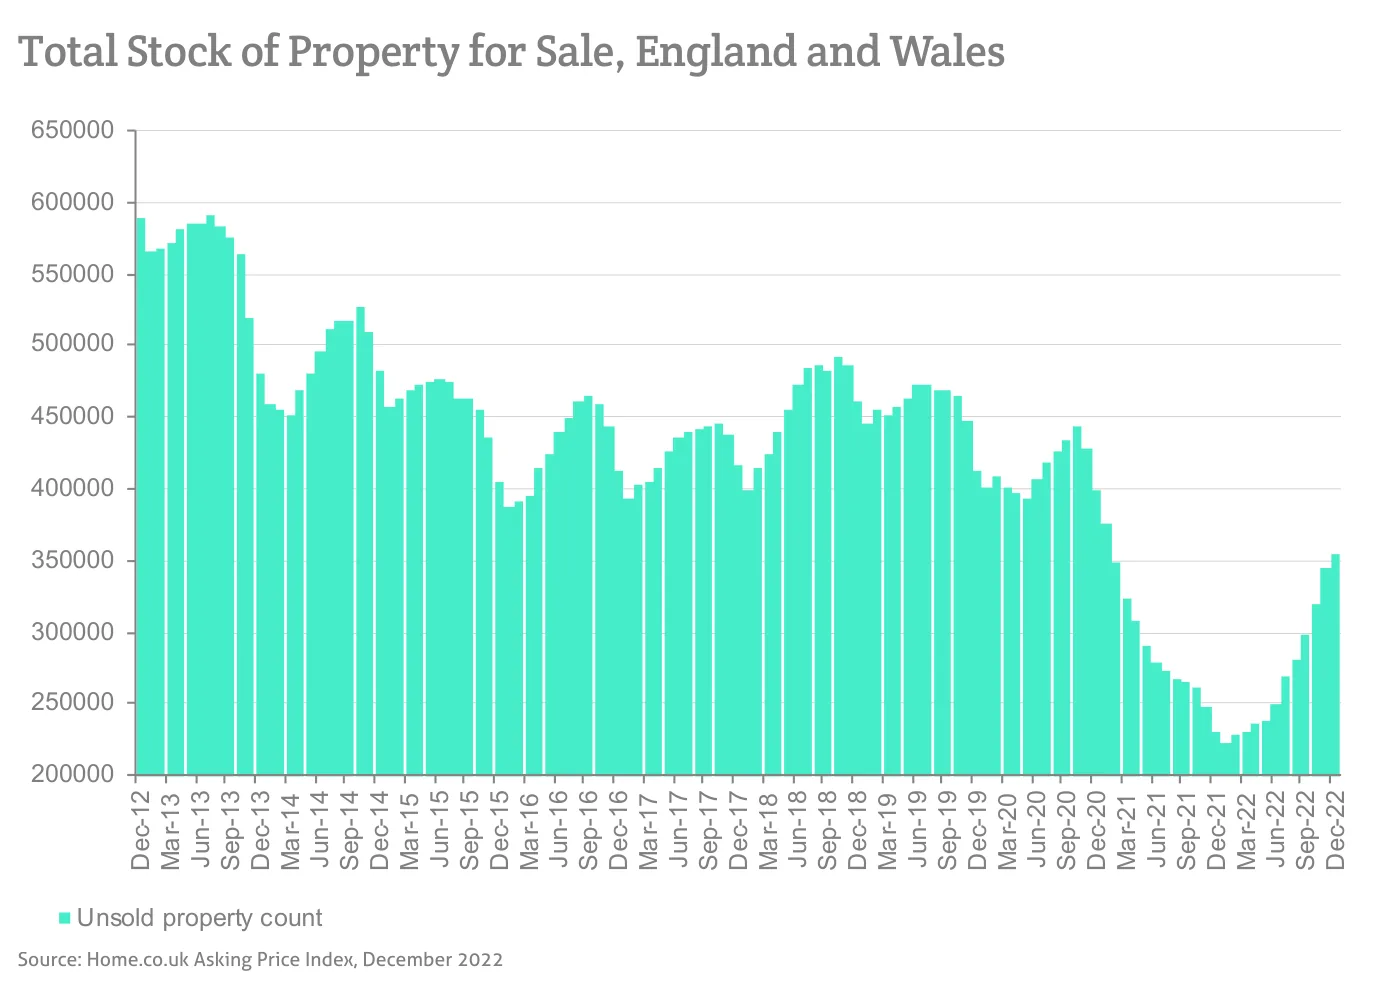
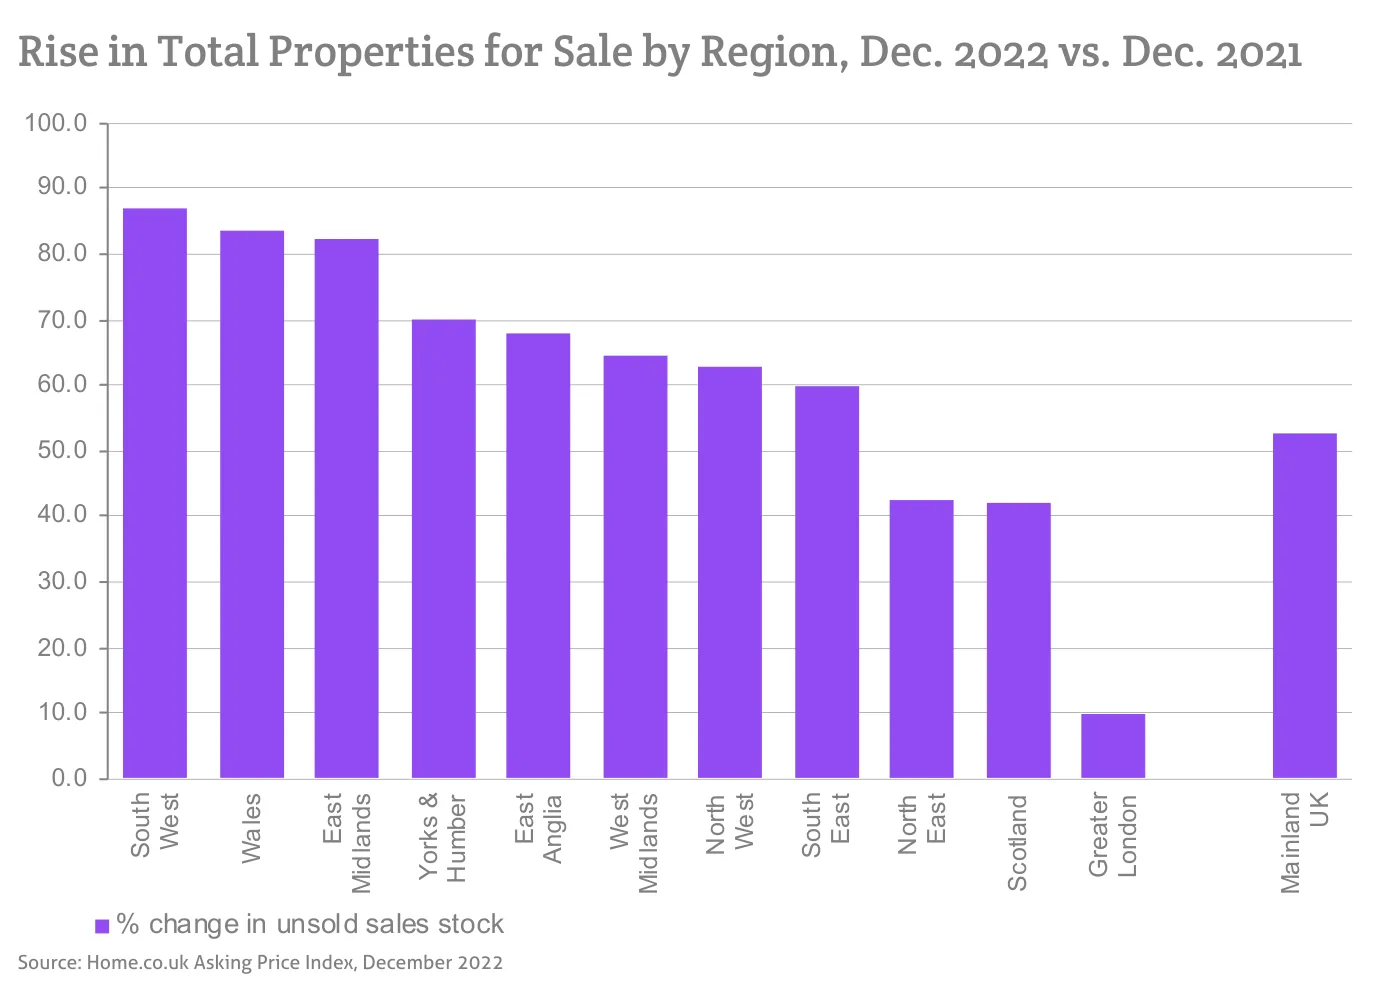
- Consequently, the total sales stock in England and Wales has increased only marginally (by 2.7%) since last month and remains 24% lower than the 10-year average.
- The supply of new instructions remains in the normal range: 9% higher last month compared to November 2021 and yet 12% less than in November 2020.
- The Typical Time on Market (median) for unsold property in England and Wales has risen an additional eight days to 78 days since last month, which is two days less than in December 2021.
- Only five English regions and Wales now show elevated median marketing times compared to December 2021.
- The Scottish property market now leads in annualised regional price growth (4.8%), just ahead of the North West and Wales (both at 4.7%).
- Monetary inflation pushes even higher to 16.4% (RPI ex. housing), making current real growth around -15% year-on-year or less. Additionally, despite rapidly rising mortgage costs, the real mortgage interest rate remains highly negative (around -10%).
- London asking rents are still rising at an extraordinary pace. Overwhelming demand and dwindling supply are driving annualised rental growth to a breathtaking rate of 23%.
- The current new growth leaders in asking rents are the boroughs of Lambeth, Hounslow and Newham (+42%, +39% and +35% annualised respectively).
Summary
Turmoil persists as the UK property market adapts to rising interest rates. Supply and demand are both being reshaped in the face of costlier mortgages. Frothy prices, a result of the COVID boom, are being trimmed and many more vendors are withdrawing their properties from the market, especially the more costly ones, our research shows. New instructions are also being priced more conservatively and this, combined with the surge in withdrawals and price cutting, has hit hard. The national average asking price has dropped 2.4% in a single month by our measure, which is a greater fall than in any month following the 2008 financial crisis.
Despite much talk of a slowdown, both the median and mean time on market for unsold property in England and Wales are actually less than they were a year ago. There is some slowing, of course, but most of it can be ascribed to seasonal factors. After a period of wait and see, we expect demand to ramp back up once the dust has settled, bearing in mind the recently announced nil-rate stamp duty for properties under £250K.
The supply of new instructions remains within the normal range, thus indicating that there is not a panic-driven flood of sellers. The stock total of unsold property has been recovering over recent months from the all-time low set in February but remains a long way off the 10-year average. Moreover, increasing numbers of vendor withdrawals have meant a more muted rise since last month. The fact that many sellers can simply choose not to sell at the present time suggests that there is considerable financial resilience among owners.
Key figures
| Measure | Figure |
|---|---|
| Monthly change in asking prices | -2.4% |
| Annual change in asking prices | 1.5% |
| Total sales stock change since last month | +2.7% |
| Total sales stock vs 10-year average | -24% |
| New instructions vs November 2021 | +9% |
| New instructions vs November 2020 | -12% |
| Typical Time on Market (median) | 78 days |
| London asking rents annual growth | 23% |
Figures are for England and Wales unless the report states otherwise, as published in the edition.
Charts from the report
Source: Home.co.uk Asking Price Index, December 2022, Indexed to May 2004 (Value=100).
Source: Home.co.uk Asking Price Index, December 2022
Source: Home.co.uk Asking Price Index, December 2022
Source: Home.co.uk Asking Price Index, December 2022
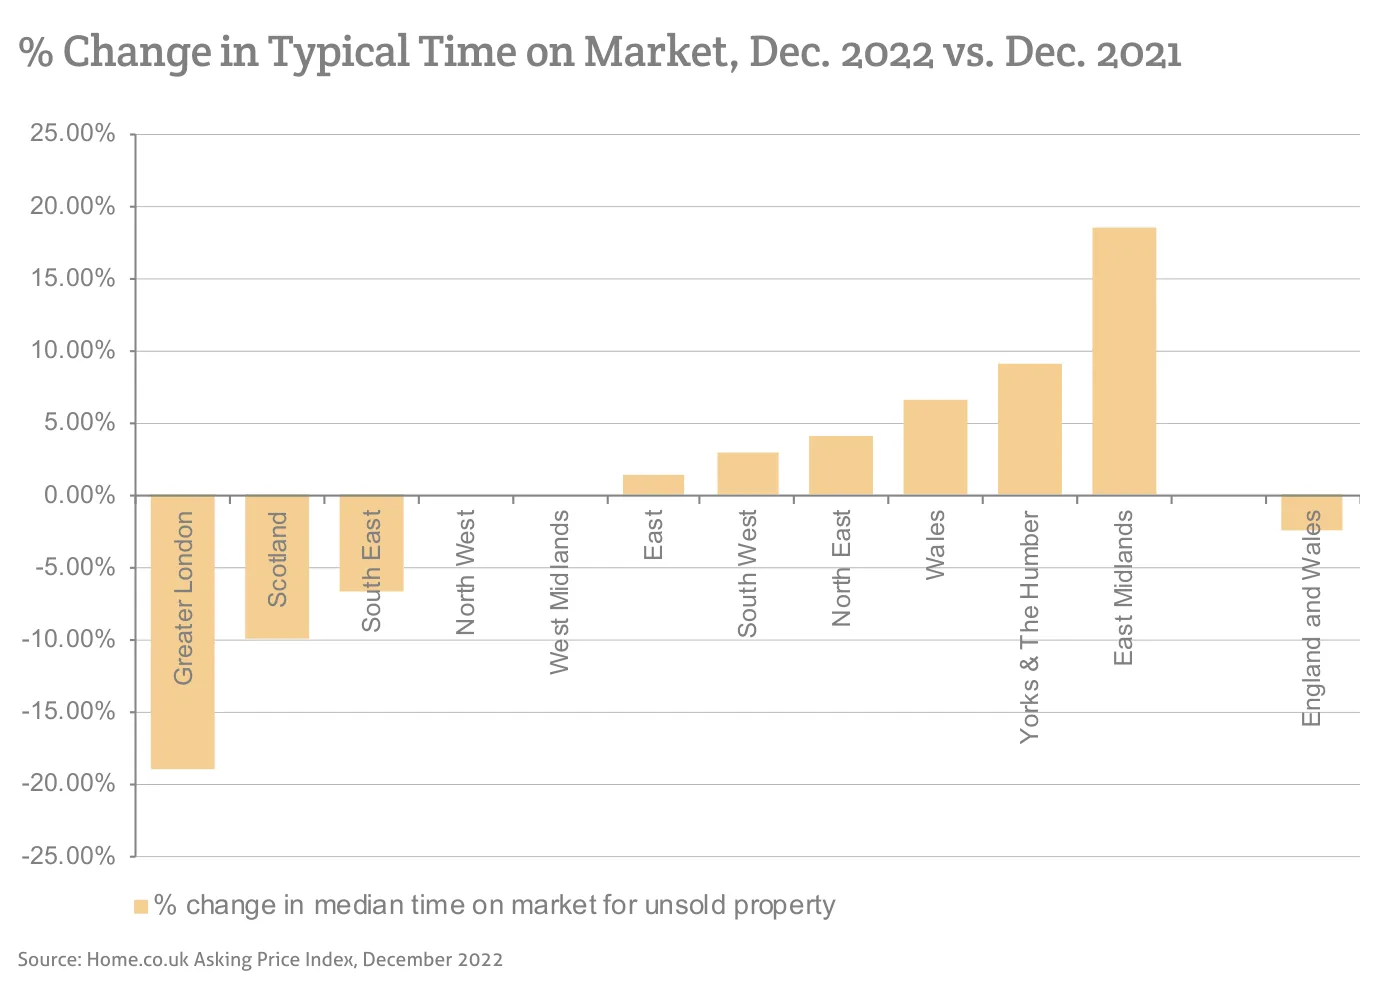
Source: Home.co.uk Asking Price Index, December 2022
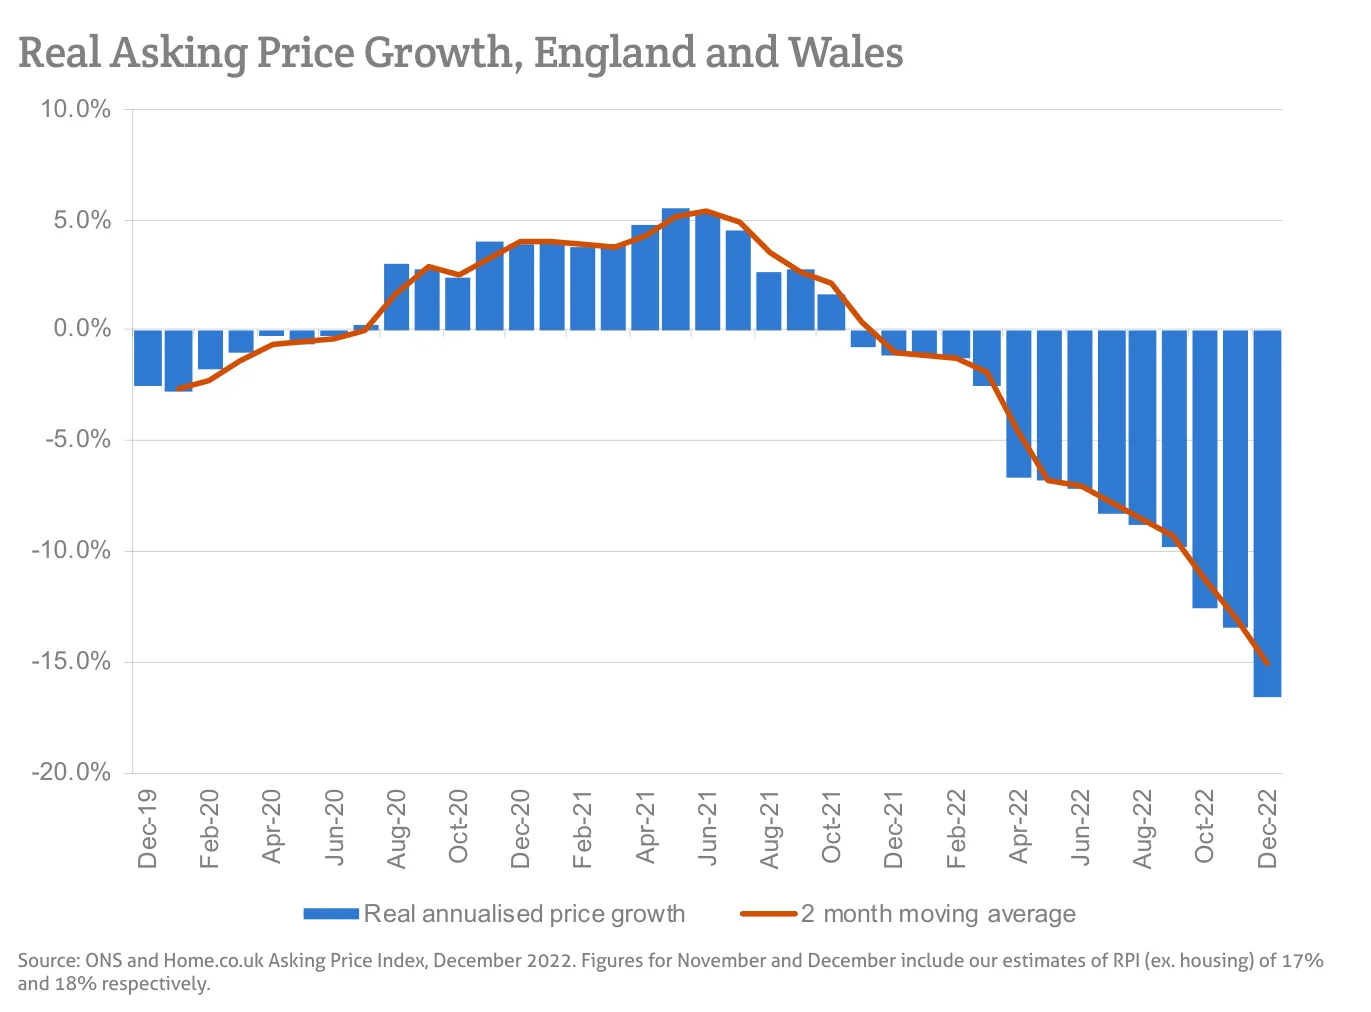
Source: ONS and Home.co.uk Asking Price Index, December 2022. Figures for November and December include our estimates of RPI (ex. housing) of 17%
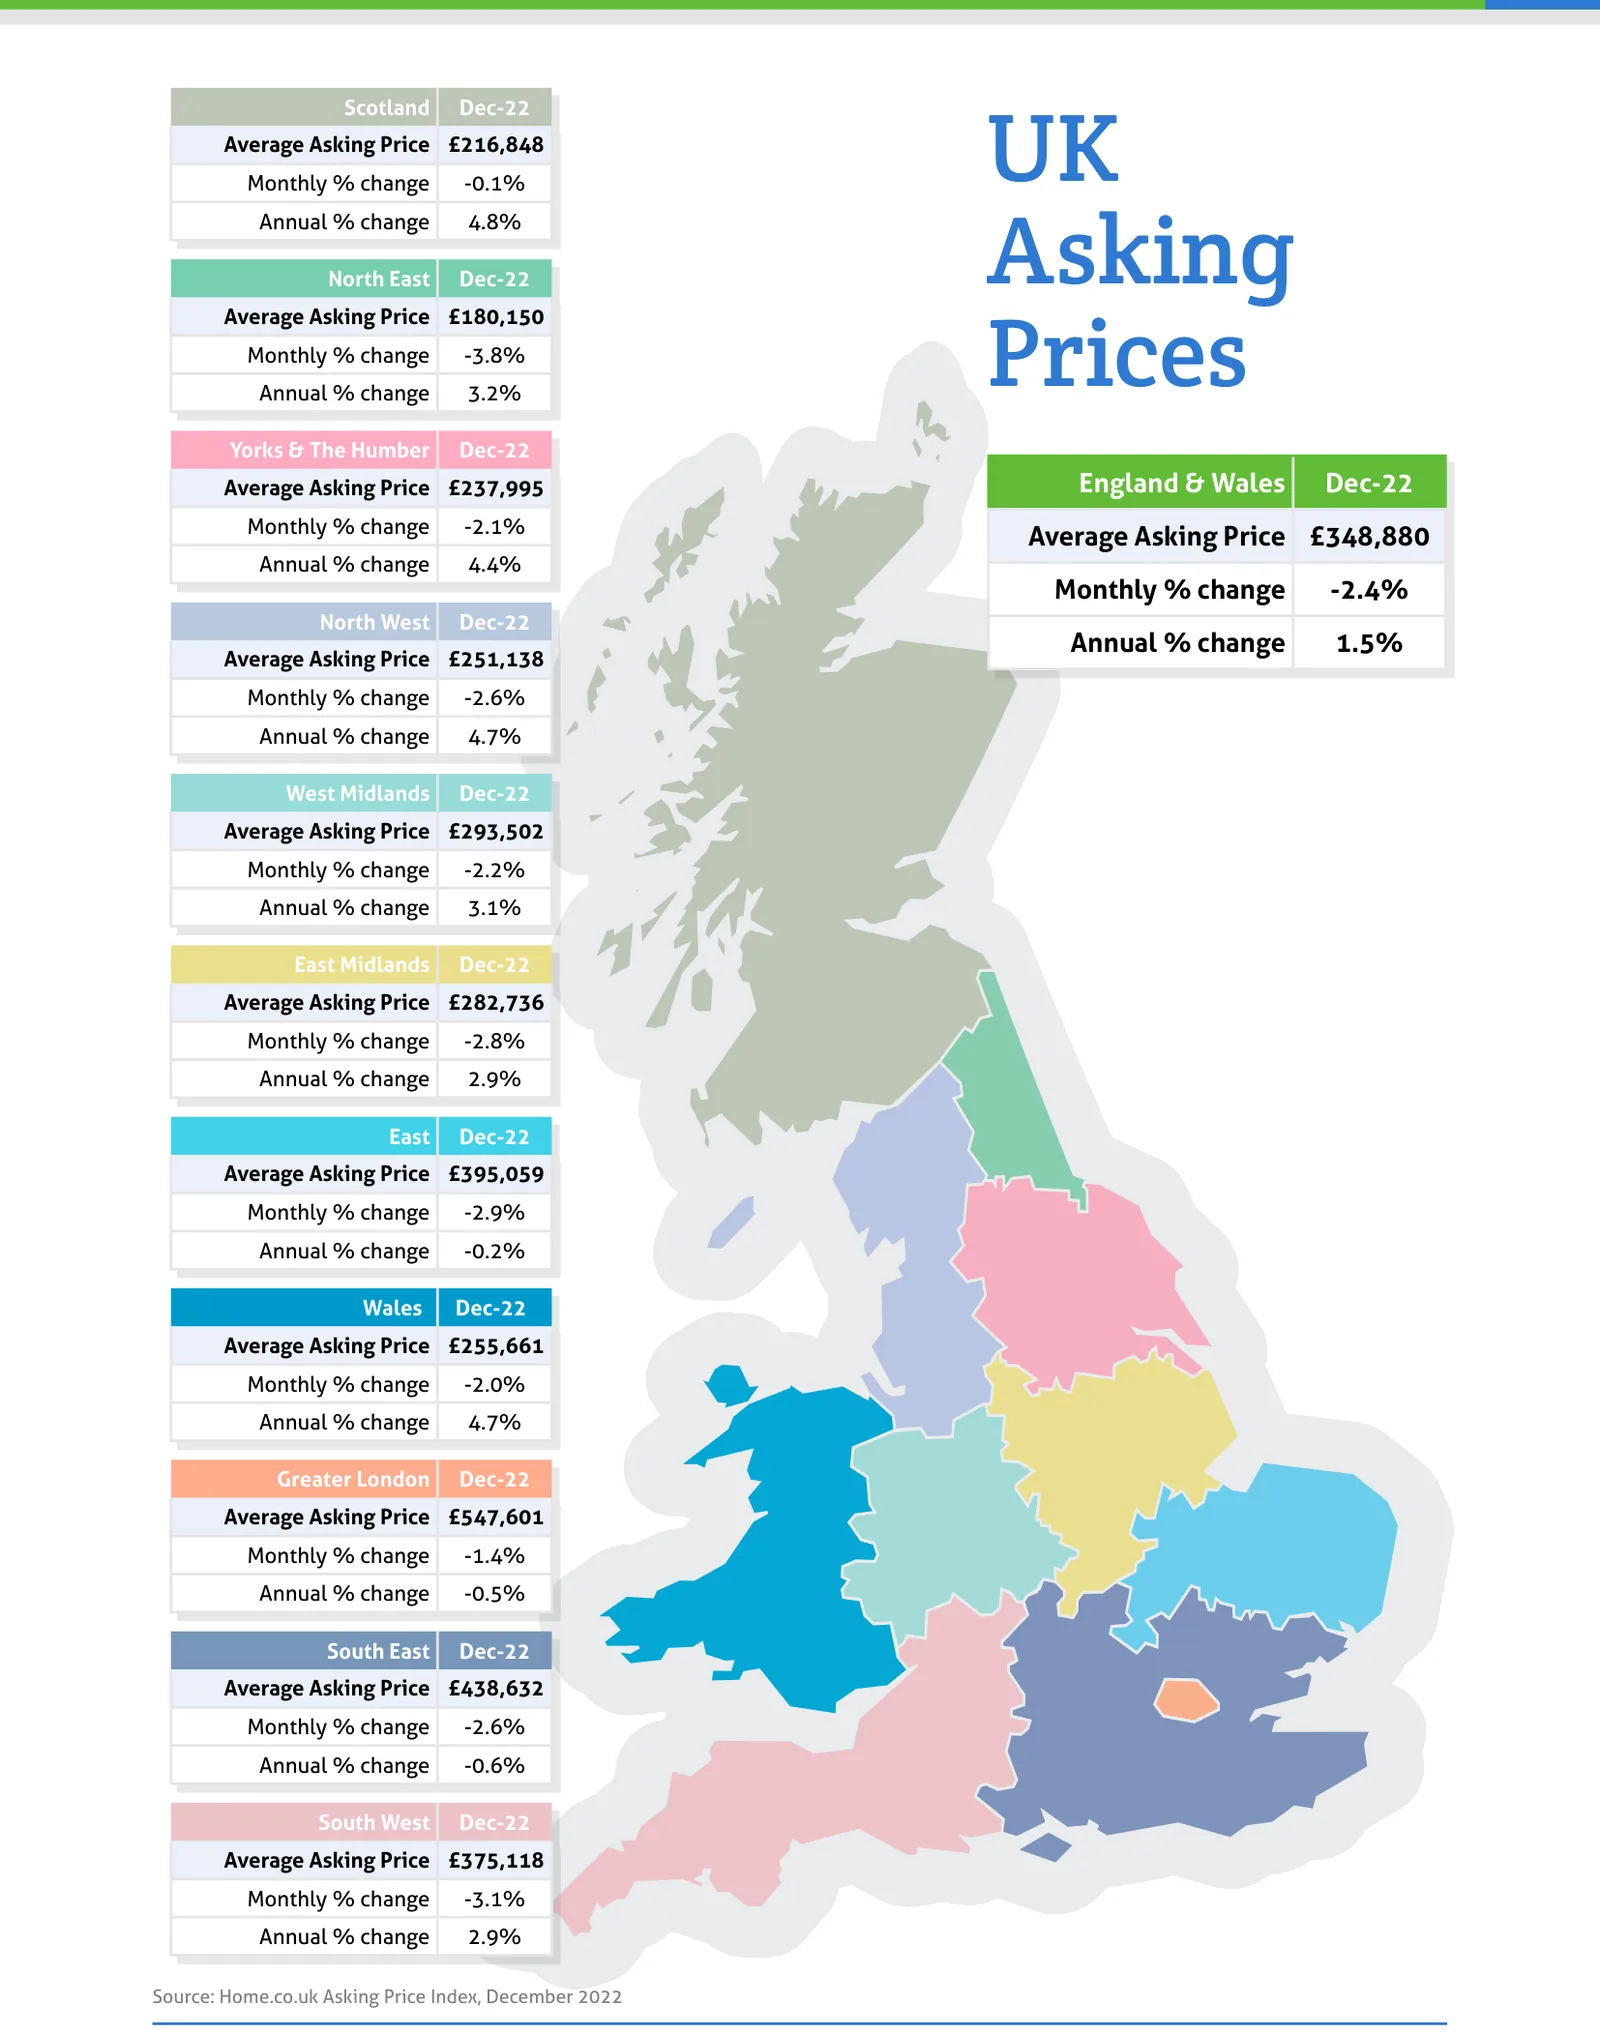
Source: Home.co.uk Asking Price Index, December 2022
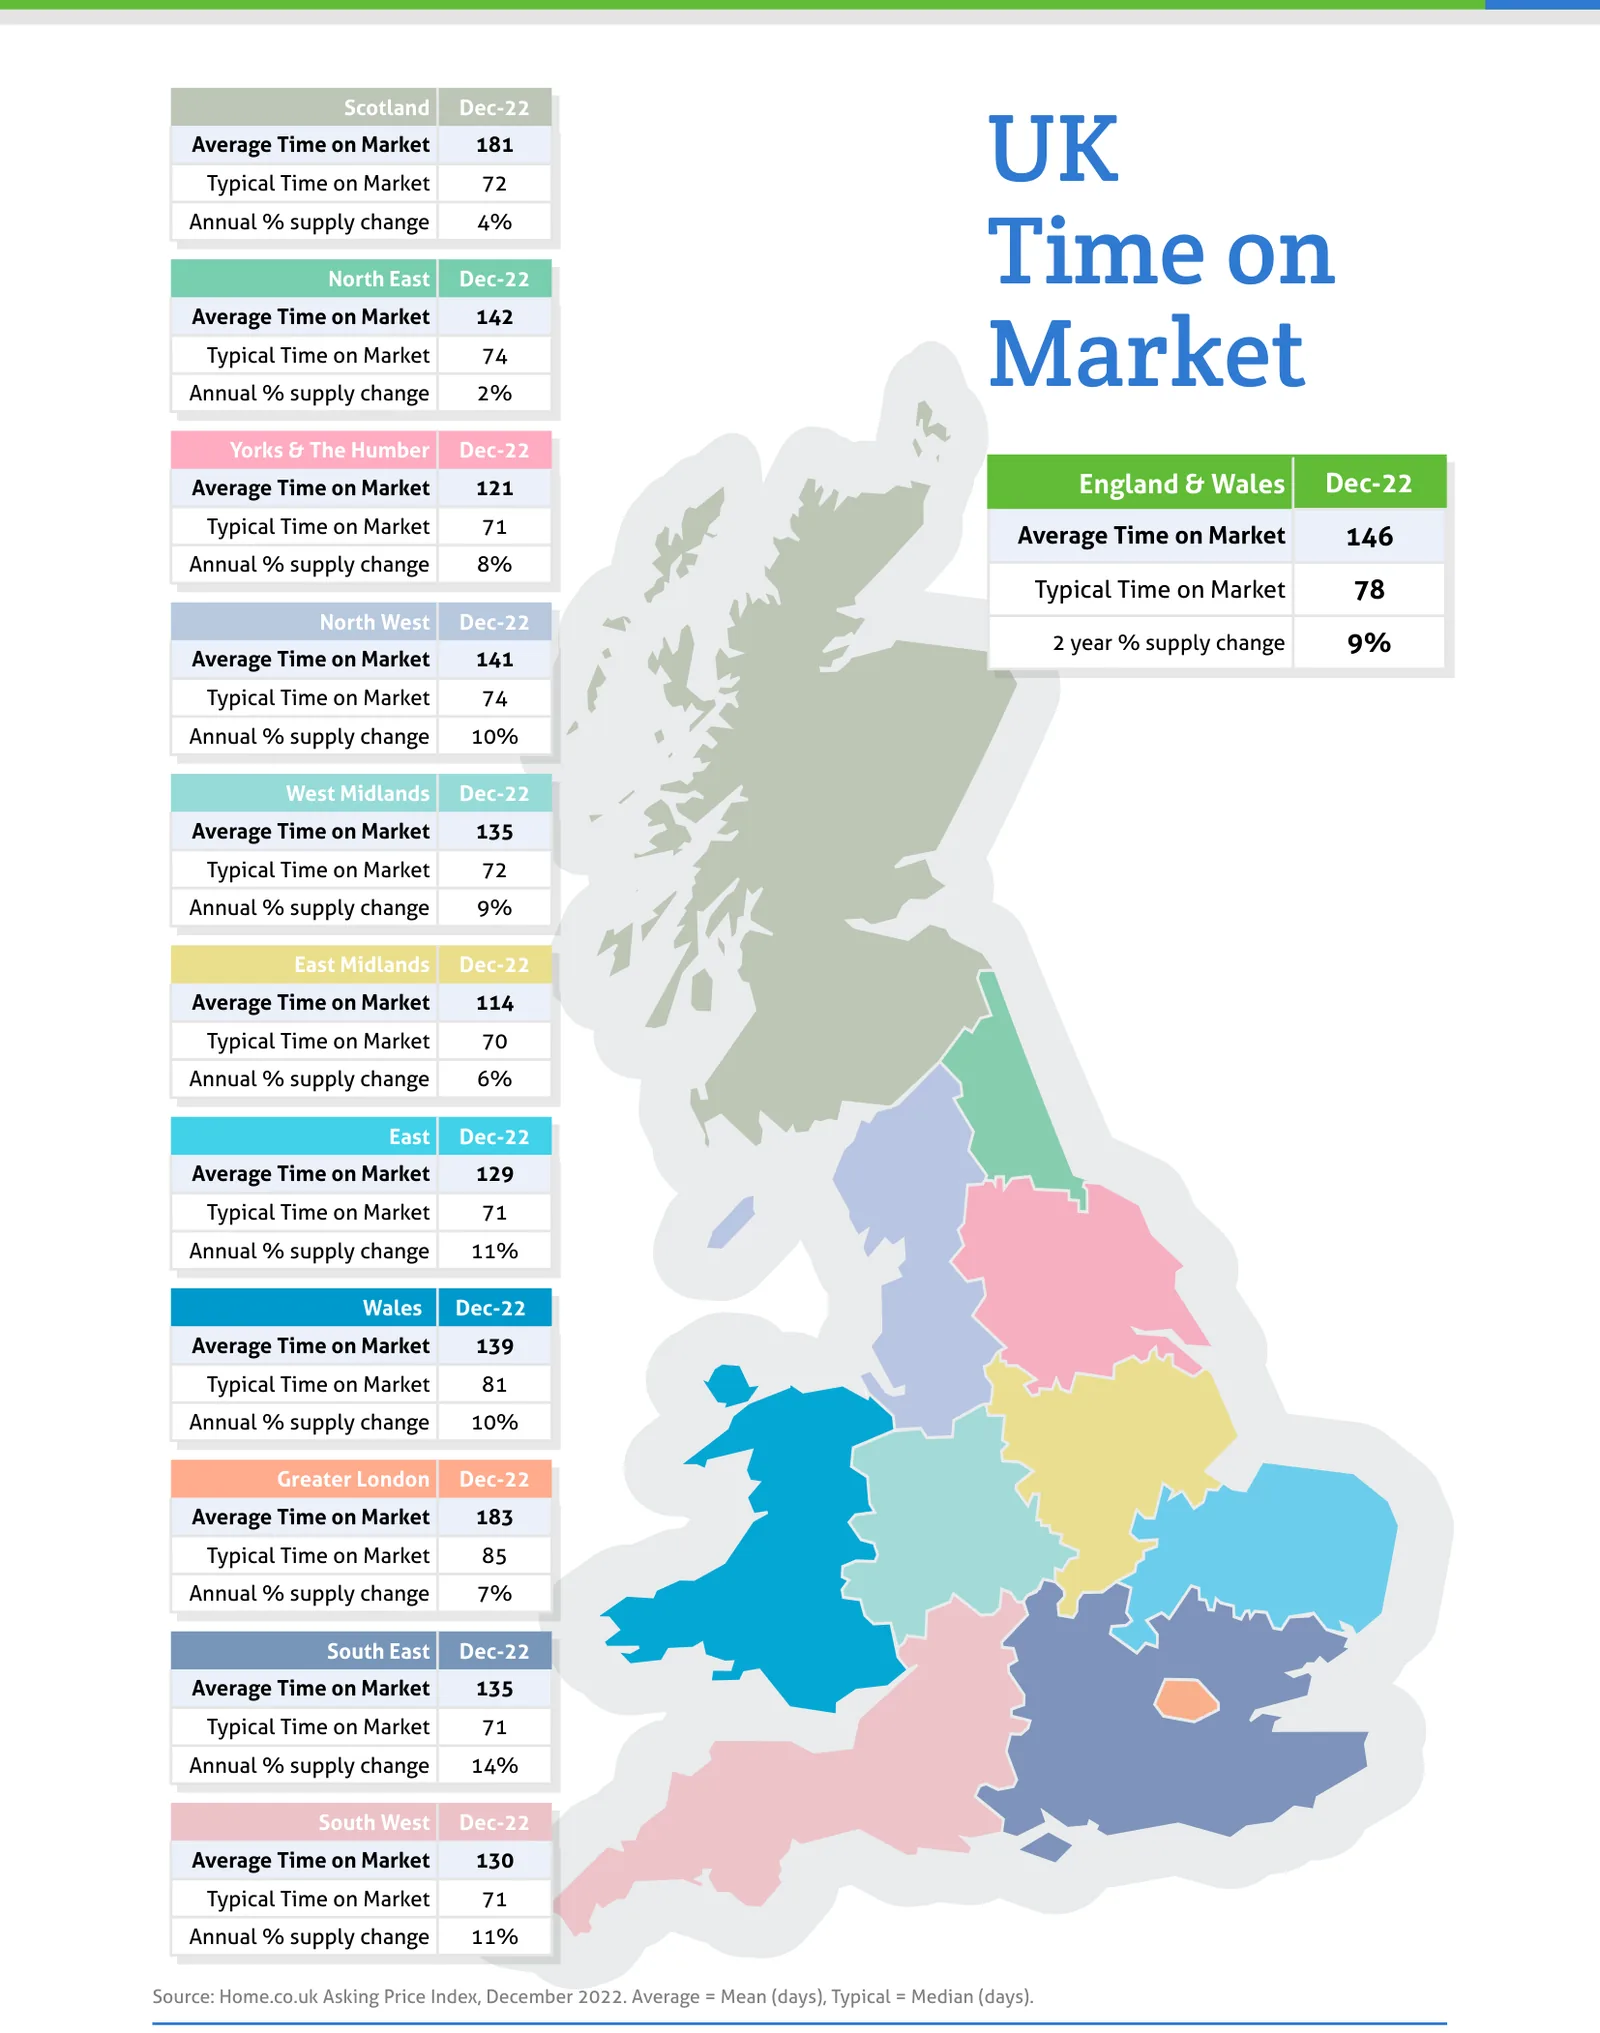
Source: Home.co.uk Asking Price Index, December 2022. Average = Mean (days), Typical = Median (days).
Regional tables
UK Asking Prices, Dec-22
| Region | Average Asking Price | Monthly % change | Annual % change |
|---|---|---|---|
| Scotland | £216,848 | -0.1% | 4.8% |
| North East | £180,150 | -3.8% | 3.2% |
| Yorks & The Humber | £237,995 | -2.1% | 4.4% |
| England & Wales | £348,880 | -2.4% | 1.5% |
| North West | £251,138 | -2.6% | 4.7% |
| West Midlands | £293,502 | -2.2% | 3.1% |
| East Midlands | £282,736 | -2.8% | 2.9% |
| East | £395,059 | -2.9% | -0.2% |
| Wales | £255,661 | -2.0% | 4.7% |
| Greater London | £547,601 | -1.4% | -0.5% |
| South East | £438,632 | -2.6% | -0.6% |
| South West | £375,118 | -3.1% | 2.9% |
UK Time on Market, Dec-22
| Region | Average Time on Market | Typical Time on Market | Annual % supply change |
|---|---|---|---|
| Scotland | 181 | 72 | 4% |
| North East | 142 | 74 | 2% |
| Yorks & The Humber | 121 | 71 | 8% |
| England & Wales | 146 | 78 | |
| North West | 141 | 74 | 10% |
| West Midlands | 135 | 72 | 9% |
| East Midlands | 114 | 70 | 6% |
| East | 129 | 71 | 11% |
| Wales | 139 | 81 | 10% |
| Greater London | 183 | 85 | 7% |
| South East | 135 | 71 | 14% |
| South West | 130 | 71 | 11% |
The report also prints '2 year % supply change' in 1 of its 12 region boxes (England & Wales 9%), so it is not a column of this table.
From the director's commentary
"The UK housing market has cooled rapidly, seemingly in line with the frosty weather. On Thursday, the Bank of England is expected to throw another bucket of icy water on the markets in the form of a further 0.5% rise in the base rate."
Doug Shephard, Director at Home.co.uk
Read the full December 2022 edition (PDF, 12 pages)
About the Home Asking Price Index
The Home Asking Price Index measures the change in the prices sellers ask for residential property across England, Wales and Scotland. Today it is computed every month from around half a million advertised homes and is mix-adjusted, so a change in what happens to be on the market does not move the figure; earlier editions state the sample they were built from. Because an asking price is set months before a sale completes, the index runs around five months ahead of completed-sale measures such as the UK House Price Index.
Every edition in the archive, back to October 2006, is listed on the index page. How we measure the UK property market explains the listing data behind it, and today's figures by area are on house prices and rental prices.
Text and figures above are quoted from the December 2022 edition as published, with punctuation normalised for the web, and are not revised. Later editions may restate them.
More in What is happening to house prices: the Home guide
Thinking about your next move?
See what your home's worth in seconds, with the UK's longest-running property data behind it.
Get an instant valuation