

























Home Asking Price Index, December 2020: prices dip but oversupply in London continues
Average asking prices in England and Wales fell 0.6% this month but were up 4.7% year-on-year, while London remained oversupplied and rents fell sharply.

This is the December 2020 edition of the Home Asking Price Index, released on 15 December 2020, under the headline:
Prices Dip but Oversupply in London Continues
The headlines and summary below are the report's own words, with the key figures as it published them, followed by the report's charts and regional tables as printed.
Headlines
- Asking prices have dipped 0.6% across England and Wales since last month, broadly in line with seasonal expectations.
- Record levels of supply continue unabated in Greater London, putting further downward pressure on prices (new listings up 57% in November compared to November 2019), although unsold stock levels have dipped slightly since last month.
- By contrast, supply across the English regions and Wales has reduced considerably, to the extent that significant undersupply is now evident in Wales and the North East.
- Despite this month's seasonal dip, the mix-adjusted average asking price for England and Wales registers a remarkably upbeat 4.7% year-on-year.
- The northern property markets indicate phenomenal strength, with Yorkshire showing the greatest year-on-year price growth of 9.8%, closely followed by the North West with an annualised gain of 8.9%.
- Greater London is currently the UK's worst-performing region with only 2.8% growth overall, but this figure hides significant price falls in more central areas.
- Average prices dipped in all regions of England, Scotland and Wales during the last month.
- The market continues to show exceptional pace with the Typical Time on Market at a mere 84 days for unsold property, 22 days less than in December 2019 (England and Wales), while UK-wide supply is up a mere 9% year-on-year.
- Overall supply in the UK rental sector is 1.4% down year-on-year. However, severe shortages are to be found in most English regions and in Wales, forcing up rents. The largest annualised hikes are in Wales (+16.2%) and the West Midlands (+17.0%).
- Meanwhile, the Greater London area shows acute oversupply in properties available to rent (+54% year-on-year) together with free-falling rents (-16.0%). This dire situation is having a severe knock-on effect for the capital's buy-to-let sales market.
Summary
Given the breathtaking activity and demand-driven price hikes since the spring lockdown, it comes as no surprise that home prices show a correction this month. Broadly in line with seasonal expectations, this timely dip, apparent in all regions, will be reassuring for most property market observers. A sense of caution on the part of vendors in setting the asking price is an indication that the market has not overheated, and thereby reduces the chance of larger corrections in 2021. As in any market, seasonal dips and corrections are vital in rebalancing supply and demand.
The fallout from the COVID pandemic has reshaped the nature of supply and demand. Analysis at the regional level can now provide insight as to how the market is shaping up as it adapts to new COVID-era trends. The supply and demand shocks that followed the spring lockdown have faded away and we now observe that most English regional markets (outside of London), Scotland and Wales have, for the time being, entered a more balanced state. However, until the 31st March, there remains the artificial distortive effect of the Stamp Duty holiday and all these markets have yet to deal with the consequences of the economic fallout of business failures and layoffs.
Key figures
| Measure | Figure |
|---|---|
| Monthly change in asking prices | -0.6% |
| Annual change in asking prices | +4.7% |
| Typical Time on Market | 84 days |
| UK-wide supply change year-on-year | +9% |
| UK rental sector supply change year-on-year | -1.4% |
Figures are for England and Wales unless the report states otherwise, as published in the edition.
Charts from the report
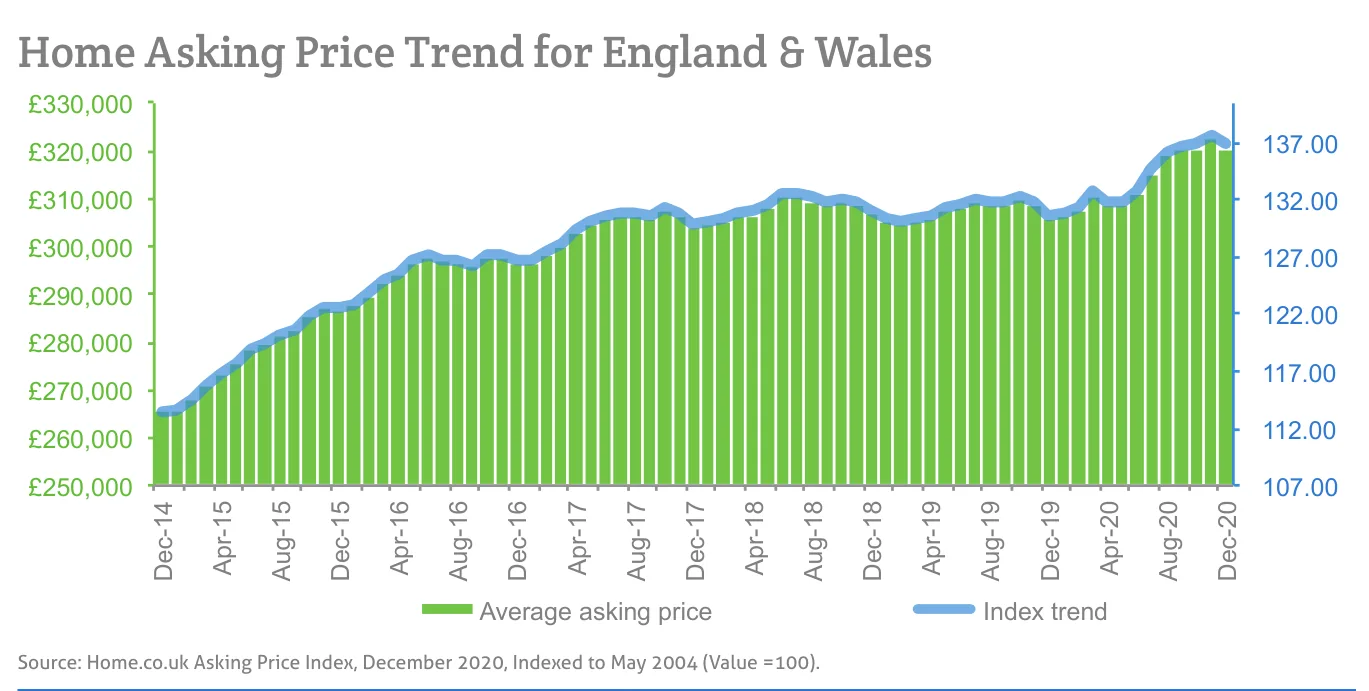
Source: Home.co.uk Asking Price Index, December 2020, Indexed to May 2004 (Value =100).
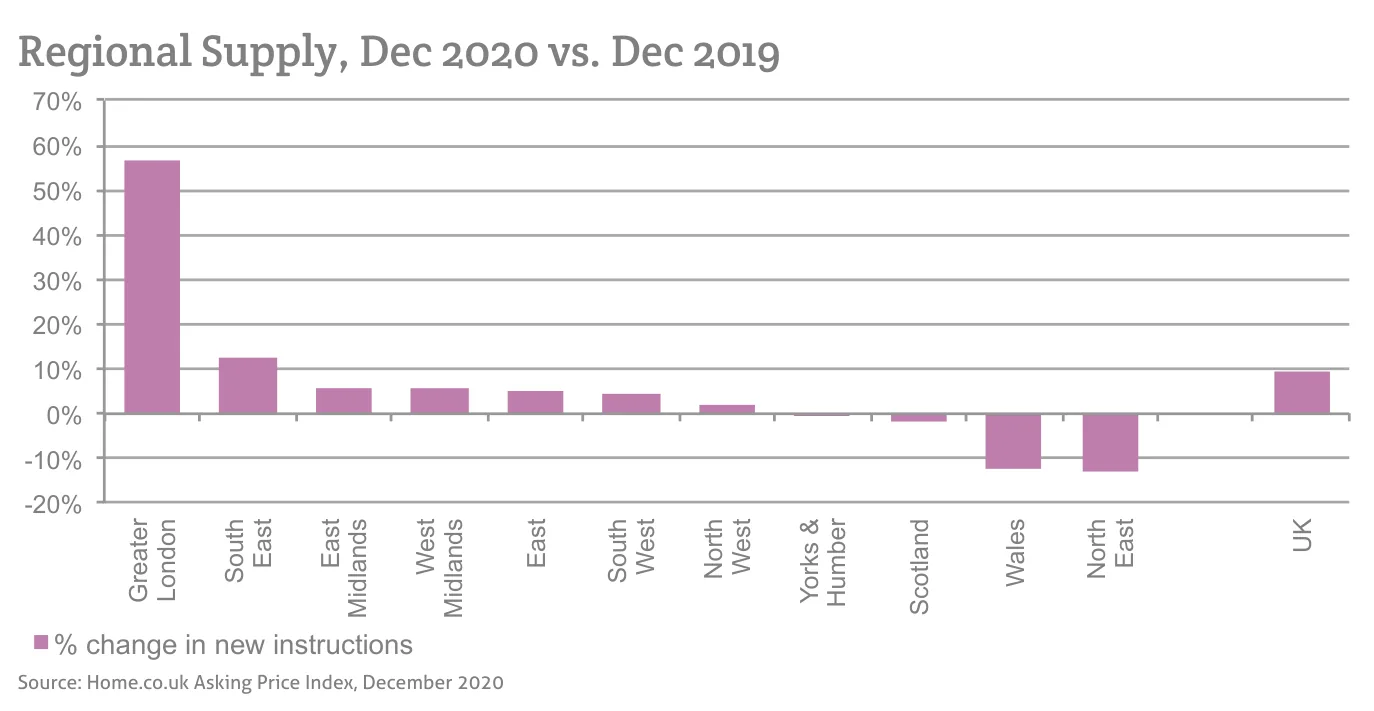
Source: Home.co.uk Asking Price Index, December 2020
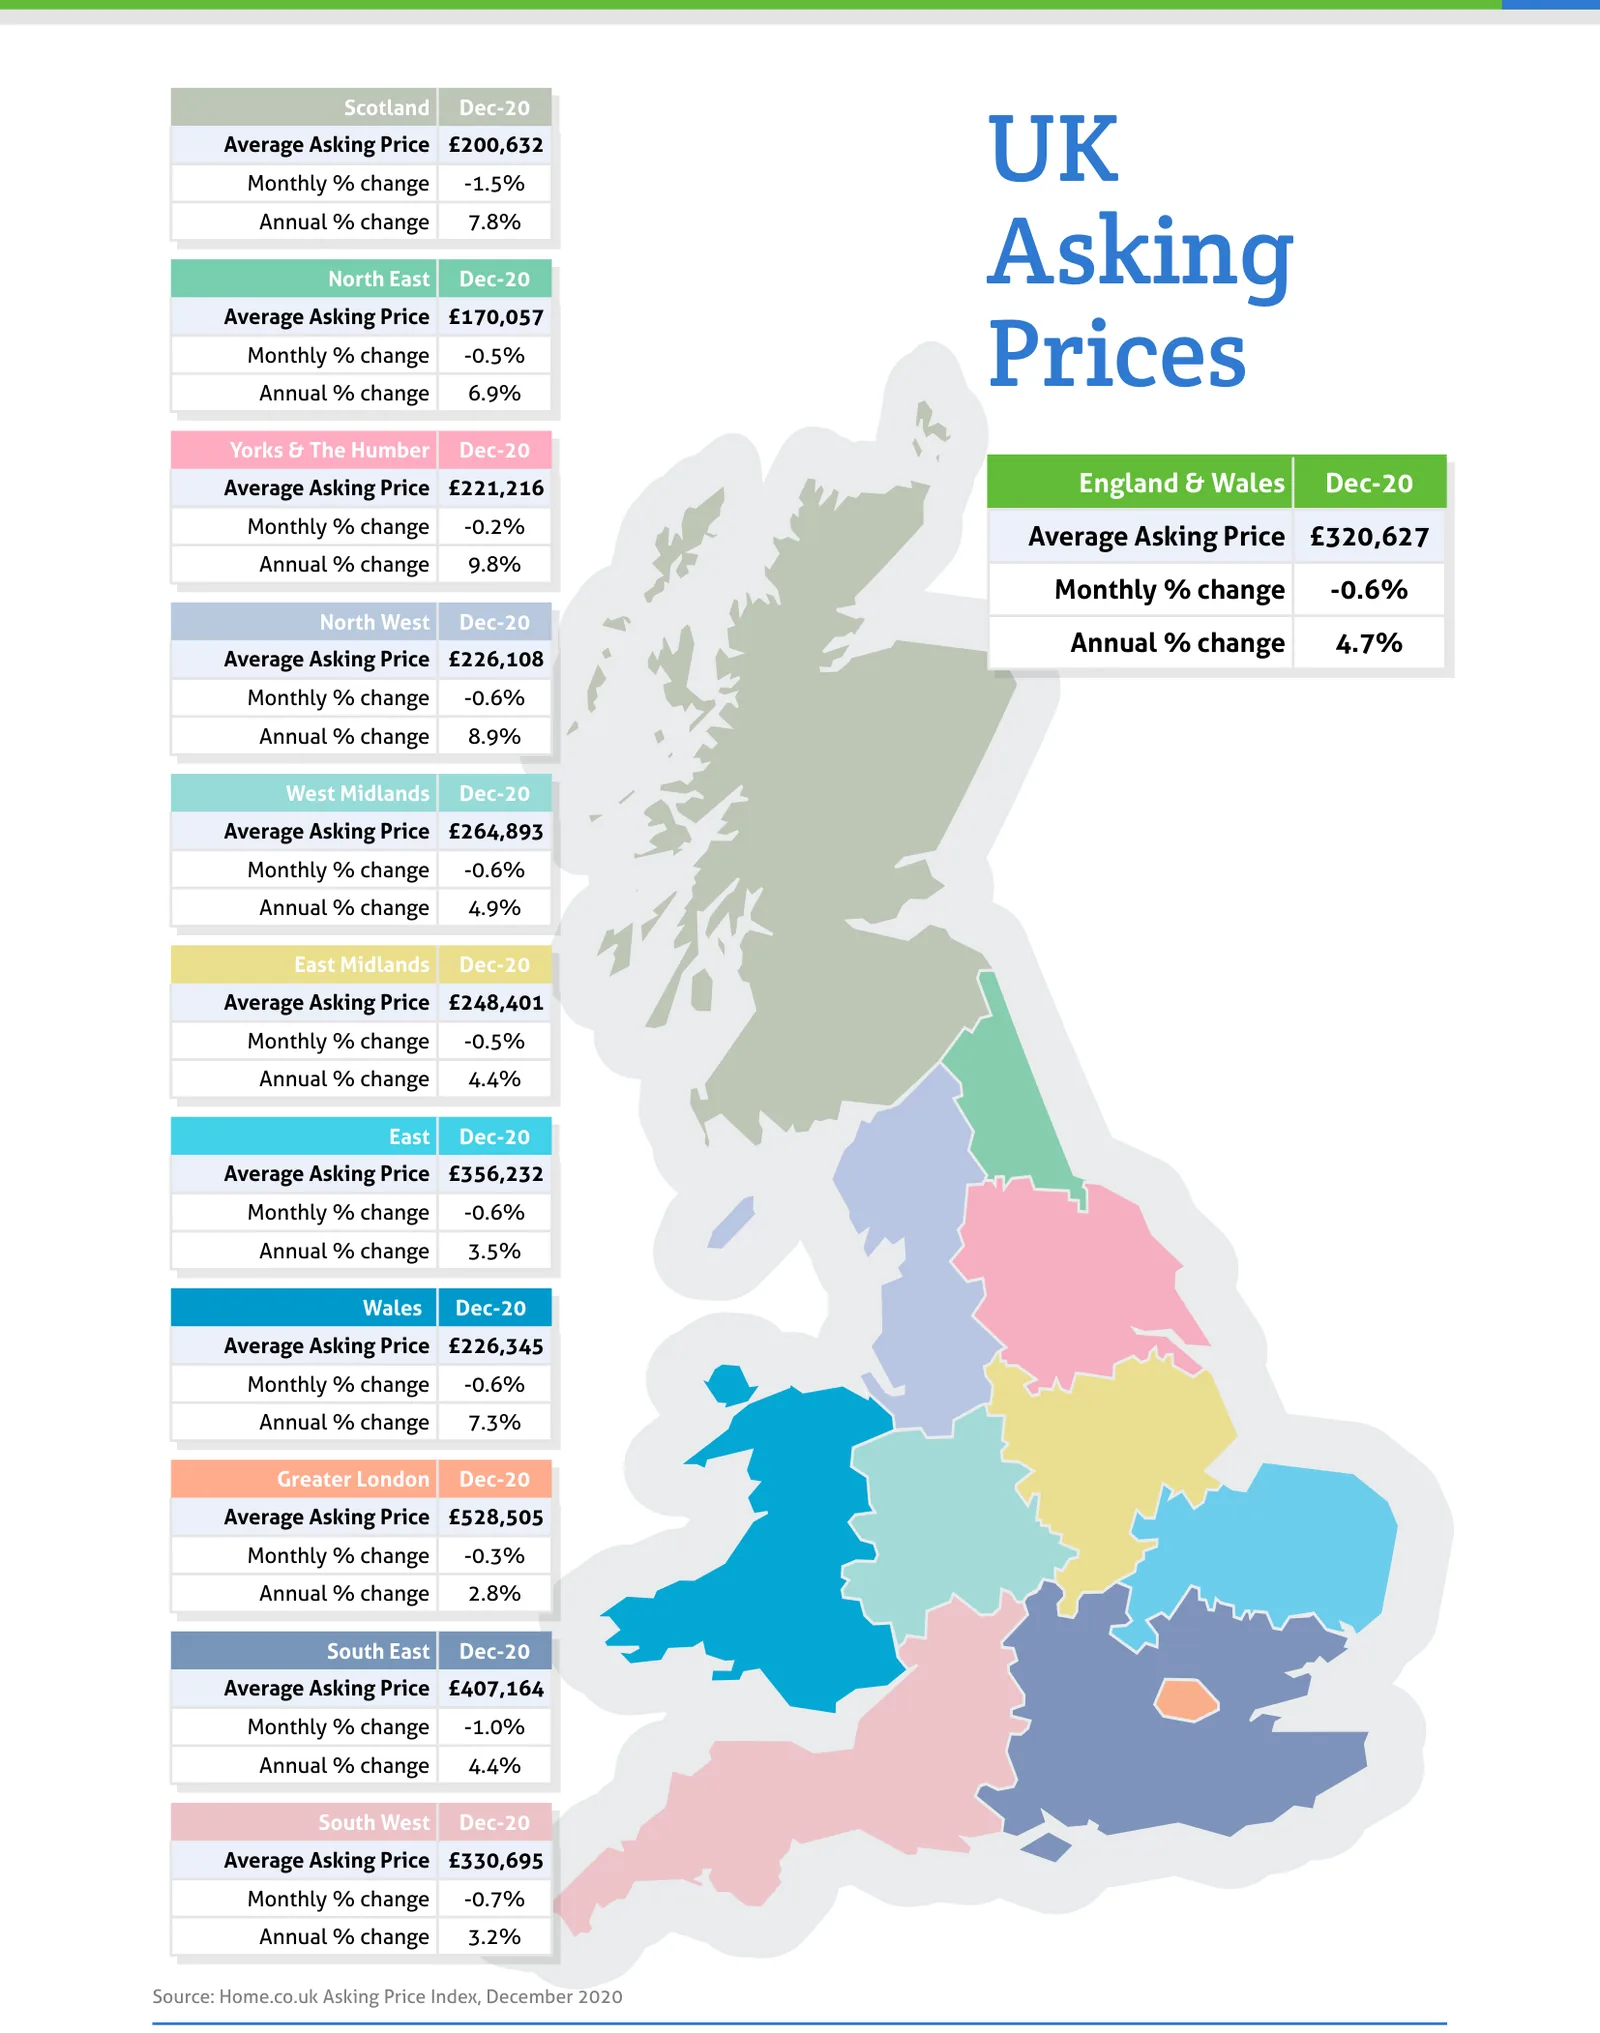
Source: Home.co.uk Asking Price Index, December 2020
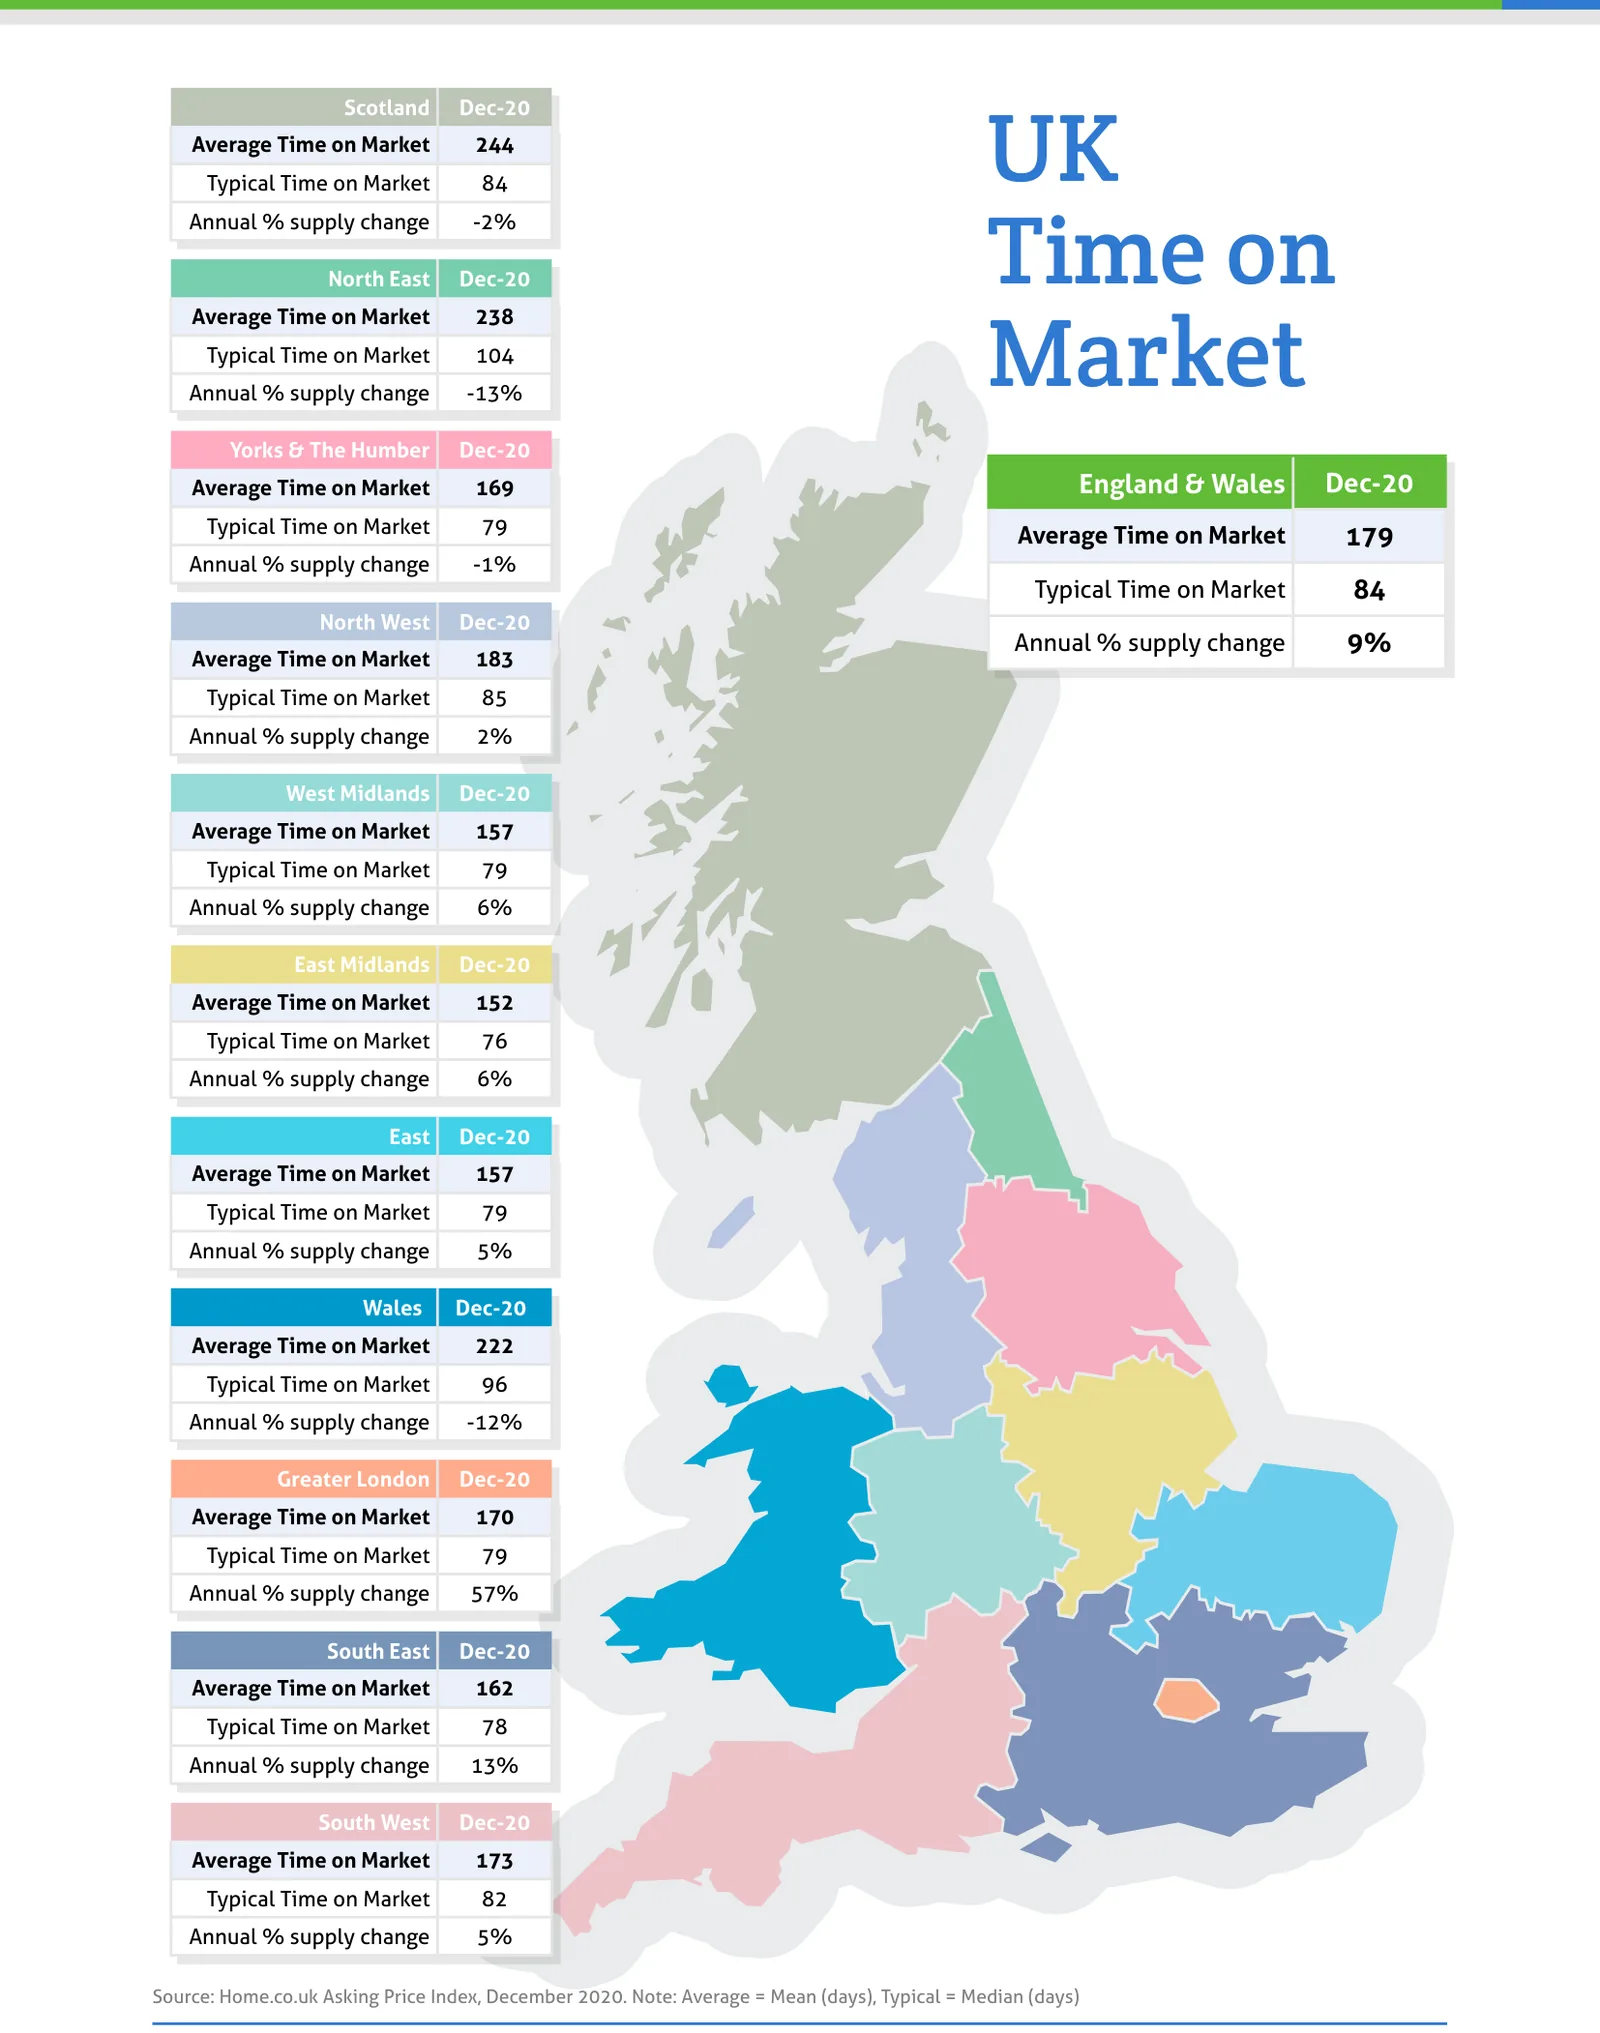
Source: Home.co.uk Asking Price Index, December 2020. Note: Average = Mean (days), Typical = Median (days)
Regional tables
UK Asking Prices, Dec-20
| Region | Average Asking Price | Monthly % change | Annual % change |
|---|---|---|---|
| Scotland | £200,632 | -1.5% | 7.8% |
| North East | £170,057 | -0.5% | 6.9% |
| Yorks & The Humber | £221,216 | -0.2% | 9.8% |
| England & Wales | £320,627 | -0.6% | 4.7% |
| North West | £226,108 | -0.6% | 8.9% |
| West Midlands | £264,893 | -0.6% | 4.9% |
| East Midlands | £248,401 | -0.5% | 4.4% |
| East | £356,232 | -0.6% | 3.5% |
| Wales | £226,345 | -0.6% | 7.3% |
| Greater London | £528,505 | -0.3% | 2.8% |
| South East | £407,164 | -1.0% | 4.4% |
| South West | £330,695 | -0.7% | 3.2% |
UK Time on Market, Dec-20
| Region | Average Time on Market | Typical Time on Market | Annual % supply change |
|---|---|---|---|
| Scotland | 244 | 84 | -2% |
| North East | 238 | 104 | -13% |
| Yorks & The Humber | 169 | 79 | -1% |
| England & Wales | 179 | 84 | 9% |
| North West | 183 | 85 | 2% |
| West Midlands | 157 | 79 | 6% |
| East Midlands | 152 | 76 | 6% |
| East | 157 | 79 | 5% |
| Wales | 222 | 96 | -12% |
| Greater London | 170 | 79 | 57% |
| South East | 162 | 78 | 13% |
| South West | 173 | 82 | 5% |
From the director's commentary
"As we head into 2021, we expect this trend to continue. For many, the move to lower-density housing is a very positive one, for health, wealth and family life."
Doug Shephard, Director at Home.co.uk
Read the full December 2020 edition (PDF, 7 pages)
About the Home Asking Price Index
The Home Asking Price Index measures the change in the prices sellers ask for residential property across England, Wales and Scotland. Today it is computed every month from around half a million advertised homes and is mix-adjusted, so a change in what happens to be on the market does not move the figure; earlier editions state the sample they were built from. Because an asking price is set months before a sale completes, the index runs around five months ahead of completed-sale measures such as the UK House Price Index.
Every edition in the archive, back to October 2006, is listed on the index page. How we measure the UK property market explains the listing data behind it, and today's figures by area are on house prices and rental prices.
Text and figures above are quoted from the December 2020 edition as published, with punctuation normalised for the web, and are not revised. Later editions may restate them.
More in What is happening to house prices: the Home guide
Thinking about your next move?
See what your home's worth in seconds, with the UK's longest-running property data behind it.
Get an instant valuation