

























Home Asking Price Index, December 2019: election anxiety hobbles the market
UK new sales instructions fell 16% year-on-year while England and Wales asking prices dropped just 0.3% annually amid election-related uncertainty.

This is the December 2019 edition of the Home Asking Price Index, released on 12 December 2019, under the headline:
Election Anxiety Hobbles the Market
The headlines and summary below are the report's own words, with the key figures as it published them, followed by the report's charts and regional tables as printed.
Headlines
- The supply of new sales instructions has plummeted 16% year-on-year across the UK as potential vendors steer clear of a market plagued with election uncertainty.
- London is worst hit by the drought: new instructions have crashed (-26% year-on-year, Nov 19 vs. Nov 18) and stock on the market is down by 25% year-on-year (Dec 19 vs. Dec 18).
- The current sales supply shortage has served to support prices, although a larger than usual seasonal dip in the mix-adjusted average of -0.8% since last month suggests vendor confidence is lower than at this time last year.
- Demand continues to outstrip supply in the rental sector as the supply of newly available rental property falls across the UK (down 13% year-on-year).
- The London lettings market is worst hit by this alarming trend towards scarcity (down 22% year-on-year) and rents are rocketing in many boroughs.
- Overall, the average mix-adjusted asking price slipped just 0.3% during the last year across England and Wales.
- The total sales stock continues to diminish across England and Wales; down by 10.4% year-on-year.
- Typical Time on Market for England and Wales is eleven days longer than in December 2018 (the longest such December figure since 2014), a clear indication of the reluctance of buyers to commit amidst the current uncertain political climate.
- At the regional level, typical Time on Market rises indicate the worst post-boom regional slowdowns continue to be in the East of England (+16%), Greater London (+16%) and the South West (+16% year-on-year).
- East of England remains the UK's worst-performing region with prices continuing an extended correction and causing the average asking price to drop by 2.8% over the last twelve months.
Summary
In spite of unprecedented political turmoil, home prices are holding remarkably steady overall, as the supply shortage serves to further support values despite buyer hesitancy. The annualised mix-adjusted average is down a mere 0.3% for England and Wales (despite a seasonal drop of 0.8% since November and the impact of the ongoing price correction in the East of England). Of course, low interest rates are to thank for the current relative stability in home prices, as very few vendors are forced to sell. What's more, with talk of a possible rate cut by the Bank of England early next year, given any potential election outcome, vendors (and buyers) are content to play wait and see.
Annualised price growth across England and Wales currently stands at -0.3%; in December 2018, the annualised rate of increase of home prices was 0.8%.
Key figures
| Measure | Figure |
|---|---|
| Average asking price (England & Wales) | £306,076 |
| Monthly change (England & Wales) | -0.8% |
| Annual change (England & Wales) | -0.3% |
| Total sales stock change (England & Wales) | -10.4% |
| New instructions change (UK) | -16% |
| Rental supply change (UK) | -13% |
| Average asking rent change (UK) | +7.6% |
| Typical Time on Market change (England & Wales) | eleven days longer than in December 2018 |
Figures are for England and Wales unless the report states otherwise, as published in the edition.
Charts from the report
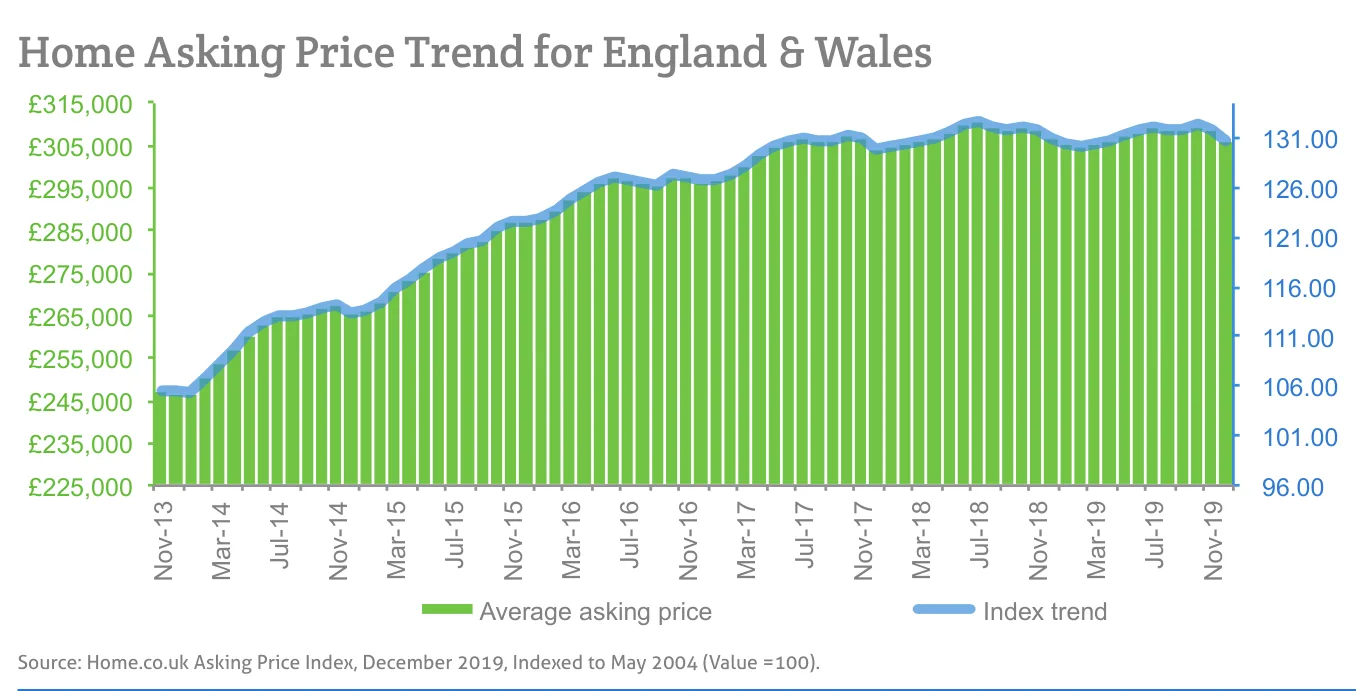
Source: Home.co.uk Asking Price Index, December 2019, Indexed to May 2004 (Value =100).
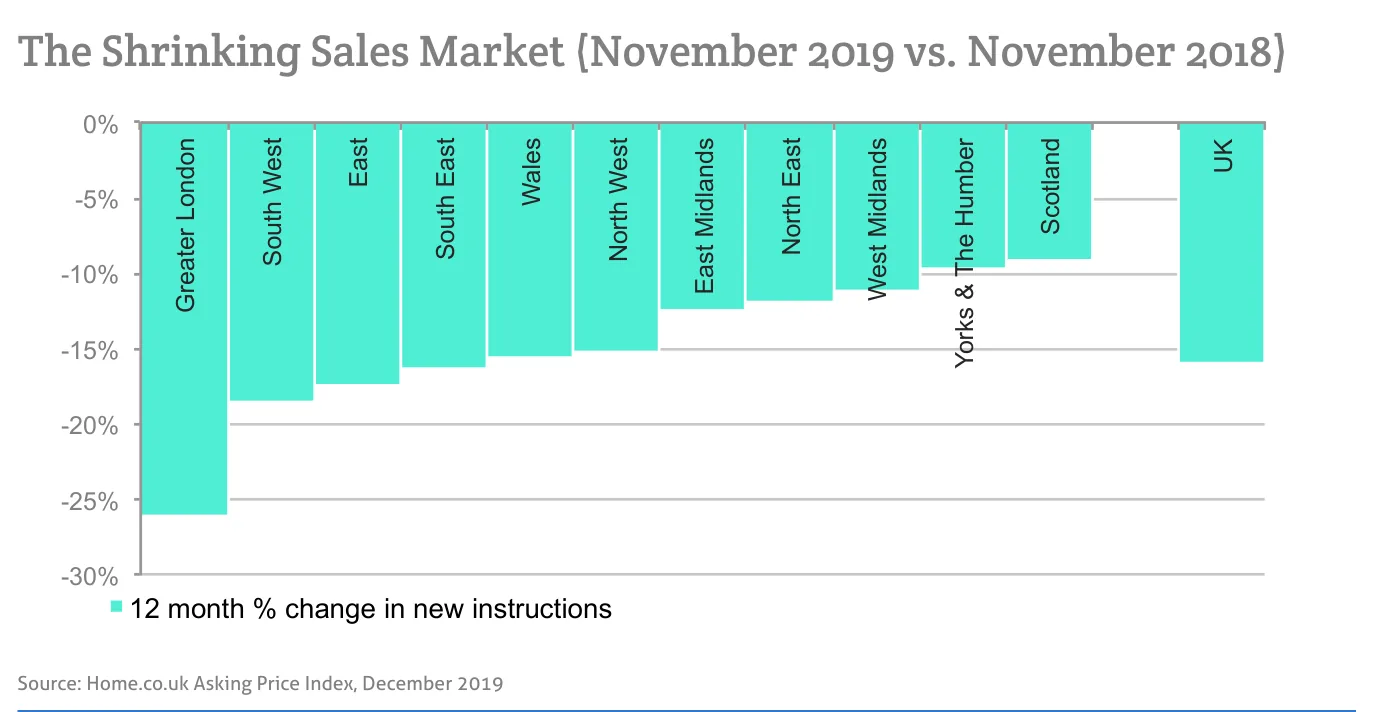
Source: Home.co.uk Asking Price Index, December 2019
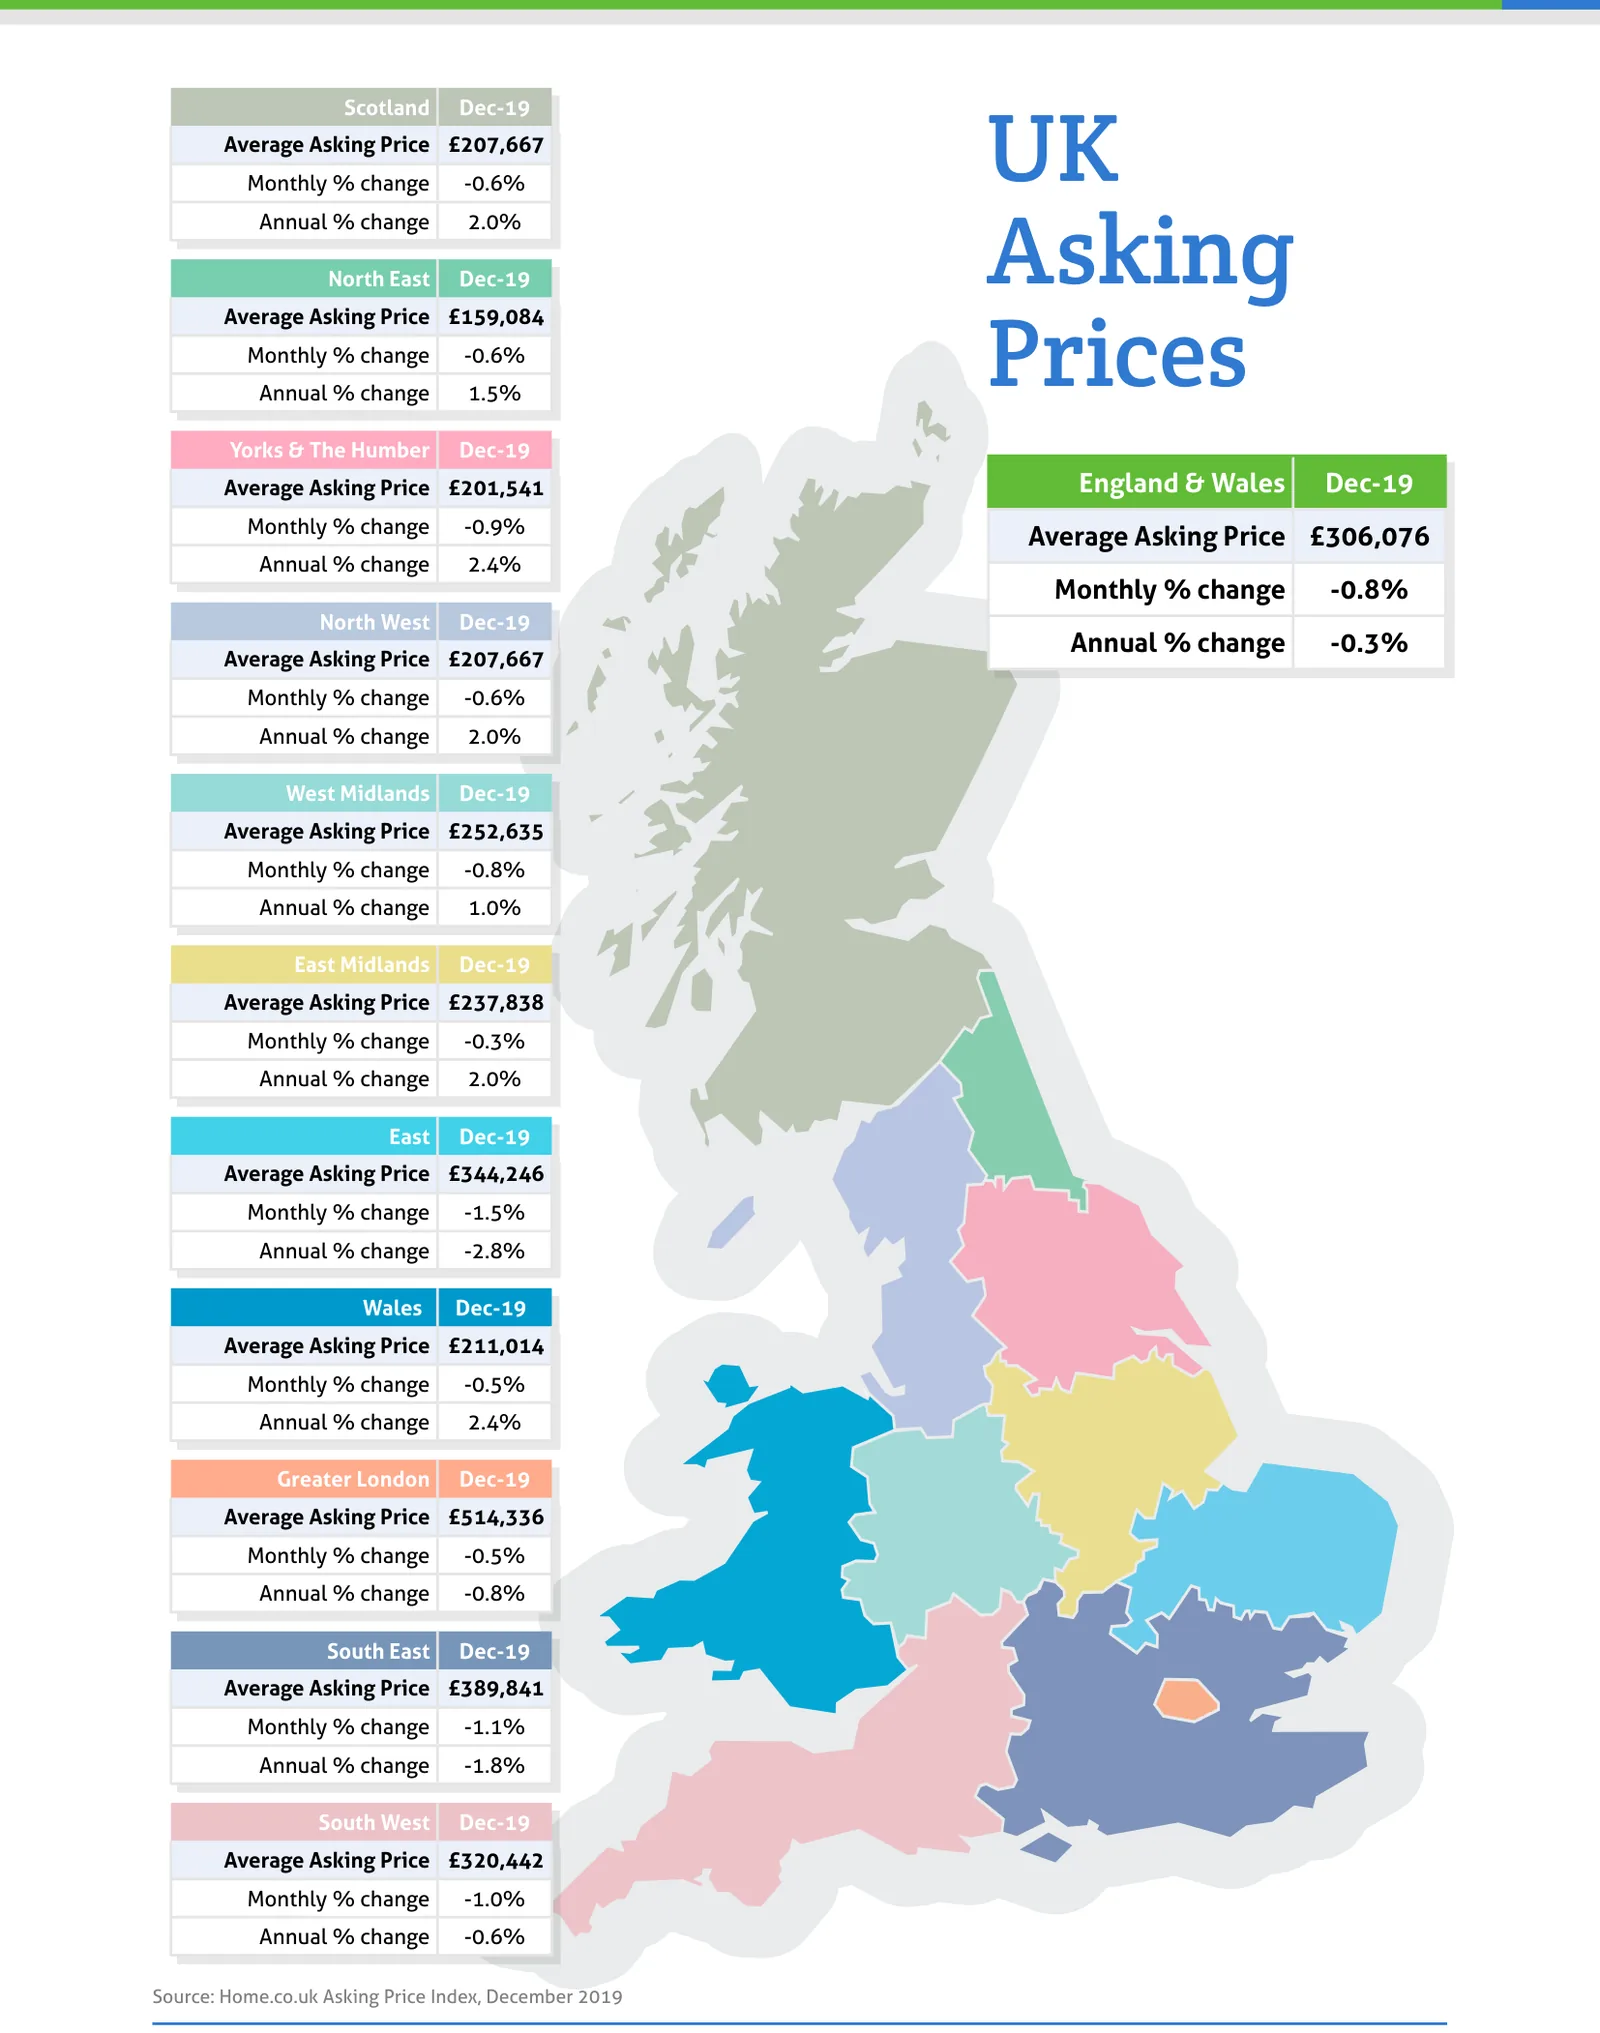
Source: Home.co.uk Asking Price Index, December 2019
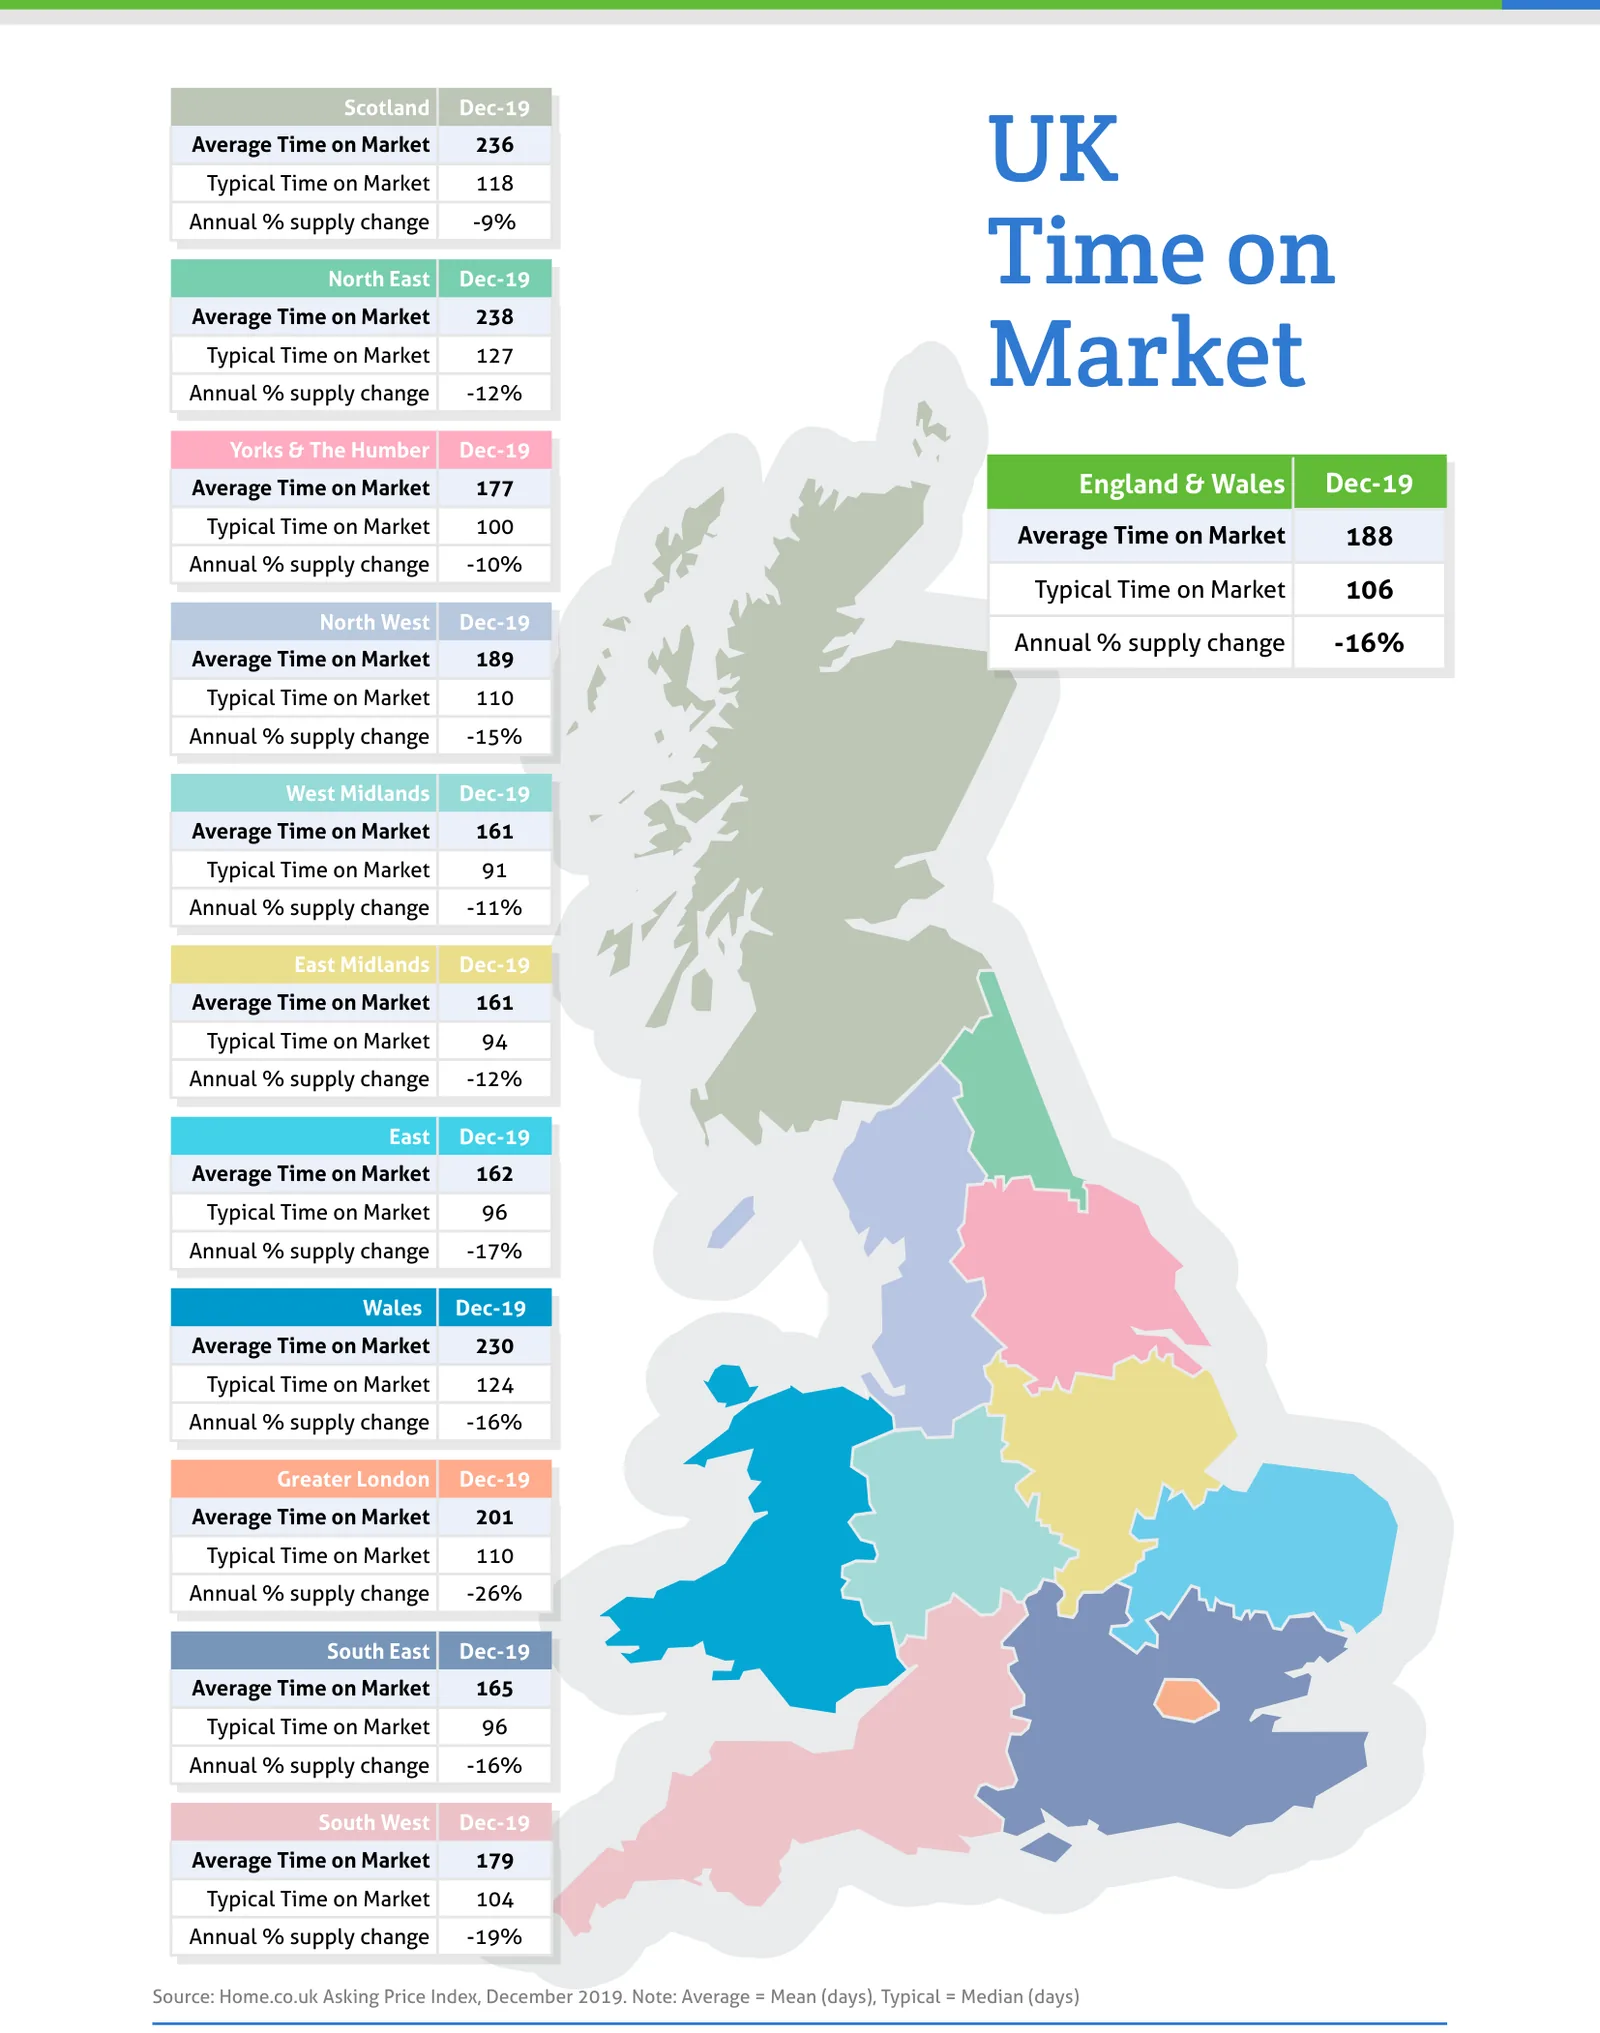
Source: Home.co.uk Asking Price Index, December 2019. Note: Average = Mean (days), Typical = Median (days)
Regional tables
UK Asking Prices, Dec-19
| Region | Average Asking Price | Monthly % change | Annual % change |
|---|---|---|---|
| Scotland | £207,667 | -0.6% | 2.0% |
| North East | £159,084 | -0.6% | 1.5% |
| Yorks & The Humber | £201,541 | -0.9% | 2.4% |
| England & Wales | £306,076 | -0.8% | -0.3% |
| North West | £207,667 | -0.6% | 2.0% |
| West Midlands | £252,635 | -0.8% | 1.0% |
| East Midlands | £237,838 | -0.3% | 2.0% |
| East | £344,246 | -1.5% | -2.8% |
| Wales | £211,014 | -0.5% | 2.4% |
| Greater London | £514,336 | -0.5% | -0.8% |
| South East | £389,841 | -1.1% | -1.8% |
| South West | £320,442 | -1.0% | -0.6% |
UK Time on Market, Dec-19
| Region | Average Time on Market | Typical Time on Market | Annual % supply change |
|---|---|---|---|
| Scotland | 236 | 118 | -9% |
| North East | 238 | 127 | -12% |
| Yorks & The Humber | 177 | 100 | -10% |
| England & Wales | 188 | 106 | -16% |
| North West | 189 | 110 | -15% |
| West Midlands | 161 | 91 | -11% |
| East Midlands | 161 | 94 | -12% |
| East | 162 | 96 | -17% |
| Wales | 230 | 124 | -16% |
| Greater London | 201 | 110 | -26% |
| South East | 165 | 96 | -16% |
| South West | 179 | 104 | -19% |
From the director's commentary
"Meanwhile, I must stress that much activity in the market remains; the bolder investor/buyer is taking advantage of low interest rates and making intelligent investment decisions. Rents are on the rise so, for first-time buyers, it's time to get out of the rent trap, and for investors, it's time to take advantage of better and rising yields."
Doug Shephard, Director at Home.co.uk
Read the full December 2019 edition (PDF, 6 pages)
About the Home Asking Price Index
The Home Asking Price Index measures the change in the prices sellers ask for residential property across England, Wales and Scotland. Today it is computed every month from around half a million advertised homes and is mix-adjusted, so a change in what happens to be on the market does not move the figure; earlier editions state the sample they were built from. Because an asking price is set months before a sale completes, the index runs around five months ahead of completed-sale measures such as the UK House Price Index.
Every edition in the archive, back to October 2006, is listed on the index page. How we measure the UK property market explains the listing data behind it, and today's figures by area are on house prices and rental prices.
Text and figures above are quoted from the December 2019 edition as published, with punctuation normalised for the web, and are not revised. Later editions may restate them.
More in What is happening to house prices: the Home guide
Thinking about your next move?
See what your home's worth in seconds, with the UK's longest-running property data behind it.
Get an instant valuation