

























Home Asking Price Index, December 2013: inventory hits all-time low as seasonal slowdown takes hold
Asking prices in England and Wales dipped 0.1% in December as total stock hit an all-time low, down 38% since 2007, while London prices rose 0.8%.

This is the December 2013 edition of the Home Asking Price Index, released on 12 December 2013, under the headline:
Inventory Hits All-Time Low as Seasonal Slowdown Takes Hold
The headlines and summary below are the report's own words, with the key figures as it published them, followed by the report's charts and regional tables as printed.
Headlines
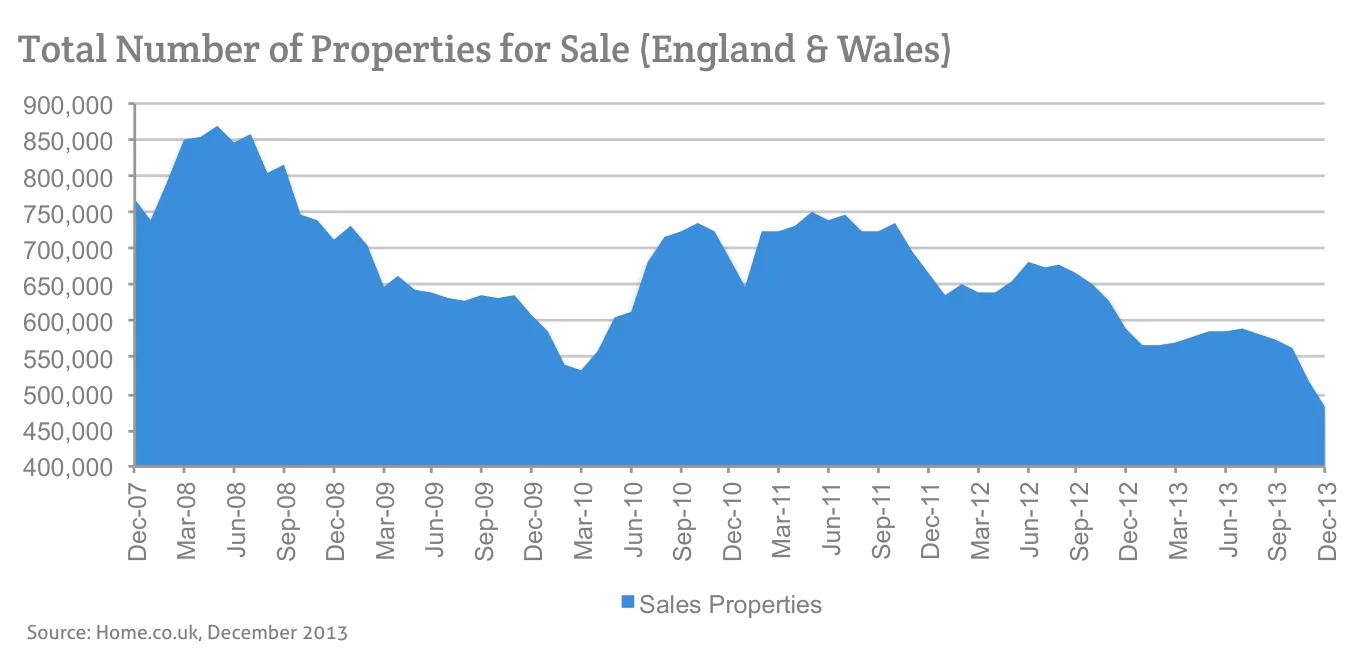
- The overall volume of property for sale falls further to hit an all-time low and now stands 38% lower than in December 2007
- The seasonal downturn impacts on the core market metrics less than expected as average prices across England and Wales dip by just 0.1% on November
- Contrary to seasonal expectations, prices in London surge a further 0.8% since last month
- Considerable regional variations still remain: prices in the North East of England fell 0.7% over the last year and are down 2.2% in Scotland
- Even with a seasonal slowdown, average prices in England and Wales show a post-crisis record increase of 6.1% since this time last year
Summary
Following ten consecutive months of rises, seasonality in the property market is evident, and prices across England and Wales fell marginally (-0.1%) in December. However, there are at least two discrepancies which are unique to 2013. Firstly, the market backdrop is one where the volume of properties for sale is at its lowest level ever recorded by this index and secondly, London continues to ignore the usual market norms, recording yet another monthly price rise of 0.8%.
The total volume of property for sale in the UK has hit a new low and is now 38% below the property count in December 2007. Whilst average prices have dropped marginally this month, the shortage of stock plus improved market sentiment have helped minimise the seasonal dip, in stark contrast to the seasonal falls of around 0.6% observed in previous years. The supply crisis is frustrating an increasing number of potential buyers in the hottest regional markets, and these markets are not showing any signs of rebalancing in the near future. Consequently, average prices remain inflated for this time of year in those areas, and we expect considerable price hikes in early 2014.
Key figures
| Measure | Figure |
|---|---|
| Average asking price (England & Wales) | £246,781 |
| Monthly change (England & Wales) | -0.1% |
| Annual change (England & Wales) | 6.1% |
| Annual change in new instructions | -16.9% |
| Typical time on market (London) | 71 days |
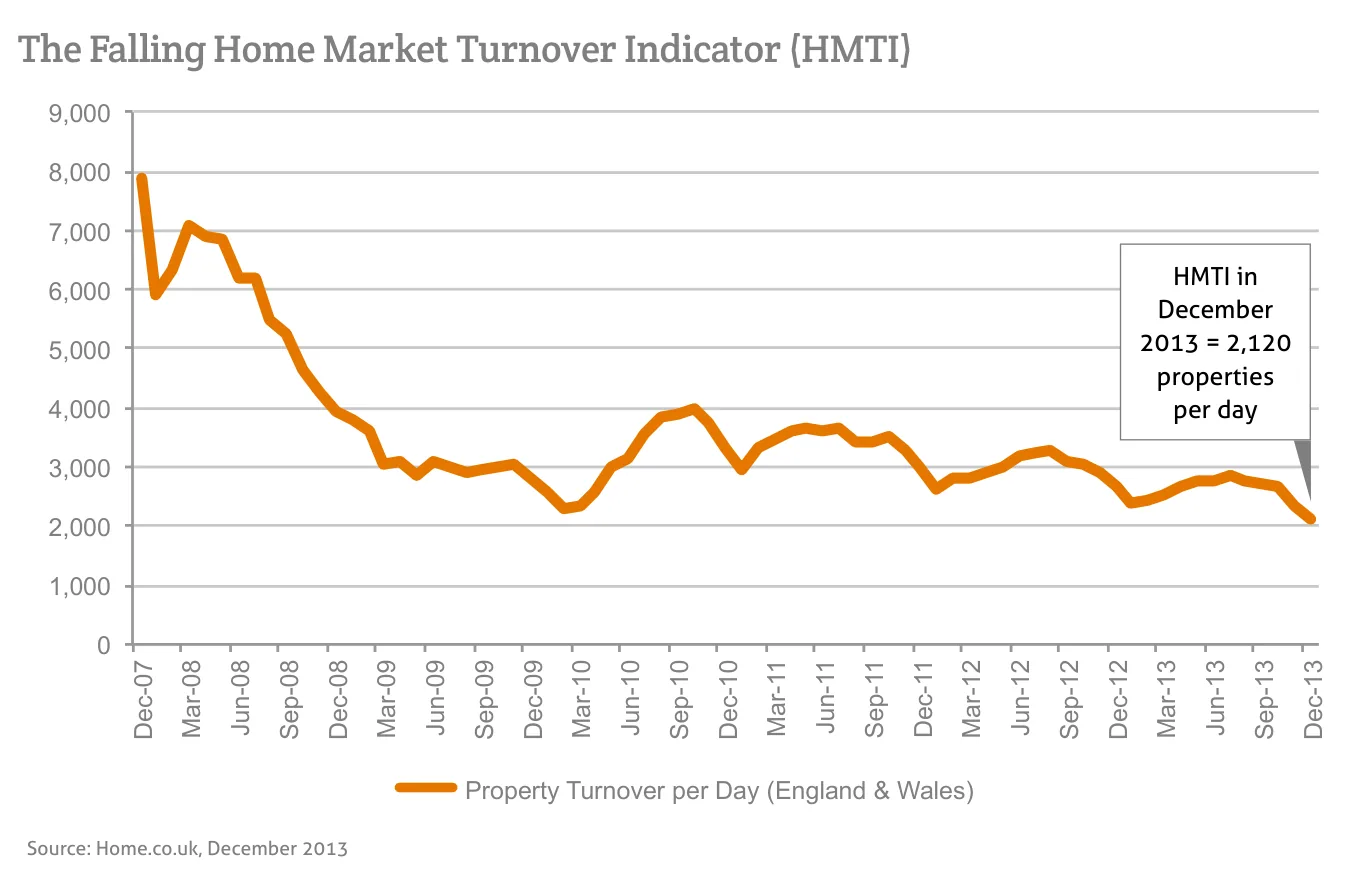
| Home Market Turnover Indicator | 2,120 |
Figures are for England and Wales unless the report states otherwise, as published in the edition.
Charts from the report
Source: Home.co.uk, December 2013
Source: Home.co.uk, December 2013
Source: Home.co.uk, December 2013
Regional tables
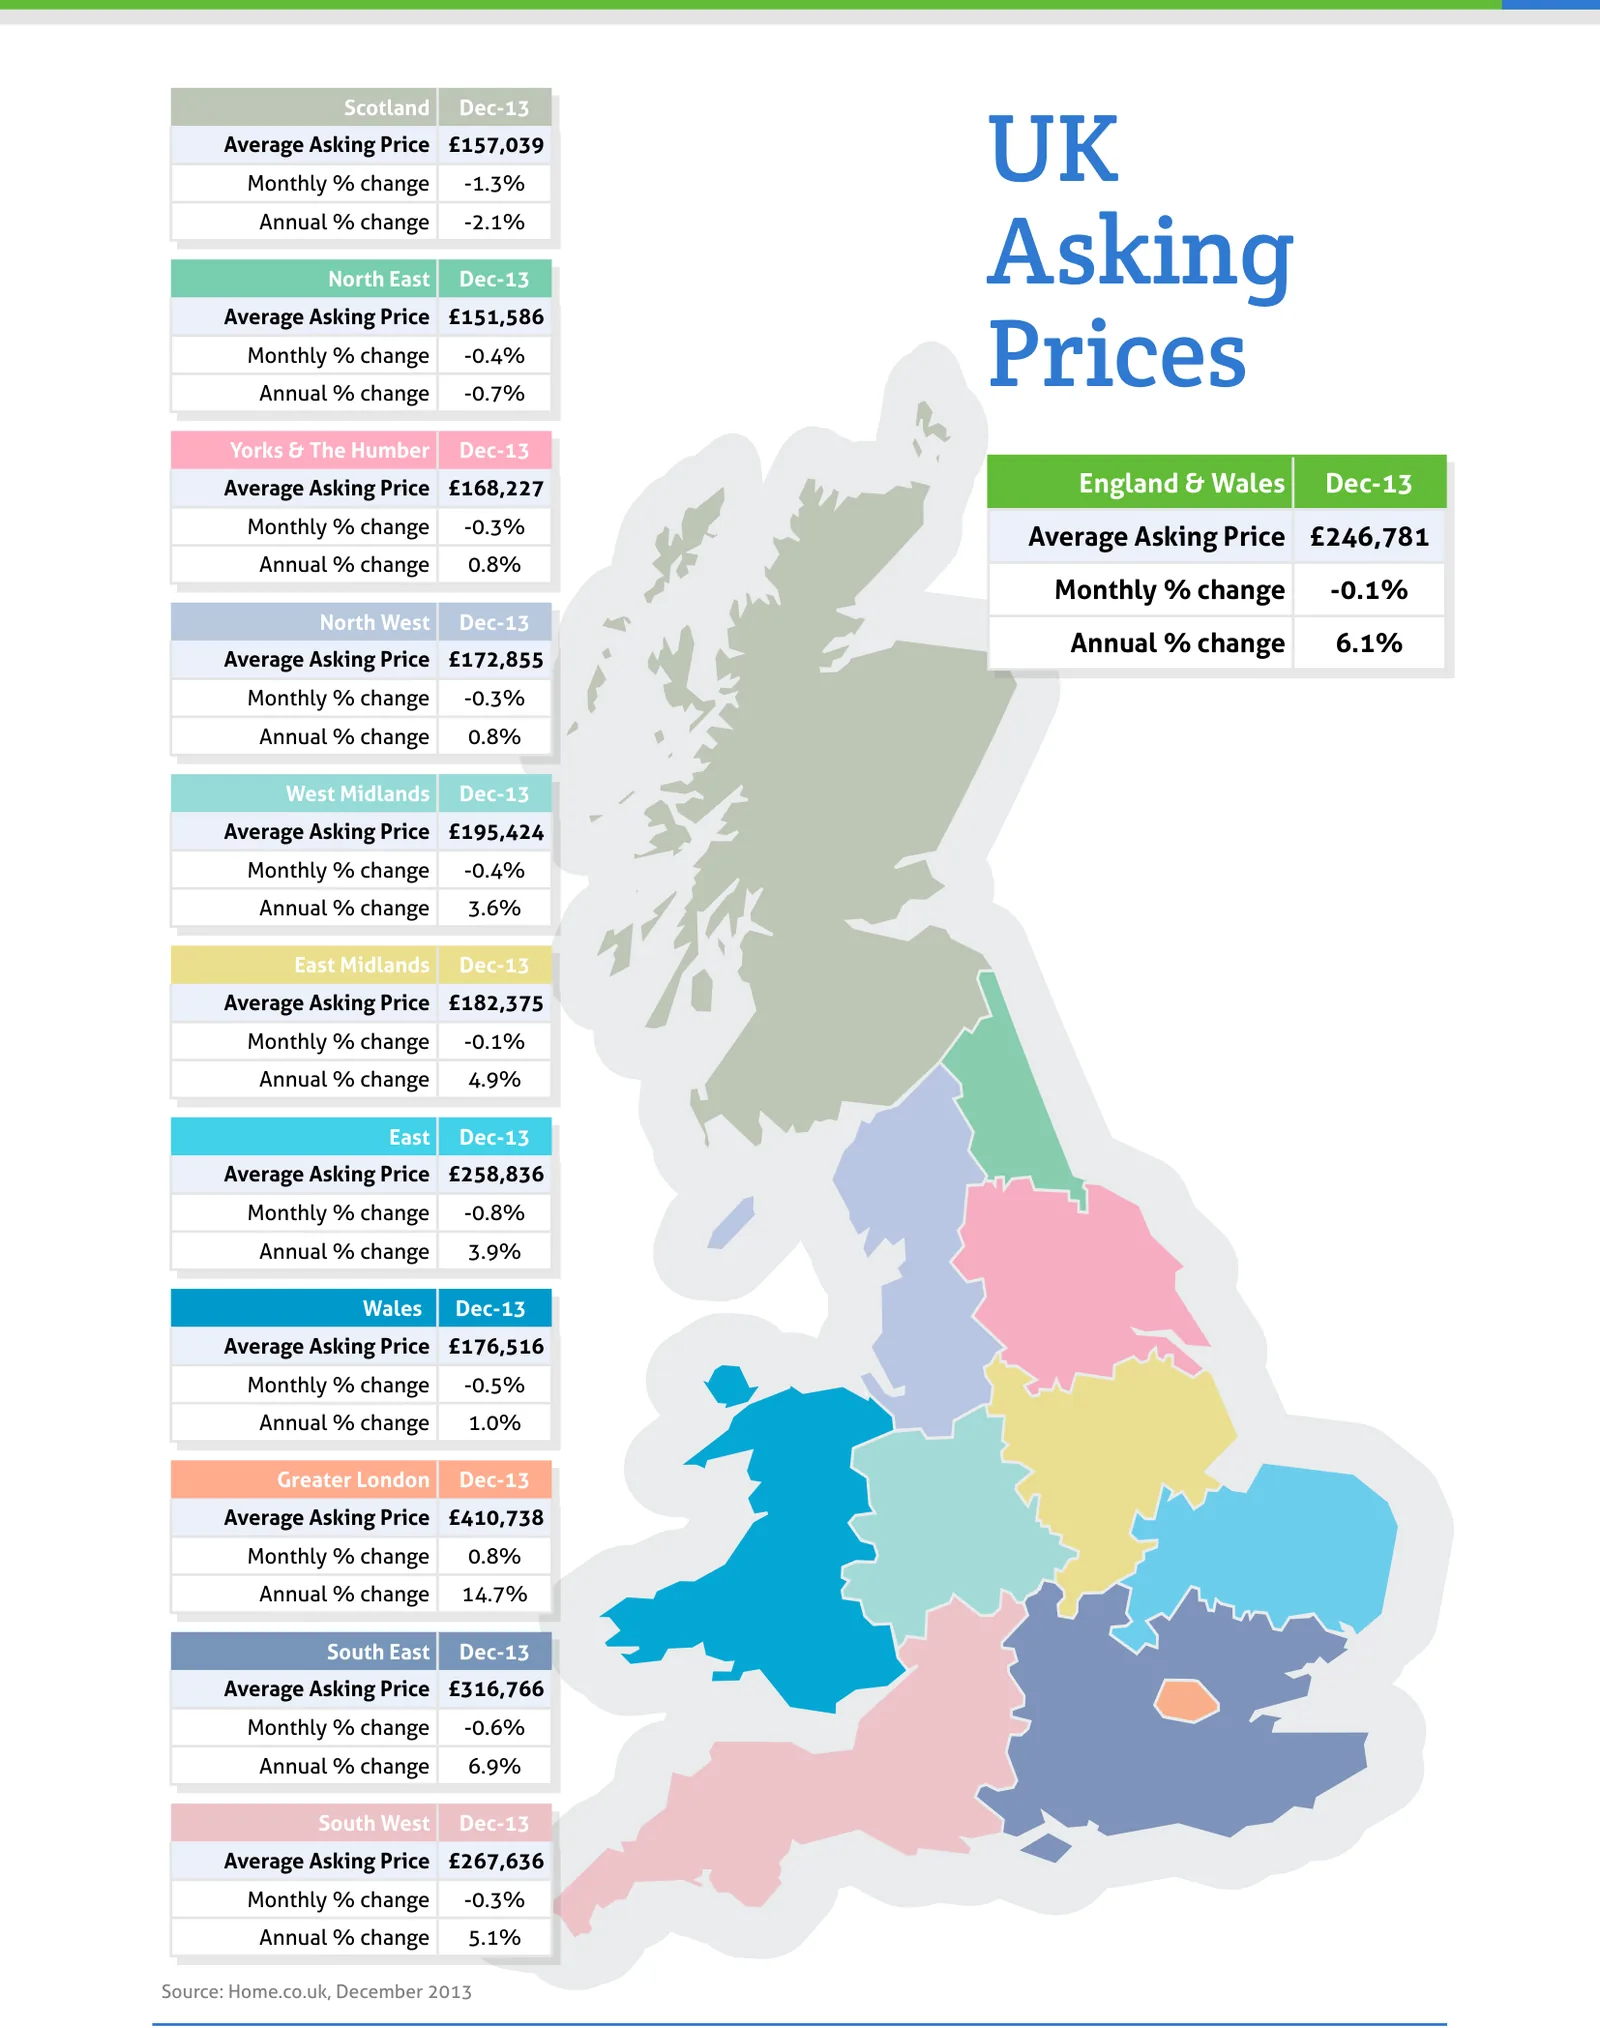
UK Asking Prices, Dec-13
| Region | Average Asking Price | Monthly % change | Annual % change |
|---|---|---|---|
| Scotland | £157,039 | -1.3% | -2.1% |
| North East | £151,586 | -0.4% | -0.7% |
| Yorks & The Humber | £168,227 | -0.3% | 0.8% |
| England & Wales | £246,781 | -0.1% | 6.1% |
| North West | £172,855 | -0.3% | 0.8% |
| West Midlands | £195,424 | -0.4% | 3.6% |
| East Midlands | £182,375 | -0.1% | 4.9% |
| East | £258,836 | -0.8% | 3.9% |
| Wales | £176,516 | -0.5% | 1.0% |
| Greater London | £410,738 | 0.8% | 14.7% |
| South East | £316,766 | -0.6% | 6.9% |
| South West | £267,636 | -0.3% | 5.1% |
From the director's commentary
"Any market that contracts by over 20% in just one year is showing signs of distress, let alone one that traditionally holds as much value as the UK property market. Potential buyers and investors, encouraged by government-backed credit, are chasing ever fewer properties."
Doug Shephard, director at Home.co.uk
Read the full December 2013 edition (PDF, 5 pages)
About the Home Asking Price Index
The Home Asking Price Index measures the change in the prices sellers ask for residential property across England, Wales and Scotland. Today it is computed every month from around half a million advertised homes and is mix-adjusted, so a change in what happens to be on the market does not move the figure; earlier editions state the sample they were built from. Because an asking price is set months before a sale completes, the index runs around five months ahead of completed-sale measures such as the UK House Price Index.
Every edition in the archive, back to October 2006, is listed on the index page. How we measure the UK property market explains the listing data behind it, and today's figures by area are on house prices and rental prices.
Text and figures above are quoted from the December 2013 edition as published, with punctuation normalised for the web, and are not revised. Later editions may restate them.
More in What is happening to house prices: the Home guide
Thinking about your next move?
See what your home's worth in seconds, with the UK's longest-running property data behind it.
Get an instant valuation