

























Home Asking Price Index, August 2024: Bank Rate cut to boost recovery
Asking prices in England and Wales rose 0.2% in August 2024, taking annual growth to 1.2%, while new instructions were 4% higher than a year earlier.

This is the August 2024 edition of the Home Asking Price Index, released on 16 August 2024, under the headline:
Bank Rate Cut to Boost Recovery
The headlines and summary below are the report's own words, with the key figures as it published them, followed by the report's charts and regional tables as printed.
Headlines
- Asking prices rose by 0.2% during the last month across England and Wales (the seventh consecutive monthly rise) and are now up 1.2% compared to August 2023.
- Prices increased again in all English regions (except the North West and South East where they remain unchanged), Wales and Scotland last month. The mix-adjusted average jumped by 1.1% in Scotland and by 1.3% in the North East.
- The unsold sales stock count for England and Wales rose again over the last month to reach a 10-year high for August. Nearly 6,000 properties were added to agents' portfolios, taking the current total of unsold stock to 494,837.
- Despite this 10-year high, sales market momentum remains relatively healthy, as indicated by both the Typical Time on Market (median) for unsold property being four days less than in August 2019 and our Market Turnover Indicator. However, the current median time on market for unsold property is nine days more than in August last year.
Summary
The East of England and Greater London still have considerable ground to make up before they return to their 2022 price highs. We expect recovery to remain slow despite the recent rate cut due to their relatively poor rental yields. Meanwhile, the northern, Scottish and Welsh markets have long since surpassed their 2022 highs and are indicating inflation-beating growth. Their prospects have just improved further thanks to the rate cut.
The "better late than never" rate cut by the Bank of England serves to boost an already very busy property market. The added tailwind of entering a likely prolonged period of falling mortgage rates will most certainly stimulate demand and come to the aid of the five English regions which have yet to recover their 2022 price highs. Our expectations are that home price growth overall will remain moderate while high stock levels persist. However, considerable regional variation is apparent, and the already vibrant inflation-beating northern markets (e.g. the North East) will potentially move into overdrive in the near term.
Overall, key market indicators confirm that the UK property market is in good shape and looks set to prosper as borrowing costs steadily decline. Typical Time on Market is slightly lower than in pre-pandemic August 2019 and annualised price growth is significantly better overall despite the poor performance of several regions, predominantly in the South and East. A key driver of current growth is buy-to-let investment focused on the best yields available and this correlates with the more vigorous northern markets.
Key figures
| Measure | Figure |
|---|---|
| Monthly change in asking prices | +0.2% |
| Annual change in asking prices | +1.2% |
| New instructions, year-on-year | 4% |
| Asking rent growth, annualised | 1.1% |
| Properties available to rent | 66,000 |
| Drop in rental stock since August 2019 | 31% |
Figures are for England and Wales unless the report states otherwise, as published in the edition.
Charts from the report
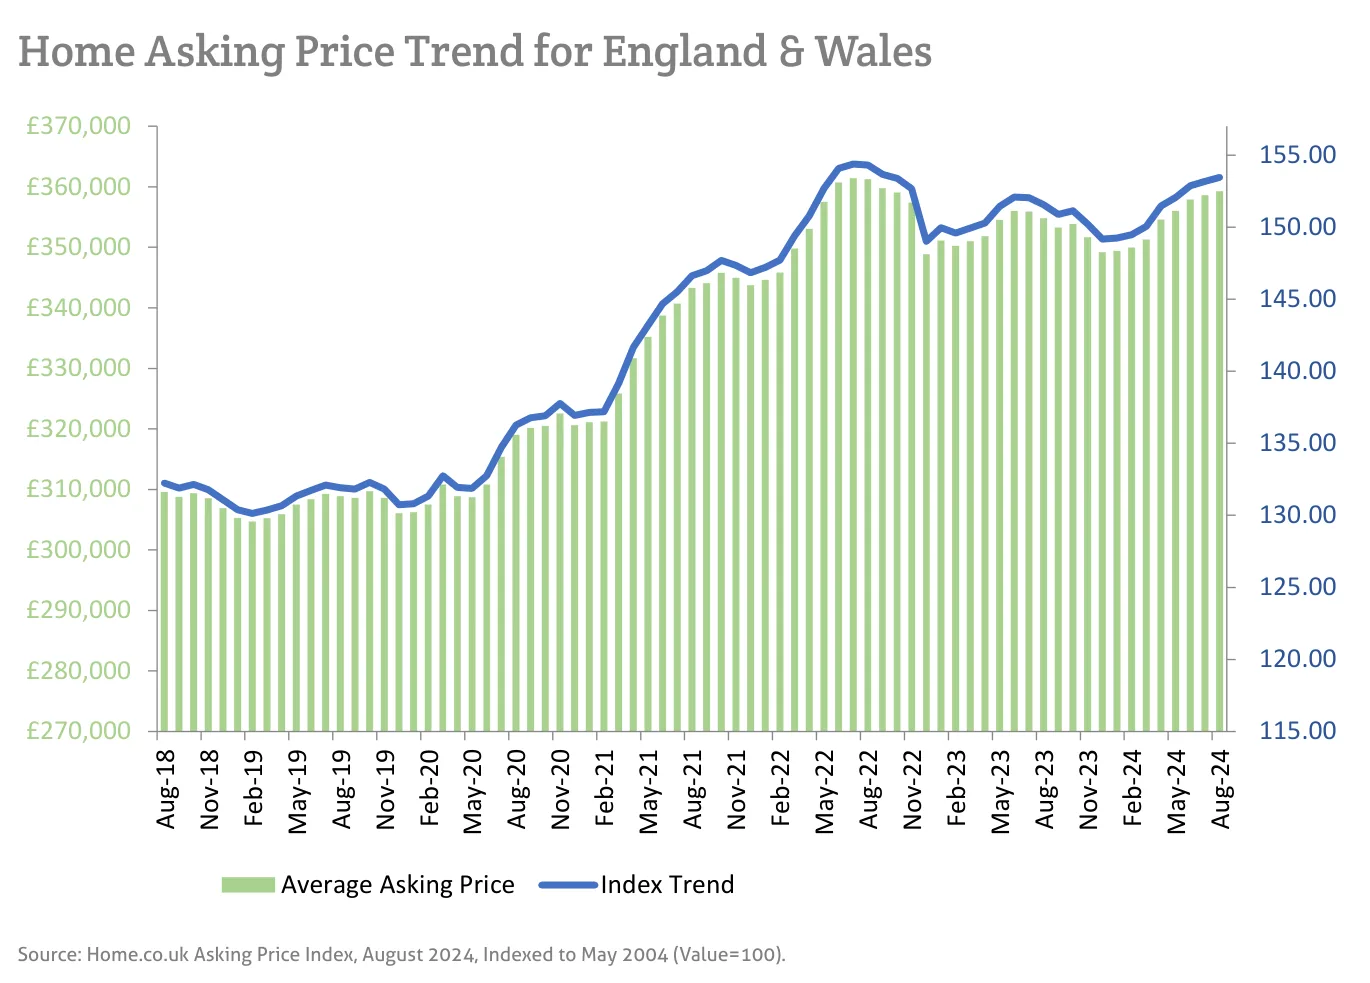
Source: Home.co.uk Asking Price Index, August 2024, Indexed to May 2004 (Value=100).
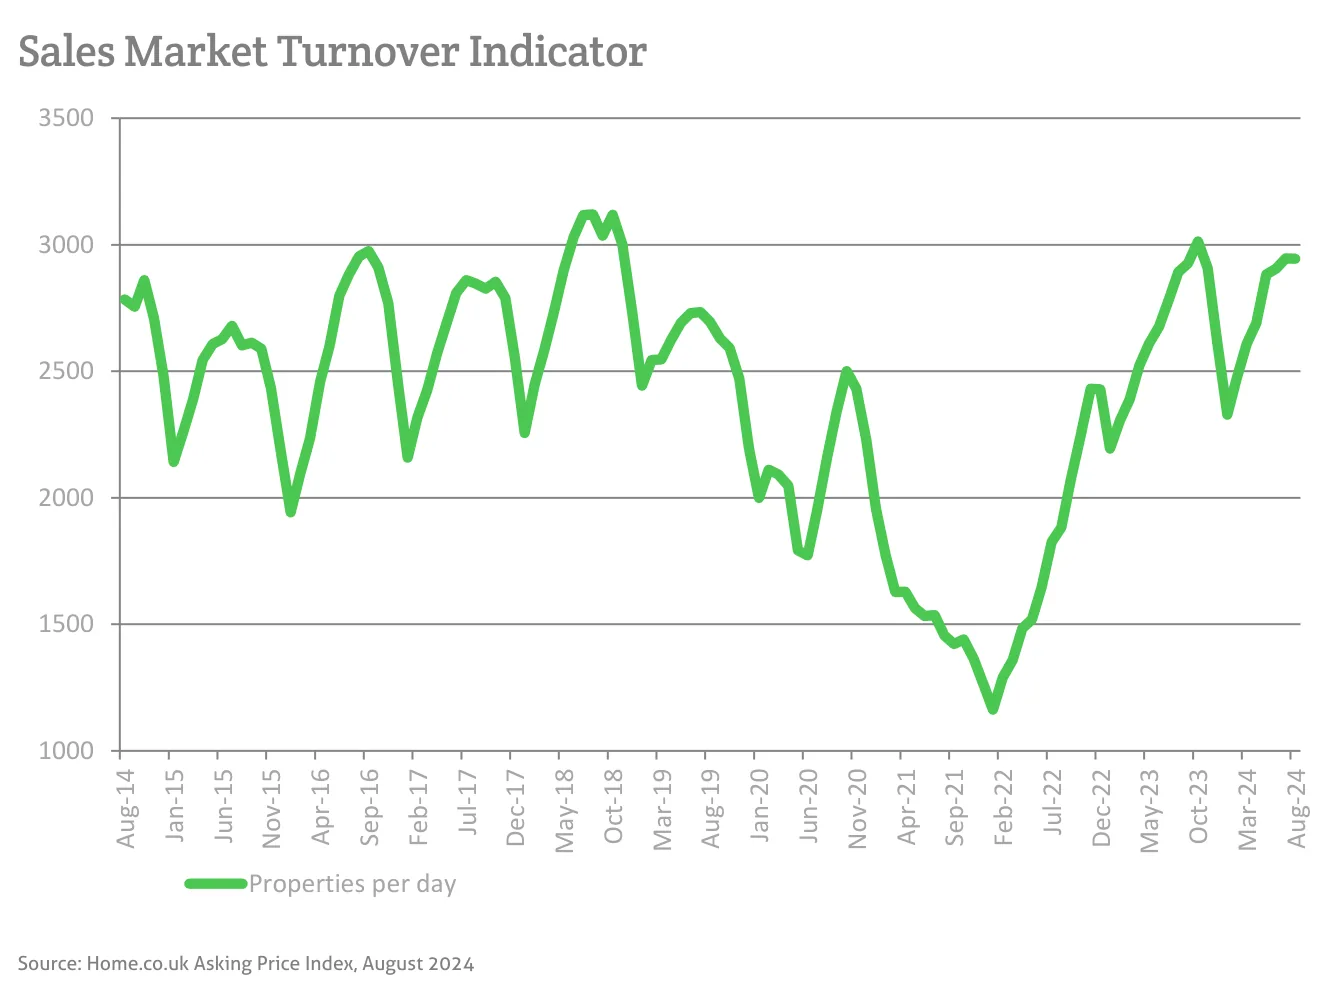
Source: Home.co.uk Asking Price Index, August 2024
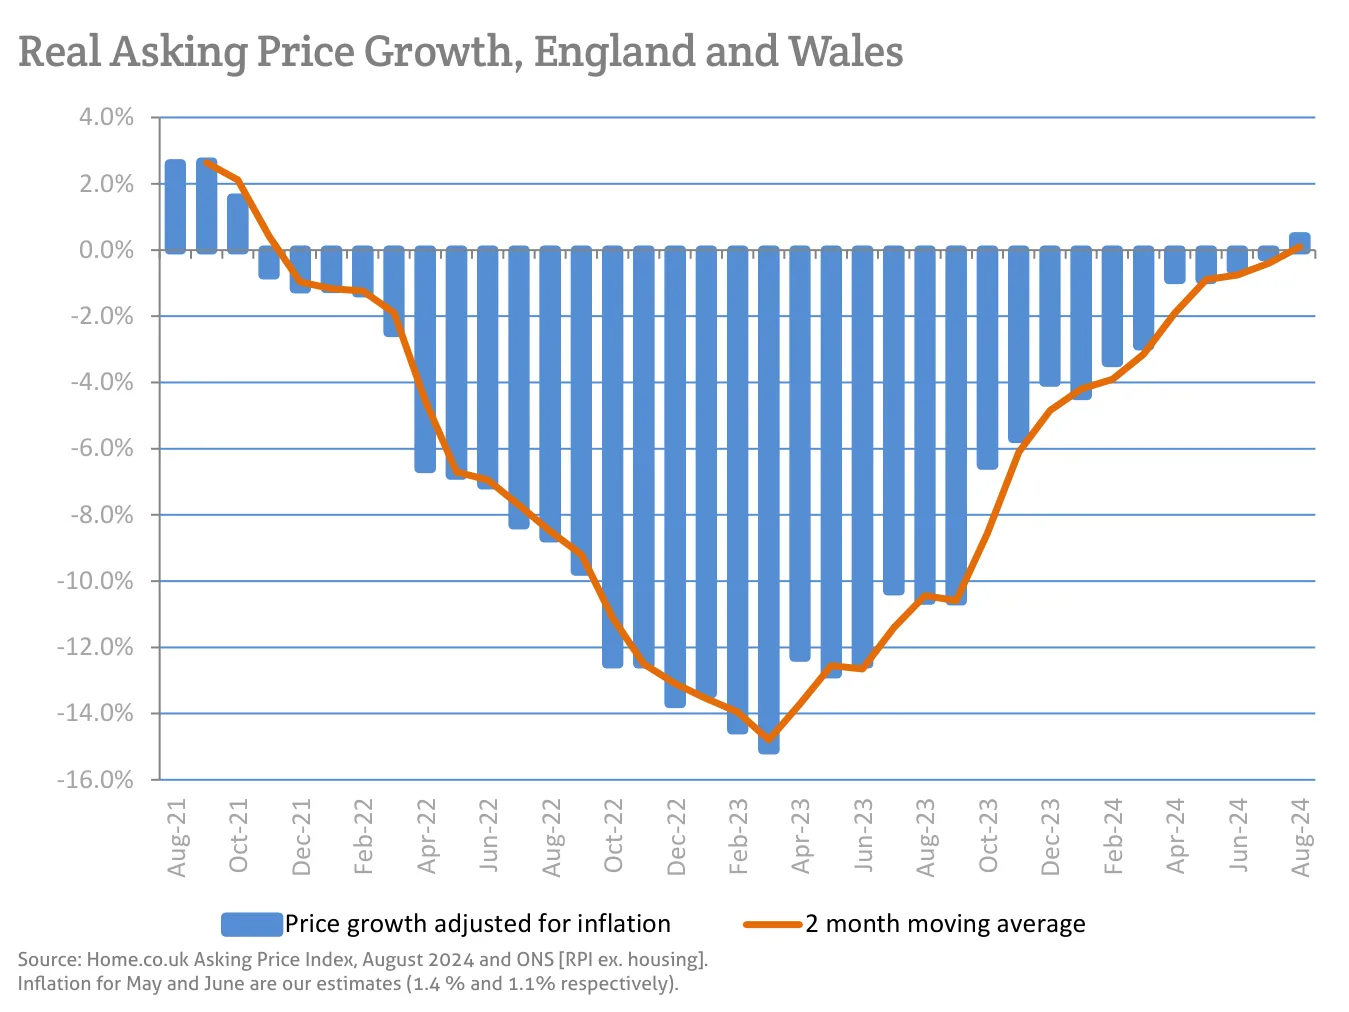
Source: Home.co.uk Asking Price Index, August 2024 and ONS [RPI ex. housing].
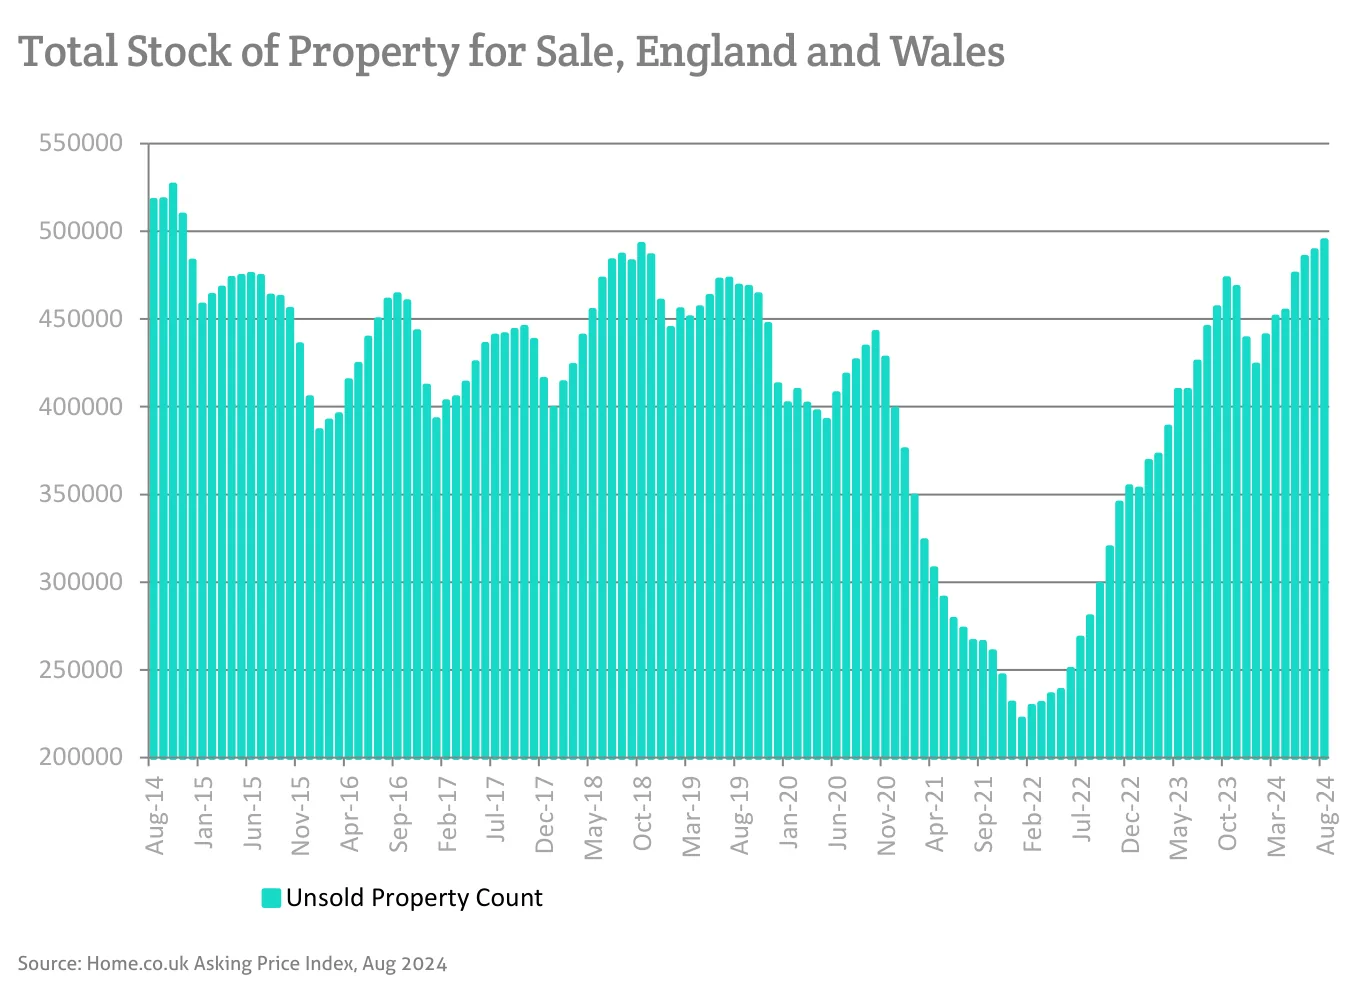
Source: Home.co.uk Asking Price Index, Aug 2024
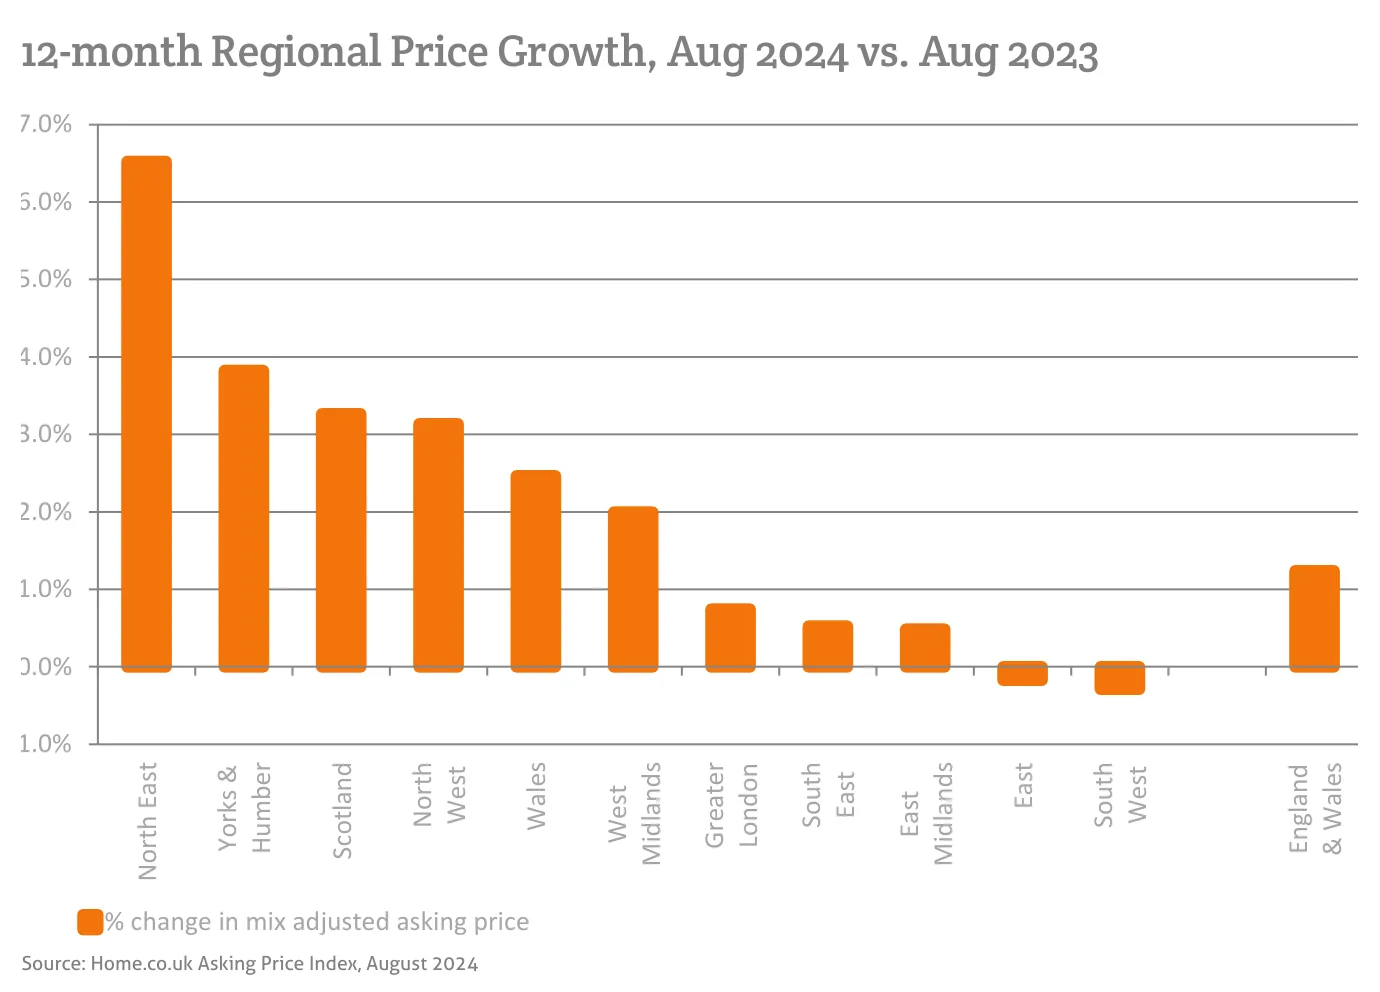
Source: Home.co.uk Asking Price Index, August 2024
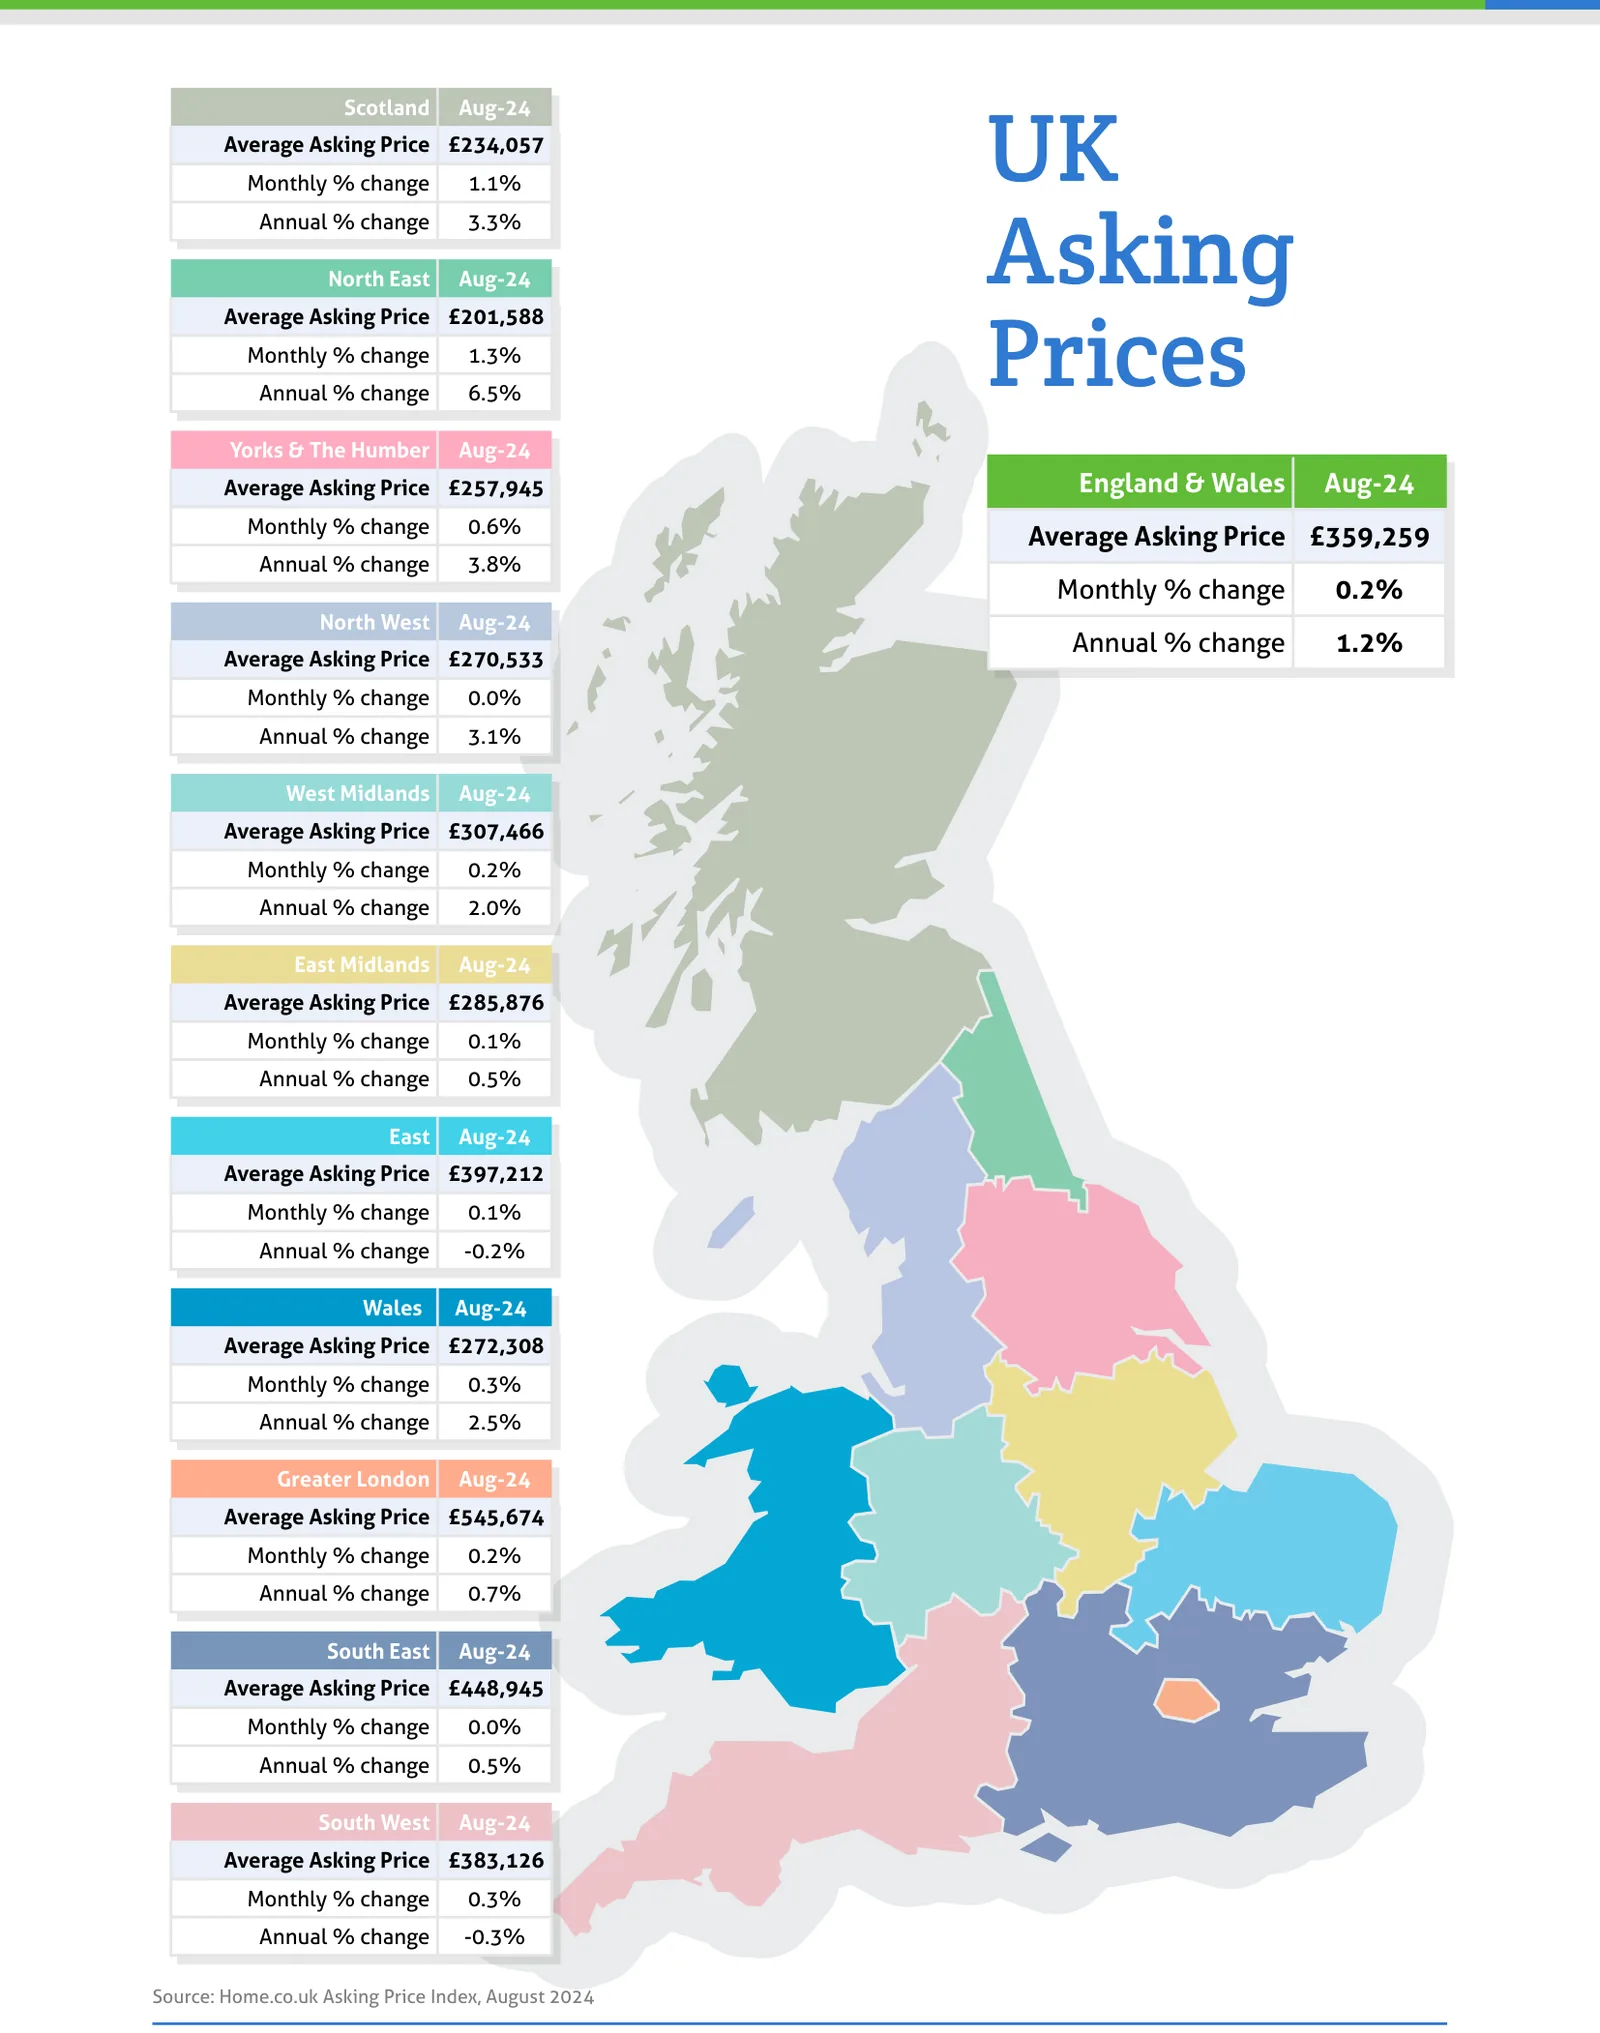
Source: Home.co.uk Asking Price Index, August 2024
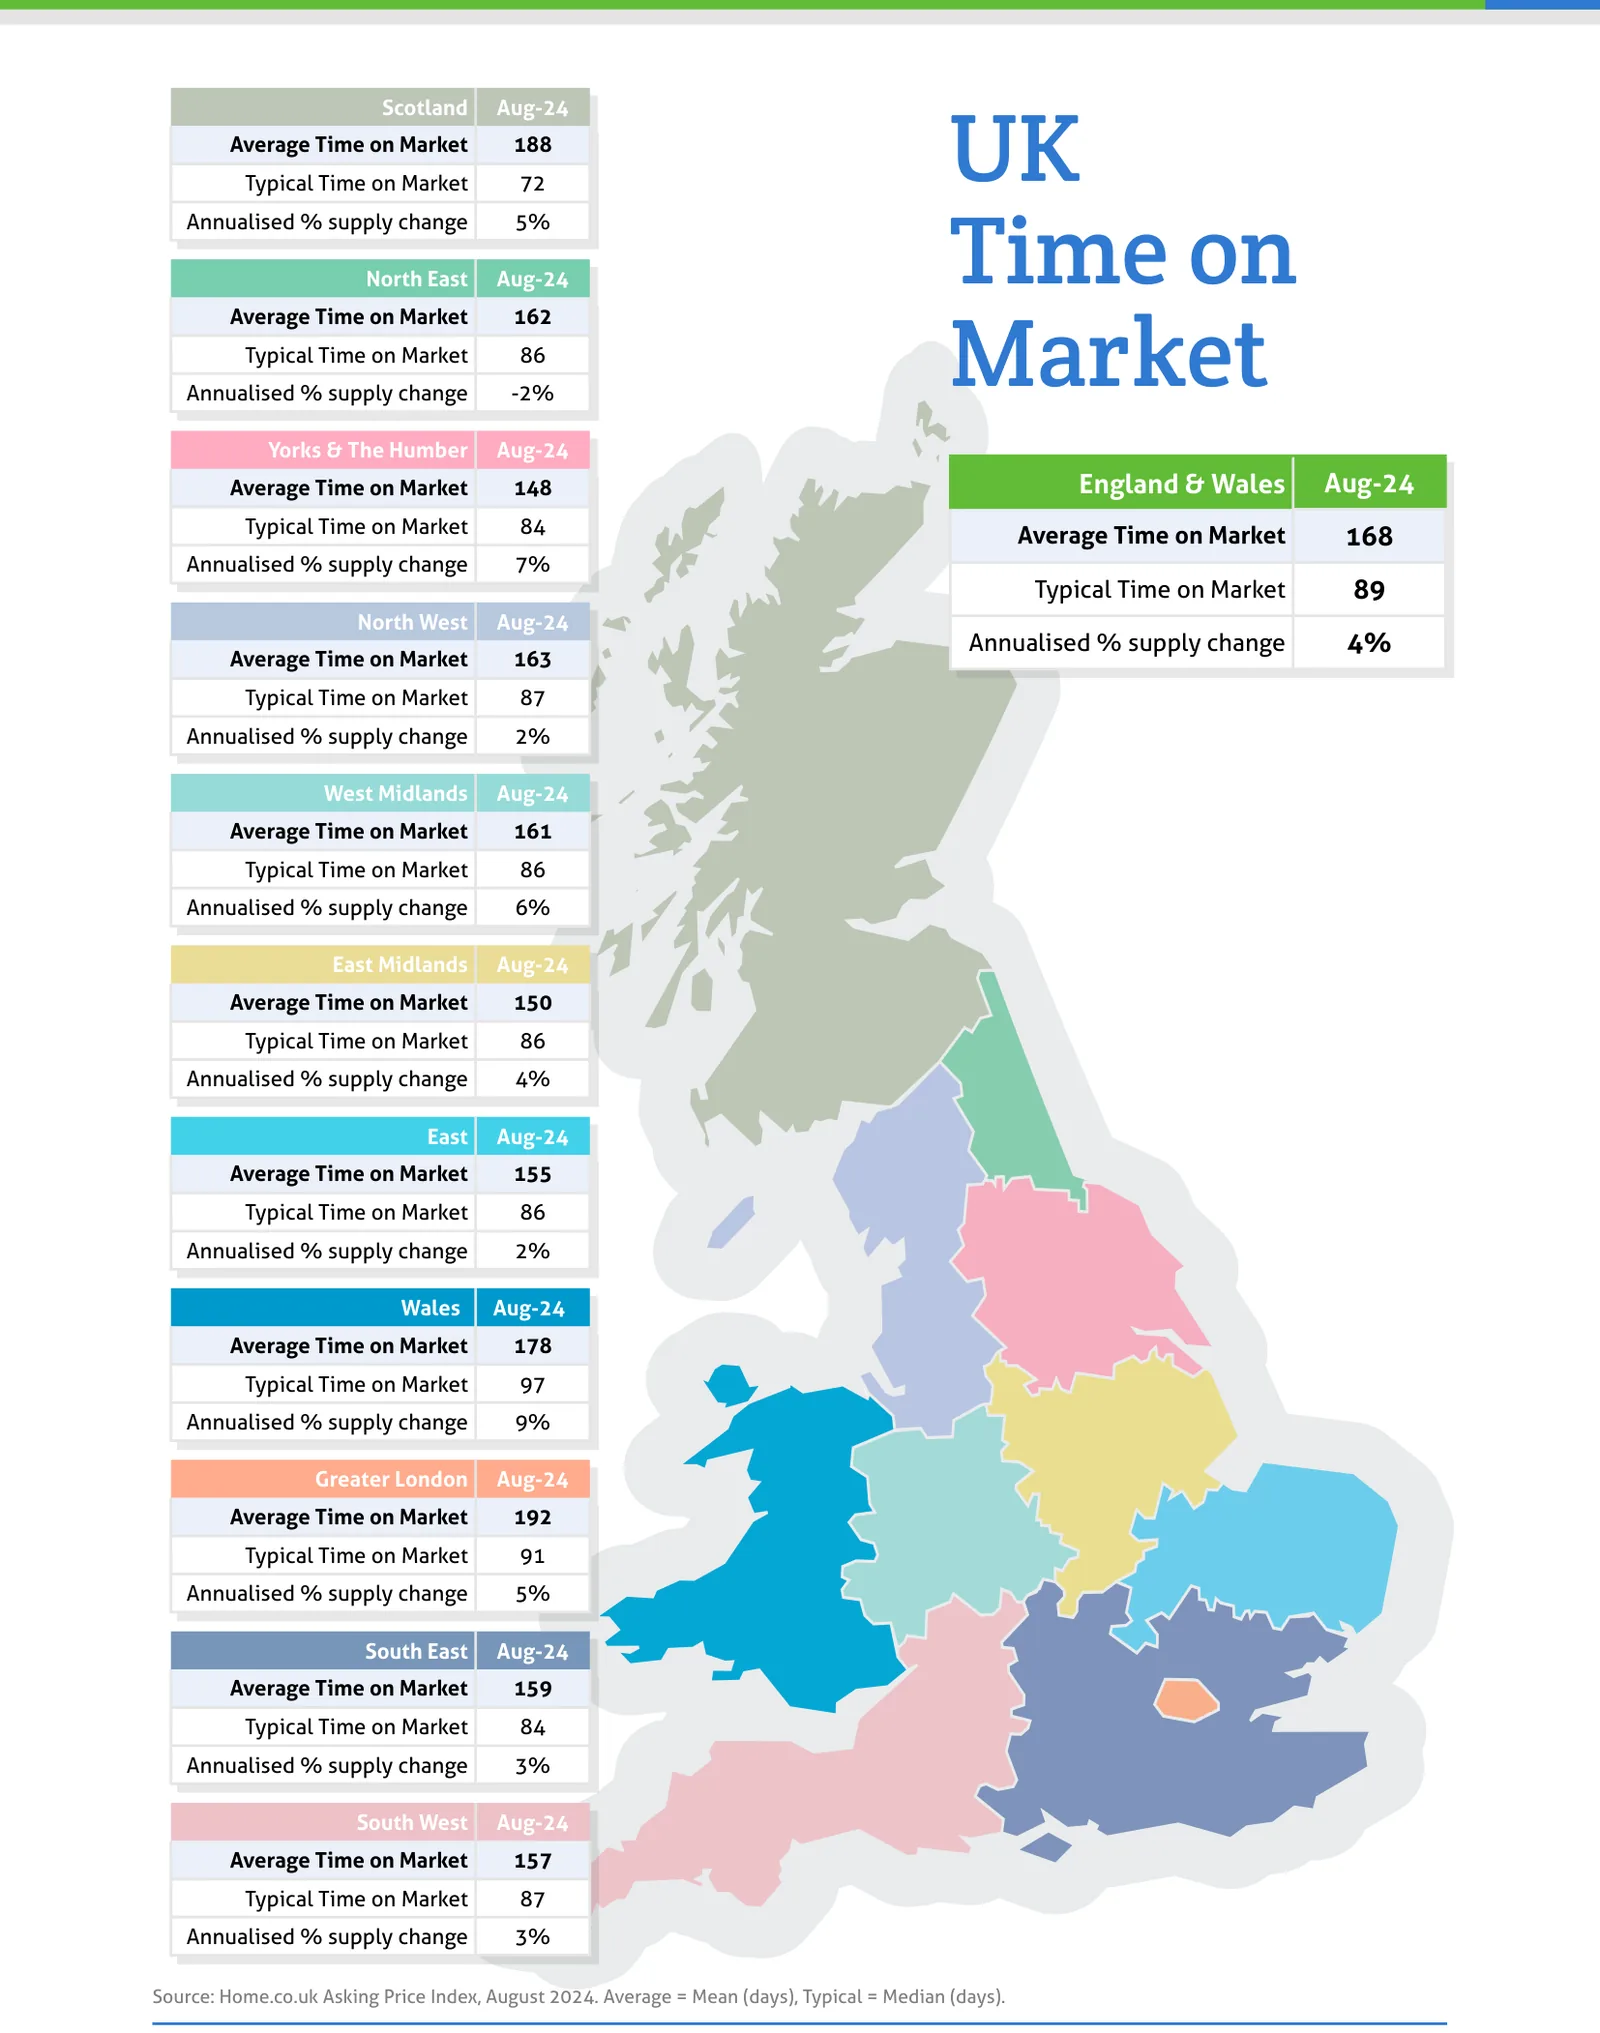
Source: Home.co.uk Asking Price Index, August 2024. Average = Mean (days), Typical = Median (days).
Regional tables
UK Asking Prices, Aug-24
| Region | Average Asking Price | Monthly % change | Annual % change |
|---|---|---|---|
| Scotland | £234,057 | 1.1% | 3.3% |
| North East | £201,588 | 1.3% | 6.5% |
| Yorks & The Humber | £257,945 | 0.6% | 3.8% |
| England & Wales | £359,259 | 0.2% | 1.2% |
| North West | £270,533 | 0.0% | 3.1% |
| West Midlands | £307,466 | 0.2% | 2.0% |
| East Midlands | £285,876 | 0.1% | 0.5% |
| East | £397,212 | 0.1% | -0.2% |
| Wales | £272,308 | 0.3% | 2.5% |
| Greater London | £545,674 | 0.2% | 0.7% |
| South East | £448,945 | 0.0% | 0.5% |
| South West | £383,126 | 0.3% | -0.3% |
UK Time on Market, Aug-24
| Region | Average Time on Market | Typical Time on Market | Annualised % supply change |
|---|---|---|---|
| Scotland | 188 | 72 | 5% |
| North East | 162 | 86 | -2% |
| Yorks & The Humber | 148 | 84 | 7% |
| England & Wales | 168 | 89 | 4% |
| North West | 163 | 87 | 2% |
| West Midlands | 161 | 86 | 6% |
| East Midlands | 150 | 86 | 4% |
| East | 155 | 86 | 2% |
| Wales | 178 | 97 | 9% |
| Greater London | 192 | 91 | 5% |
| South East | 159 | 84 | 3% |
| South West | 157 | 87 | 3% |
From the director's commentary
"So, it's already bad but it may well get much worse. If additional taxation of several sorts and red tape weren't enough to deter landlords, Starmer's government plan to reincarnate the Renters Reform Bill (now the Renters Rights Bill) may well be the final straw."
Doug Shephard, Director at Home.co.uk
Read the full August 2024 edition (PDF, 11 pages)
About the Home Asking Price Index
The Home Asking Price Index measures the change in the prices sellers ask for residential property across England, Wales and Scotland. Today it is computed every month from around half a million advertised homes and is mix-adjusted, so a change in what happens to be on the market does not move the figure; earlier editions state the sample they were built from. Because an asking price is set months before a sale completes, the index runs around five months ahead of completed-sale measures such as the UK House Price Index.
Every edition in the archive, back to October 2006, is listed on the index page. How we measure the UK property market explains the listing data behind it, and today's figures by area are on house prices and rental prices.
Text and figures above are quoted from the August 2024 edition as published, with punctuation normalised for the web, and are not revised. Later editions may restate them.
More in What is happening to house prices: the Home guide
Thinking about your next move?
See what your home's worth in seconds, with the UK's longest-running property data behind it.
Get an instant valuation