

























Home Asking Price Index, August 2023: prices hold firm in the North but slide in the South
England and Wales asking prices dipped 0.3% in a month and 1.8% year on year, while stock rose to 445,363 and rents jumped 11.9% annually.

This is the August 2023 edition of the Home Asking Price Index, released on 16 August 2023, under the headline:
Prices Hold Firm in the North but Slide in the South
The headlines and summary below are the report's own words, with the key figures as it published them, followed by the report's charts and regional tables as printed.
Headlines
- Asking prices across England and Wales have taken what could be regarded simply as a seasonal dip of 0.3% since last month, although at the same time rising mortgage costs are inevitably dampening vendors' expectations, most notably in the South.
- Accordingly, year-on-year growth in asking prices is now -1.8%. This minor fall represents the total drop from last year's peak pricing in August 2022.
- The Typical Time on Market for unsold property in England and Wales increased by just two days during July, consistent with seasonal expectations. The current median is a relatively healthy 80 days, which is considerably lower than at any point during pre-pandemic 2019.
- The total sales stock count for England and Wales increased again towards levels last seen in 2019. The current total of unsold property is 445,363.
- Despite falls in most English regions, asking prices have risen since last month in the North West, Yorkshire and Scotland, attesting to the continued strength of these northern markets. Welsh prices remain unchanged.
- The supply rate of new instructions entering the market remains very restrained: down 2% vs. July 2022 and down 4% vs. July 2018. The largest year-on-year rise was in the East of England (+5%).
- Typical Time on Market for unsold property has risen in all English regions since last month with the exception of the North West and London, which fell by one and three days respectively. The median also increased in Scotland and Wales.
- The Scottish property market remains the leader in terms of annualised regional price growth (5.5%), while falls in London are now outpaced by the East of England at -3.7%.
- Rents across the UK continue to rise overall (11.9% annualised) and are now led by the East Midlands (up 17.8%) where supply of available properties remains tight.
- The current rent growth leaders in London asking rents are the boroughs of Bexley and Hillingdon (+40% and +31% annualised respectively).
Summary
The UK property market continues to show remarkable resilience in the face of rising borrowing costs. Key indicators such as marketing times and stock levels continue to weigh in lower than observed in pre-COVID years 2018 and 2019. Meanwhile, following the December 2022 drop, pricing remains relatively firm overall with no notable increase in price-cutting of on-market properties. Of course, the mix-adjusted national average is down compared to August 2022, but this is precisely when prices peaked at the end of the unprecedented COVID boom that saw stock levels decimated in the rush to buy.
A further hike in the base rate of 0.25% to 5.25% earlier this month has attracted criticism as essentially being too much too late. Even the Bank of England themselves say that inflation will fall of its own accord, so why risk a recession and financial hardship for millions of citizens? Indeed, the full effect of the recent rises in the cost of borrowing have yet to be revealed so the risk of overshooting the target is significant, along with collateral damage to the UK property market.
While increased mortgage rates are having a negative effect on market sentiment, it should be noted that current observations are not outside the normal seasonal cycle. Indeed, both prices and stock levels typically peak during the summer. It therefore remains to be seen if this is indeed the case or whether unsold stock totals continue to rise later in the year, which would indicate a switch from scarcity to overabundance. However, given the extreme demand and low supply in the rental sector, this scenario would appear unlikely for the time being.
Key figures
| Measure | Figure |
|---|---|
| Monthly change in asking prices | -0.3% |
| Annual change in asking prices | -1.8% |
| Typical Time on Market | 80 days |
| Change in new instructions vs July 2022 | -2% |
| Change in new instructions vs July 2018 | -4% |
| UK average asking rent annual change | 11.9% |
Figures are for England and Wales unless the report states otherwise, as published in the edition.
Charts from the report
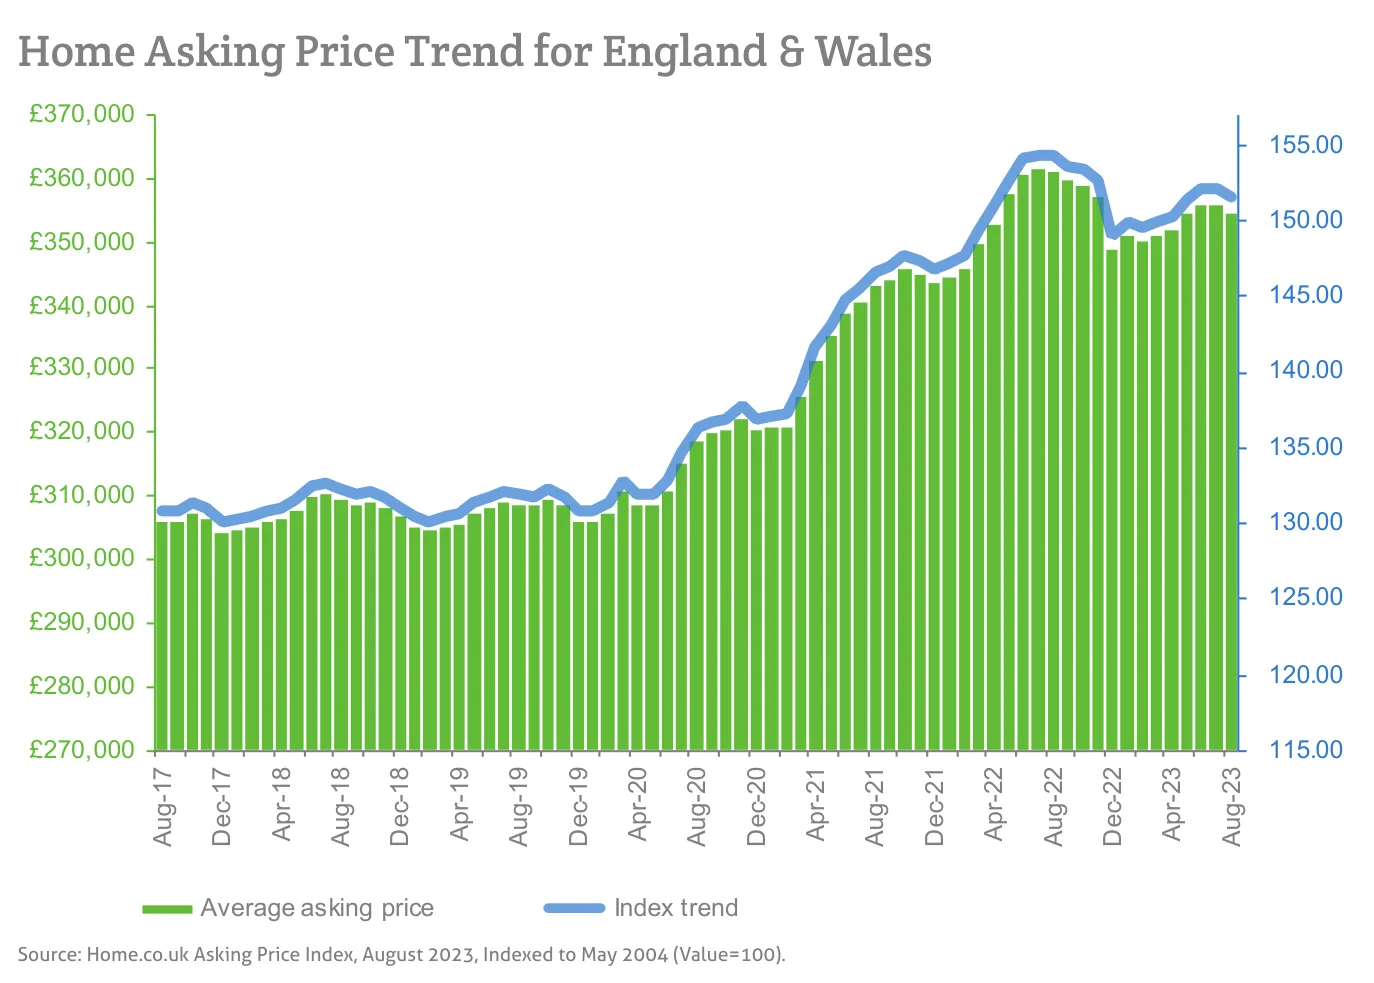
Source: Home.co.uk Asking Price Index, August 2023, Indexed to May 2004 (Value=100).
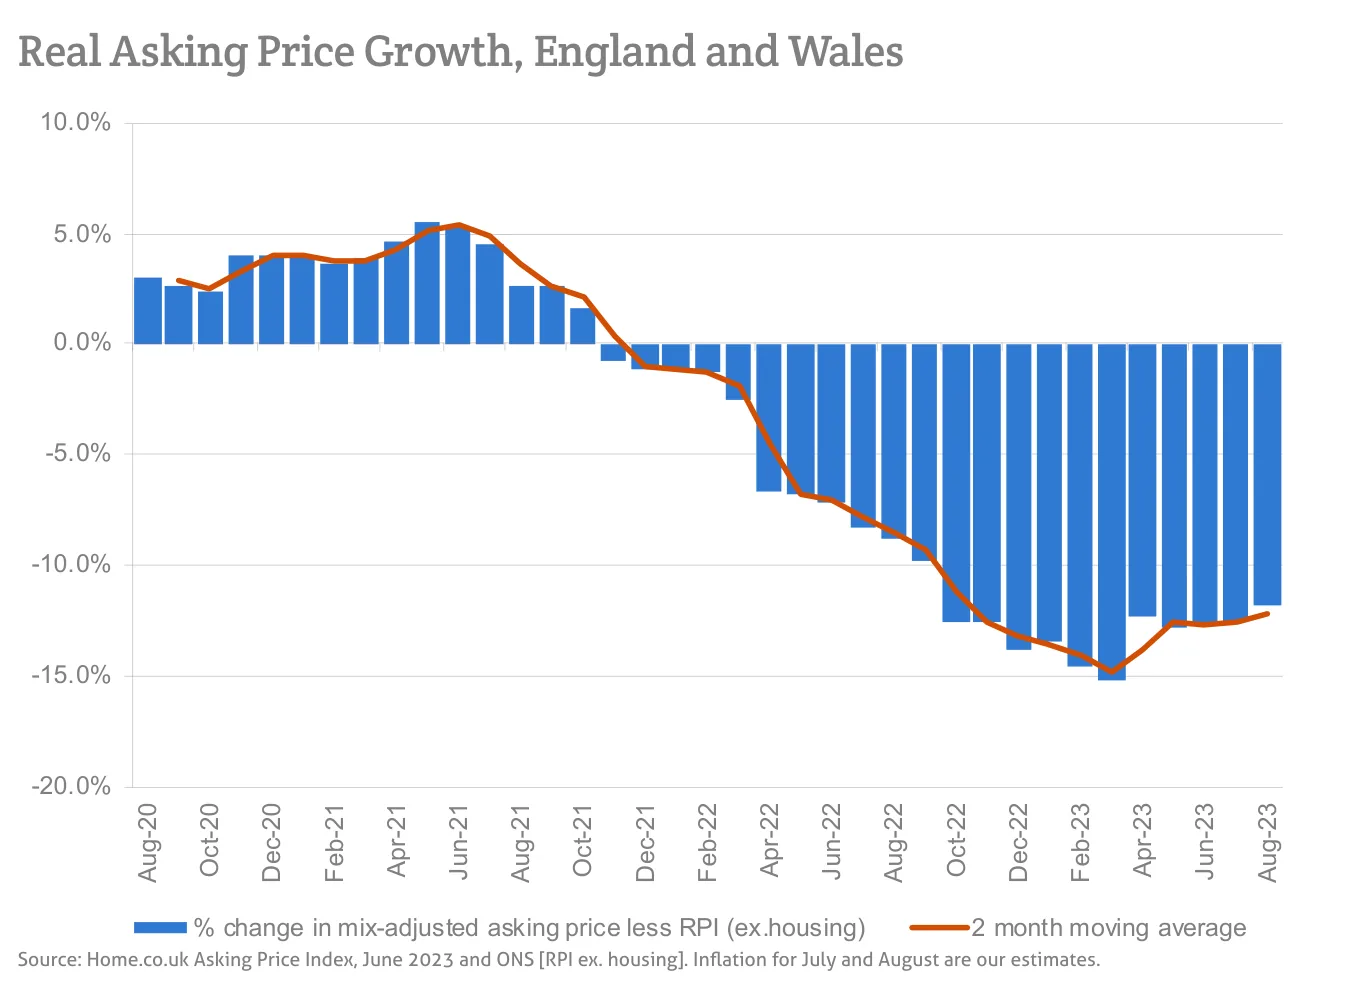
Source: Home.co.uk Asking Price Index, June 2023 and ONS [RPI ex. housing]. Inflation for July and August are our estimates.
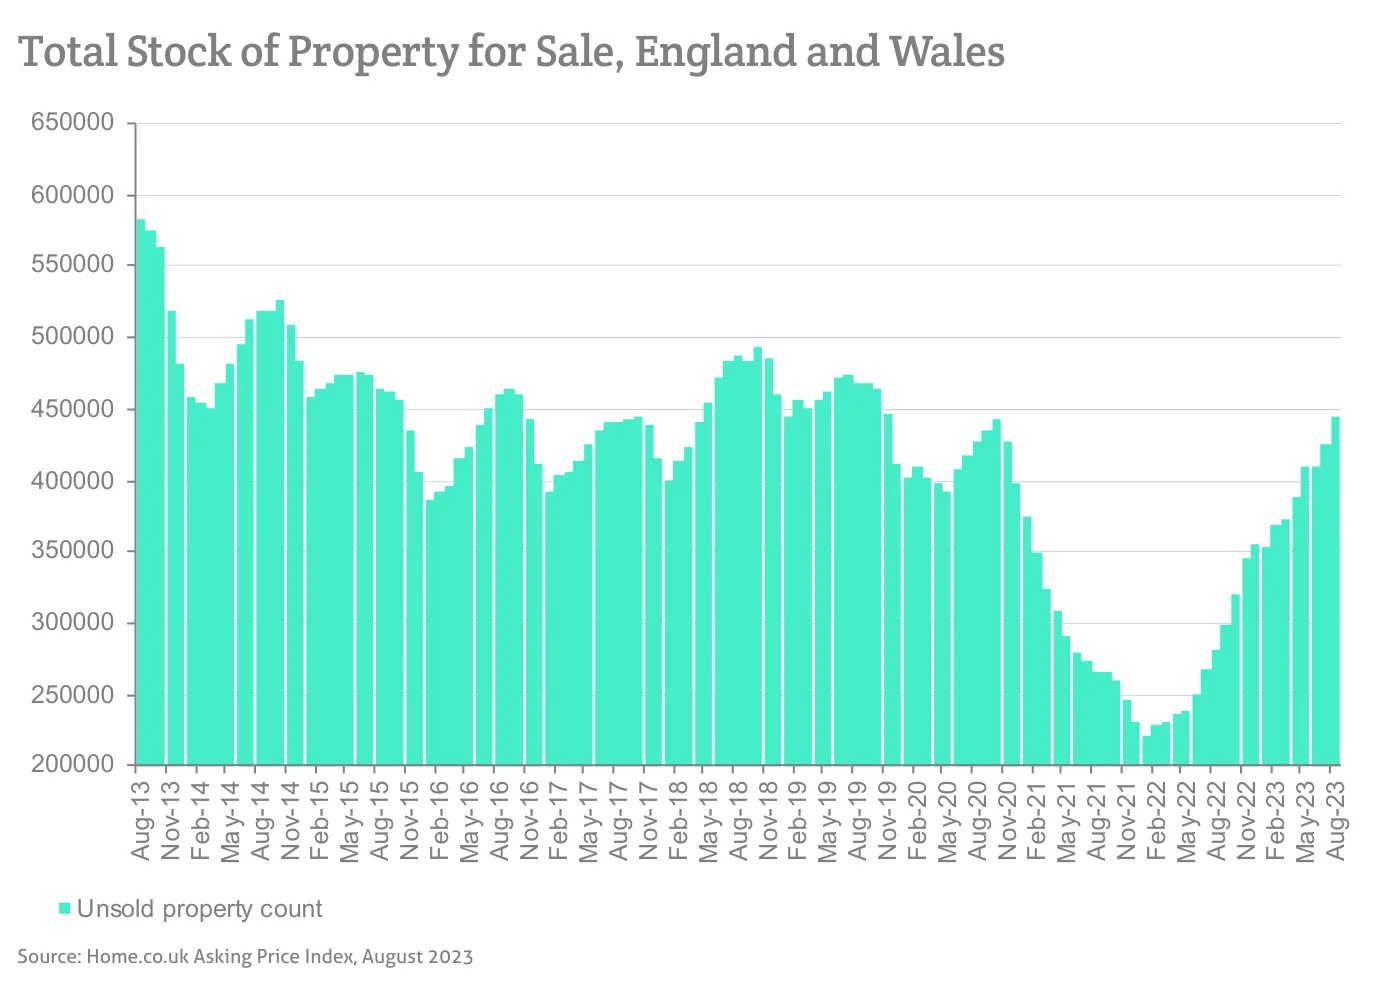
Source: Home.co.uk Asking Price Index, August 2023
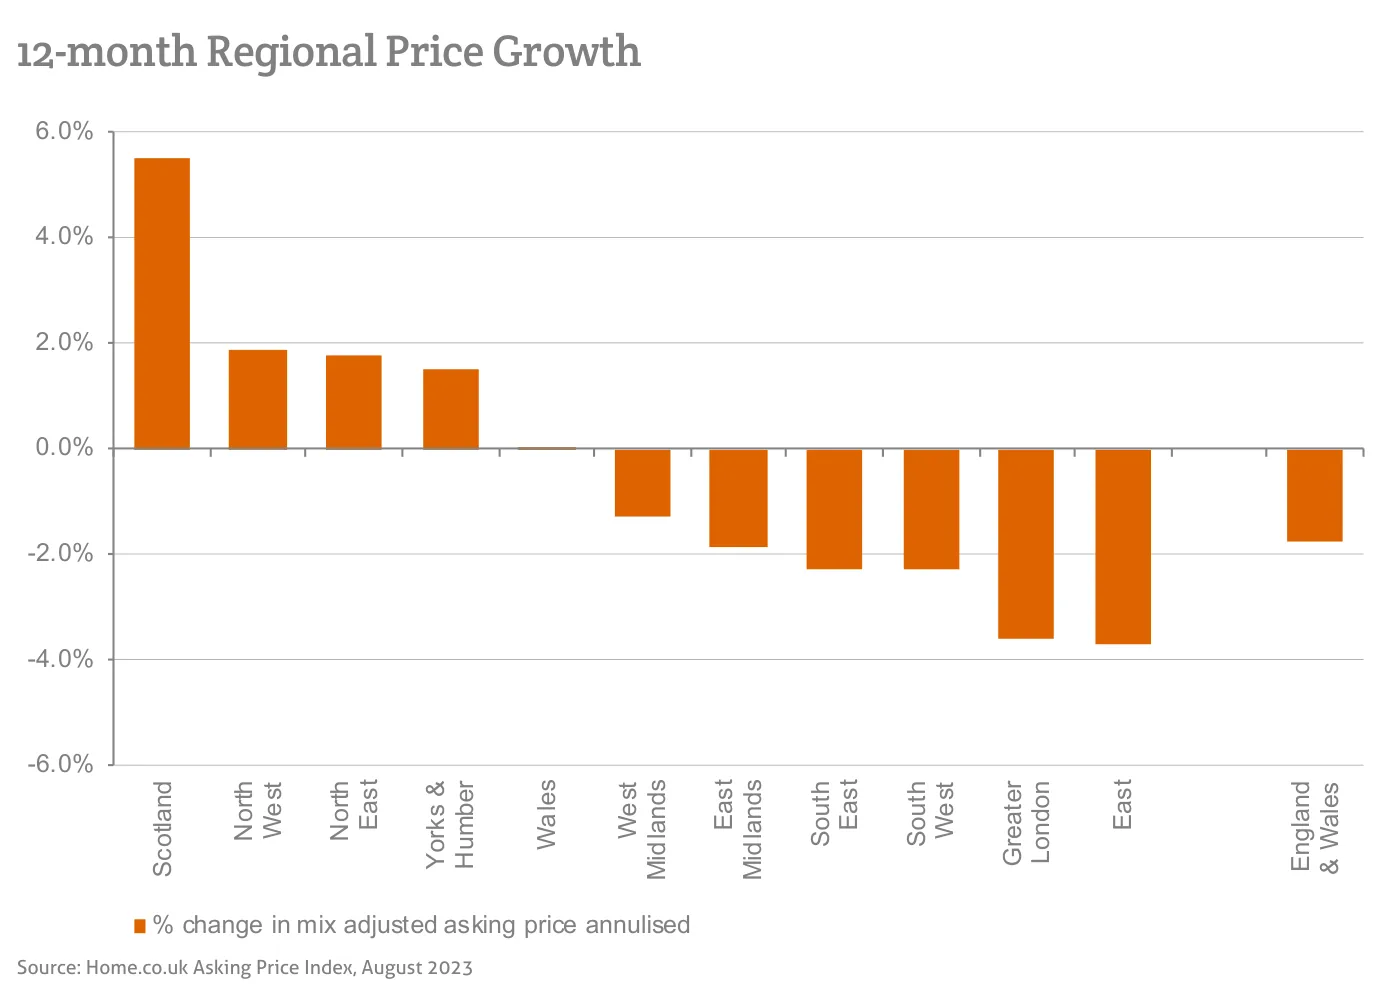
Source: Home.co.uk Asking Price Index, August 2023
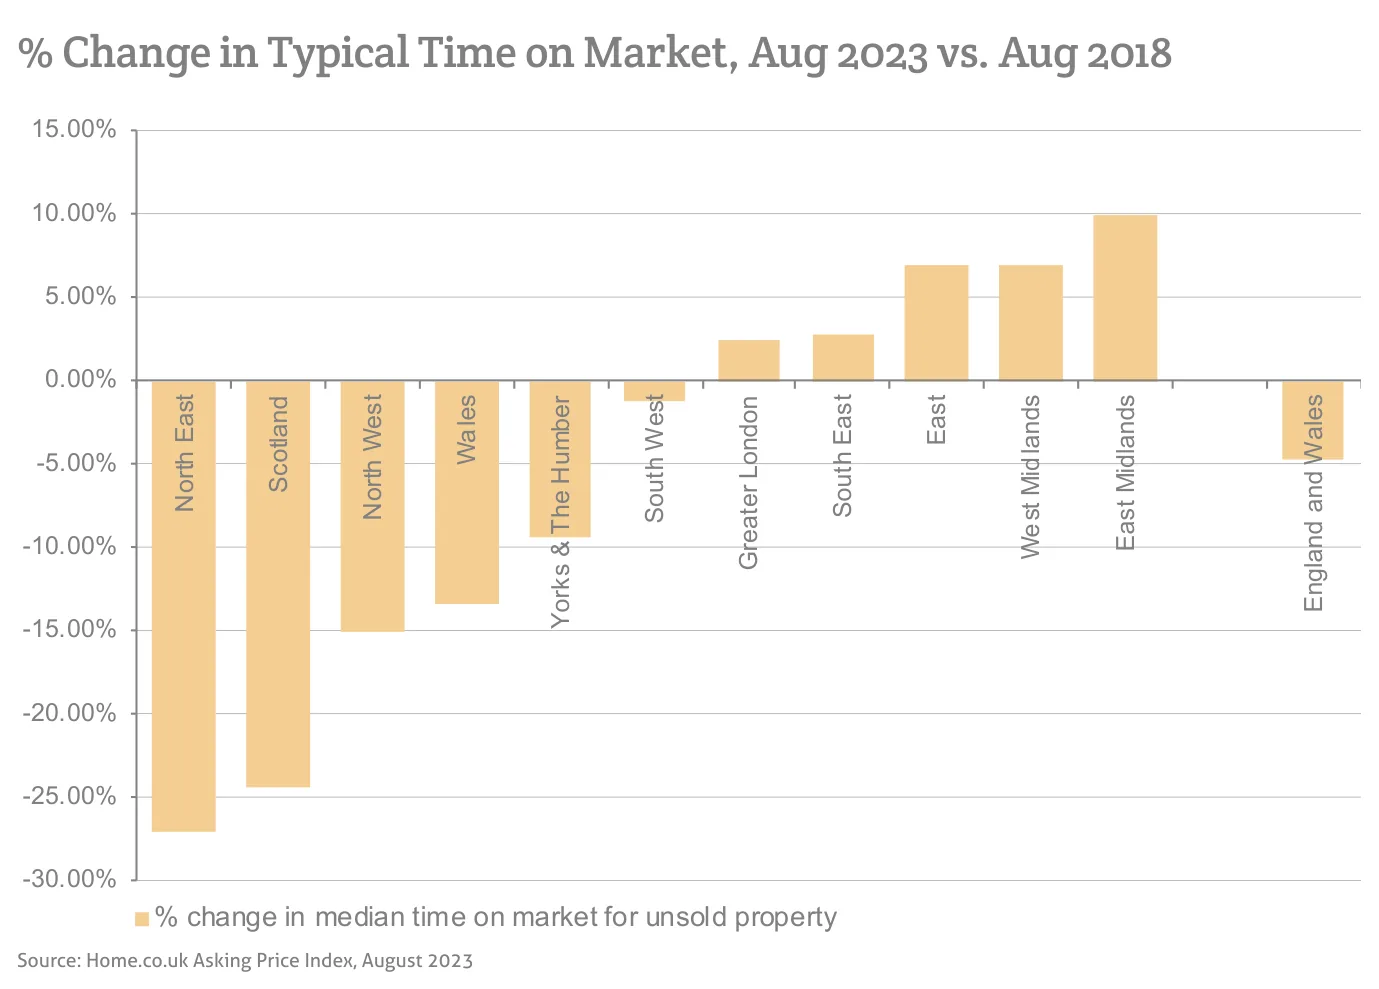
Source: Home.co.uk Asking Price Index, August 2023
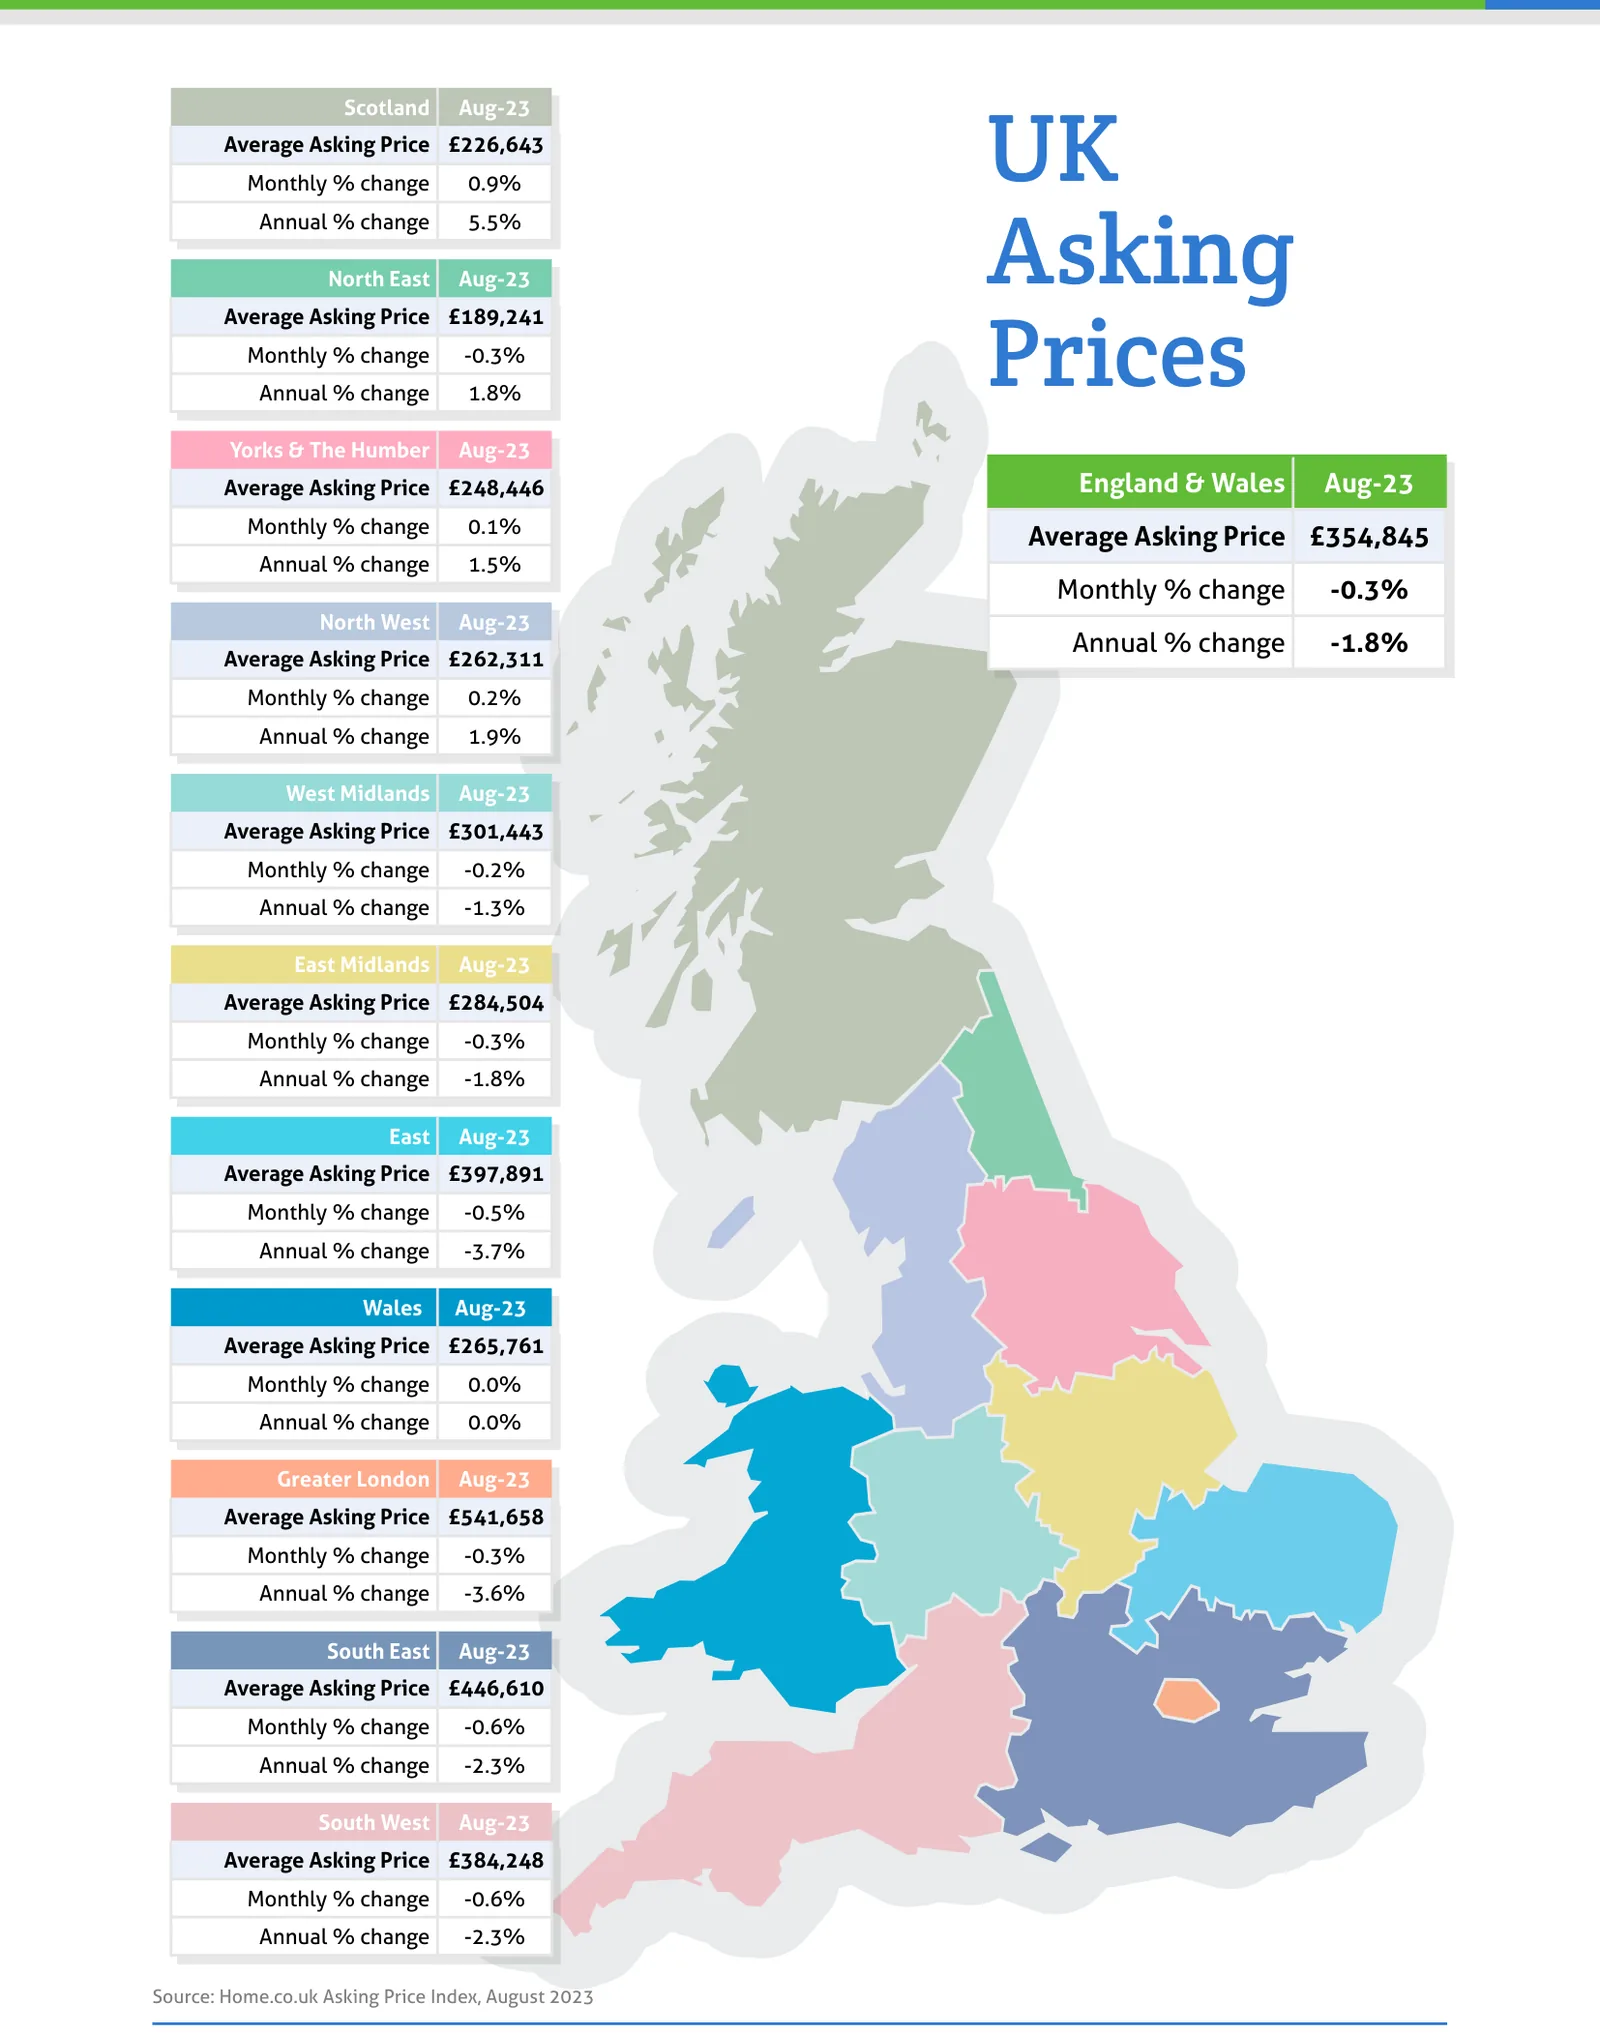
Source: Home.co.uk Asking Price Index, August 2023
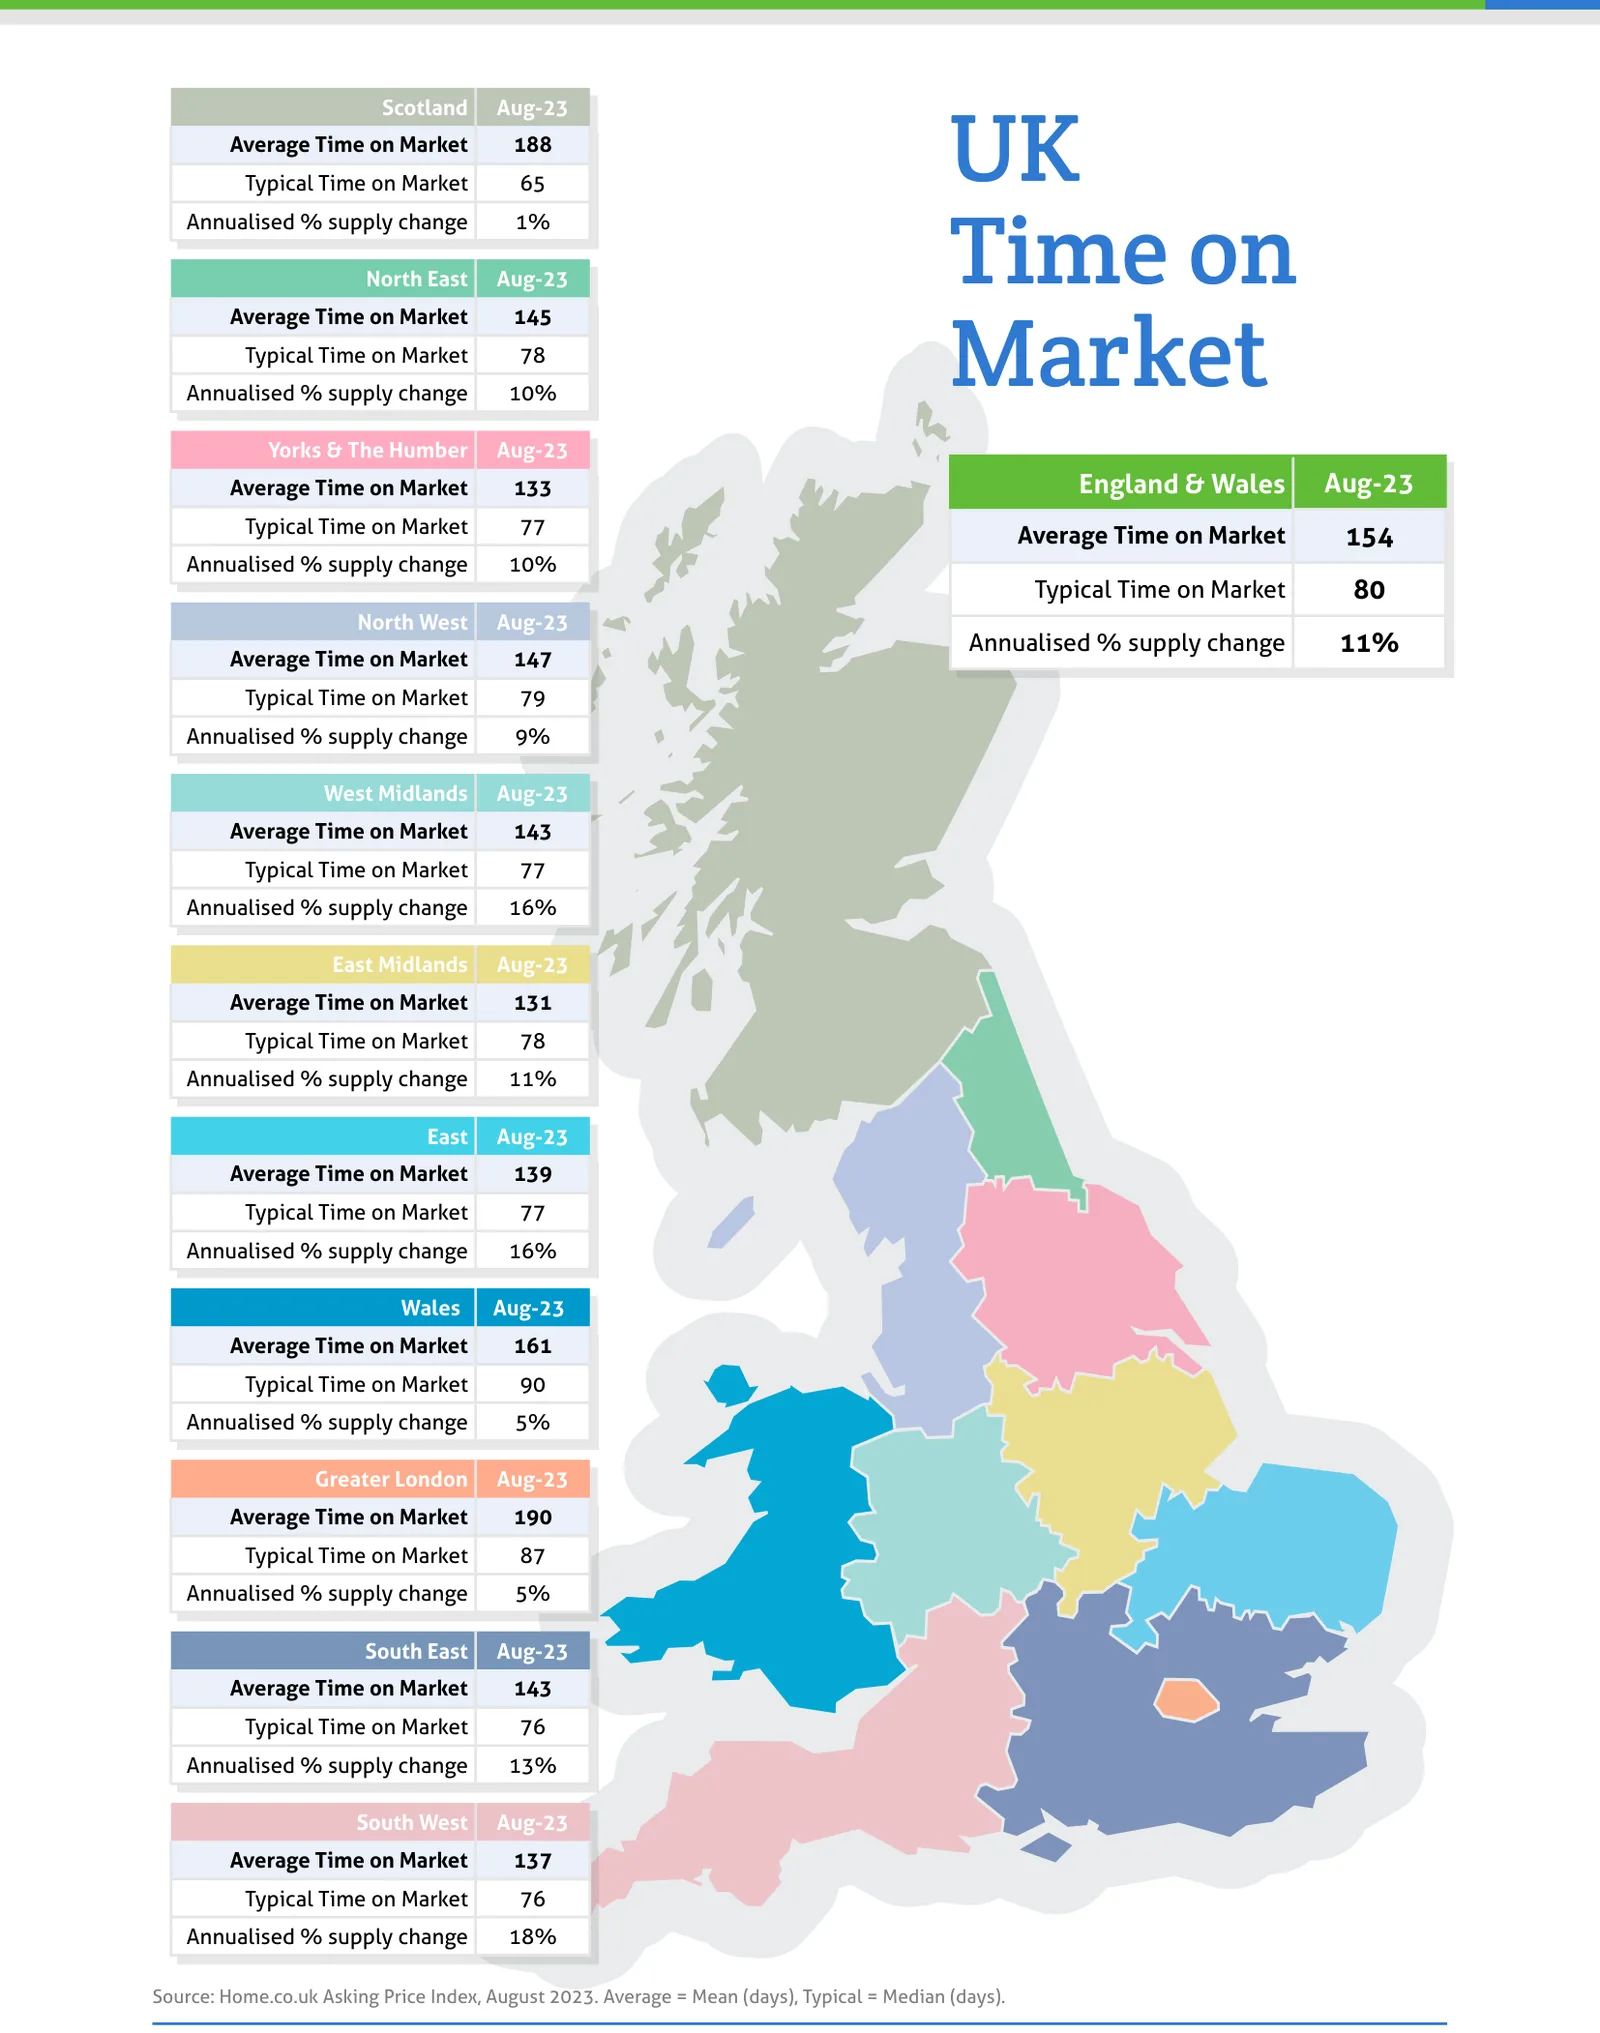
Source: Home.co.uk Asking Price Index, August 2023. Average = Mean (days), Typical = Median (days).
Regional tables
UK Asking Prices, Aug-23
| Region | Average Asking Price | Monthly % change | Annual % change |
|---|---|---|---|
| Scotland | £226,643 | 0.9% | 5.5% |
| North East | £189,241 | -0.3% | 1.8% |
| Yorks & The Humber | £248,446 | 0.1% | 1.5% |
| England & Wales | £354,845 | -0.3% | -1.8% |
| North West | £262,311 | 0.2% | 1.9% |
| West Midlands | £301,443 | -0.2% | -1.3% |
| East Midlands | £284,504 | -0.3% | -1.8% |
| East | £397,891 | -0.5% | -3.7% |
| Wales | £265,761 | 0.0% | 0.0% |
| Greater London | £541,658 | -0.3% | -3.6% |
| South East | £446,610 | -0.6% | -2.3% |
| South West | £384,248 | -0.6% | -2.3% |
UK Time on Market, Aug-23
| Region | Average Time on Market | Typical Time on Market | Annualised % supply change |
|---|---|---|---|
| Scotland | 188 | 65 | 1% |
| North East | 145 | 78 | 10% |
| Yorks & The Humber | 133 | 77 | 10% |
| England & Wales | 154 | 80 | 11% |
| North West | 147 | 79 | 9% |
| West Midlands | 143 | 77 | 16% |
| East Midlands | 131 | 78 | 11% |
| East | 139 | 77 | 16% |
| Wales | 161 | 90 | 5% |
| Greater London | 190 | 87 | 5% |
| South East | 143 | 76 | 13% |
| South West | 137 | 76 | 18% |
From the director's commentary
"I couldn't help but sigh inwardly at the news of a further hike of 25 basis points in the base rate by the Bank of England earlier this month. As Abraham Maslow said: 'If the only tool you have is a hammer, you tend to see every problem as a nail.'"
Doug Shephard, Director at Home.co.uk
Read the full August 2023 edition (PDF, 10 pages)
About the Home Asking Price Index
The Home Asking Price Index measures the change in the prices sellers ask for residential property across England, Wales and Scotland. Today it is computed every month from around half a million advertised homes and is mix-adjusted, so a change in what happens to be on the market does not move the figure; earlier editions state the sample they were built from. Because an asking price is set months before a sale completes, the index runs around five months ahead of completed-sale measures such as the UK House Price Index.
Every edition in the archive, back to October 2006, is listed on the index page. How we measure the UK property market explains the listing data behind it, and today's figures by area are on house prices and rental prices.
Text and figures above are quoted from the August 2023 edition as published, with punctuation normalised for the web, and are not revised. Later editions may restate them.
More in What is happening to house prices: the Home guide
Thinking about your next move?
See what your home's worth in seconds, with the UK's longest-running property data behind it.
Get an instant valuation