

























Home Asking Price Index, August 2021: scarcity prevails nationwide as London attracts renewed demand
Asking prices in England and Wales rose 0.8% during August 2021, while total property stock fell to a record low of 266,369 amid nationwide scarcity.

This is the August 2021 edition of the Home Asking Price Index, released on 12 August 2021, under the headline:
Scarcity Prevails Nationwide as London Attracts Renewed Demand
The headlines and summary below are the report's own words, with the key figures as it published them, followed by the report's charts and regional tables as printed.
Headlines
- The total stock of property for sale in England and Wales has dropped again to a new record low of 266,369, 37.5% lower than in August 2020 and 45.3% less than in August 2018.
- Monthly supply of new instructions also remains vastly below normal expectations across the UK (-38% compared to July 2020). The South West is worst hit by scarcity (-51%) while Greater London, until now plagued by oversupply, indicates a distinct drop in the number of new vendors (down 30% compared to July 2020).
- Supported by scarcity, asking prices across England and Wales continue to rise overall as demand overwhelms supply, adding another 0.8% since last month, although the annualised average growth has slipped to 7.6%.
- Typical Time on Market for unsold property in England and Wales has risen slightly by four days since last month to 77 days although this is the lowest August figure since 2007. The lack of new stock and market fatigue after a feverish period of buying likely explain the rise in this key metric rather than the tapering of the stamp duty holiday.
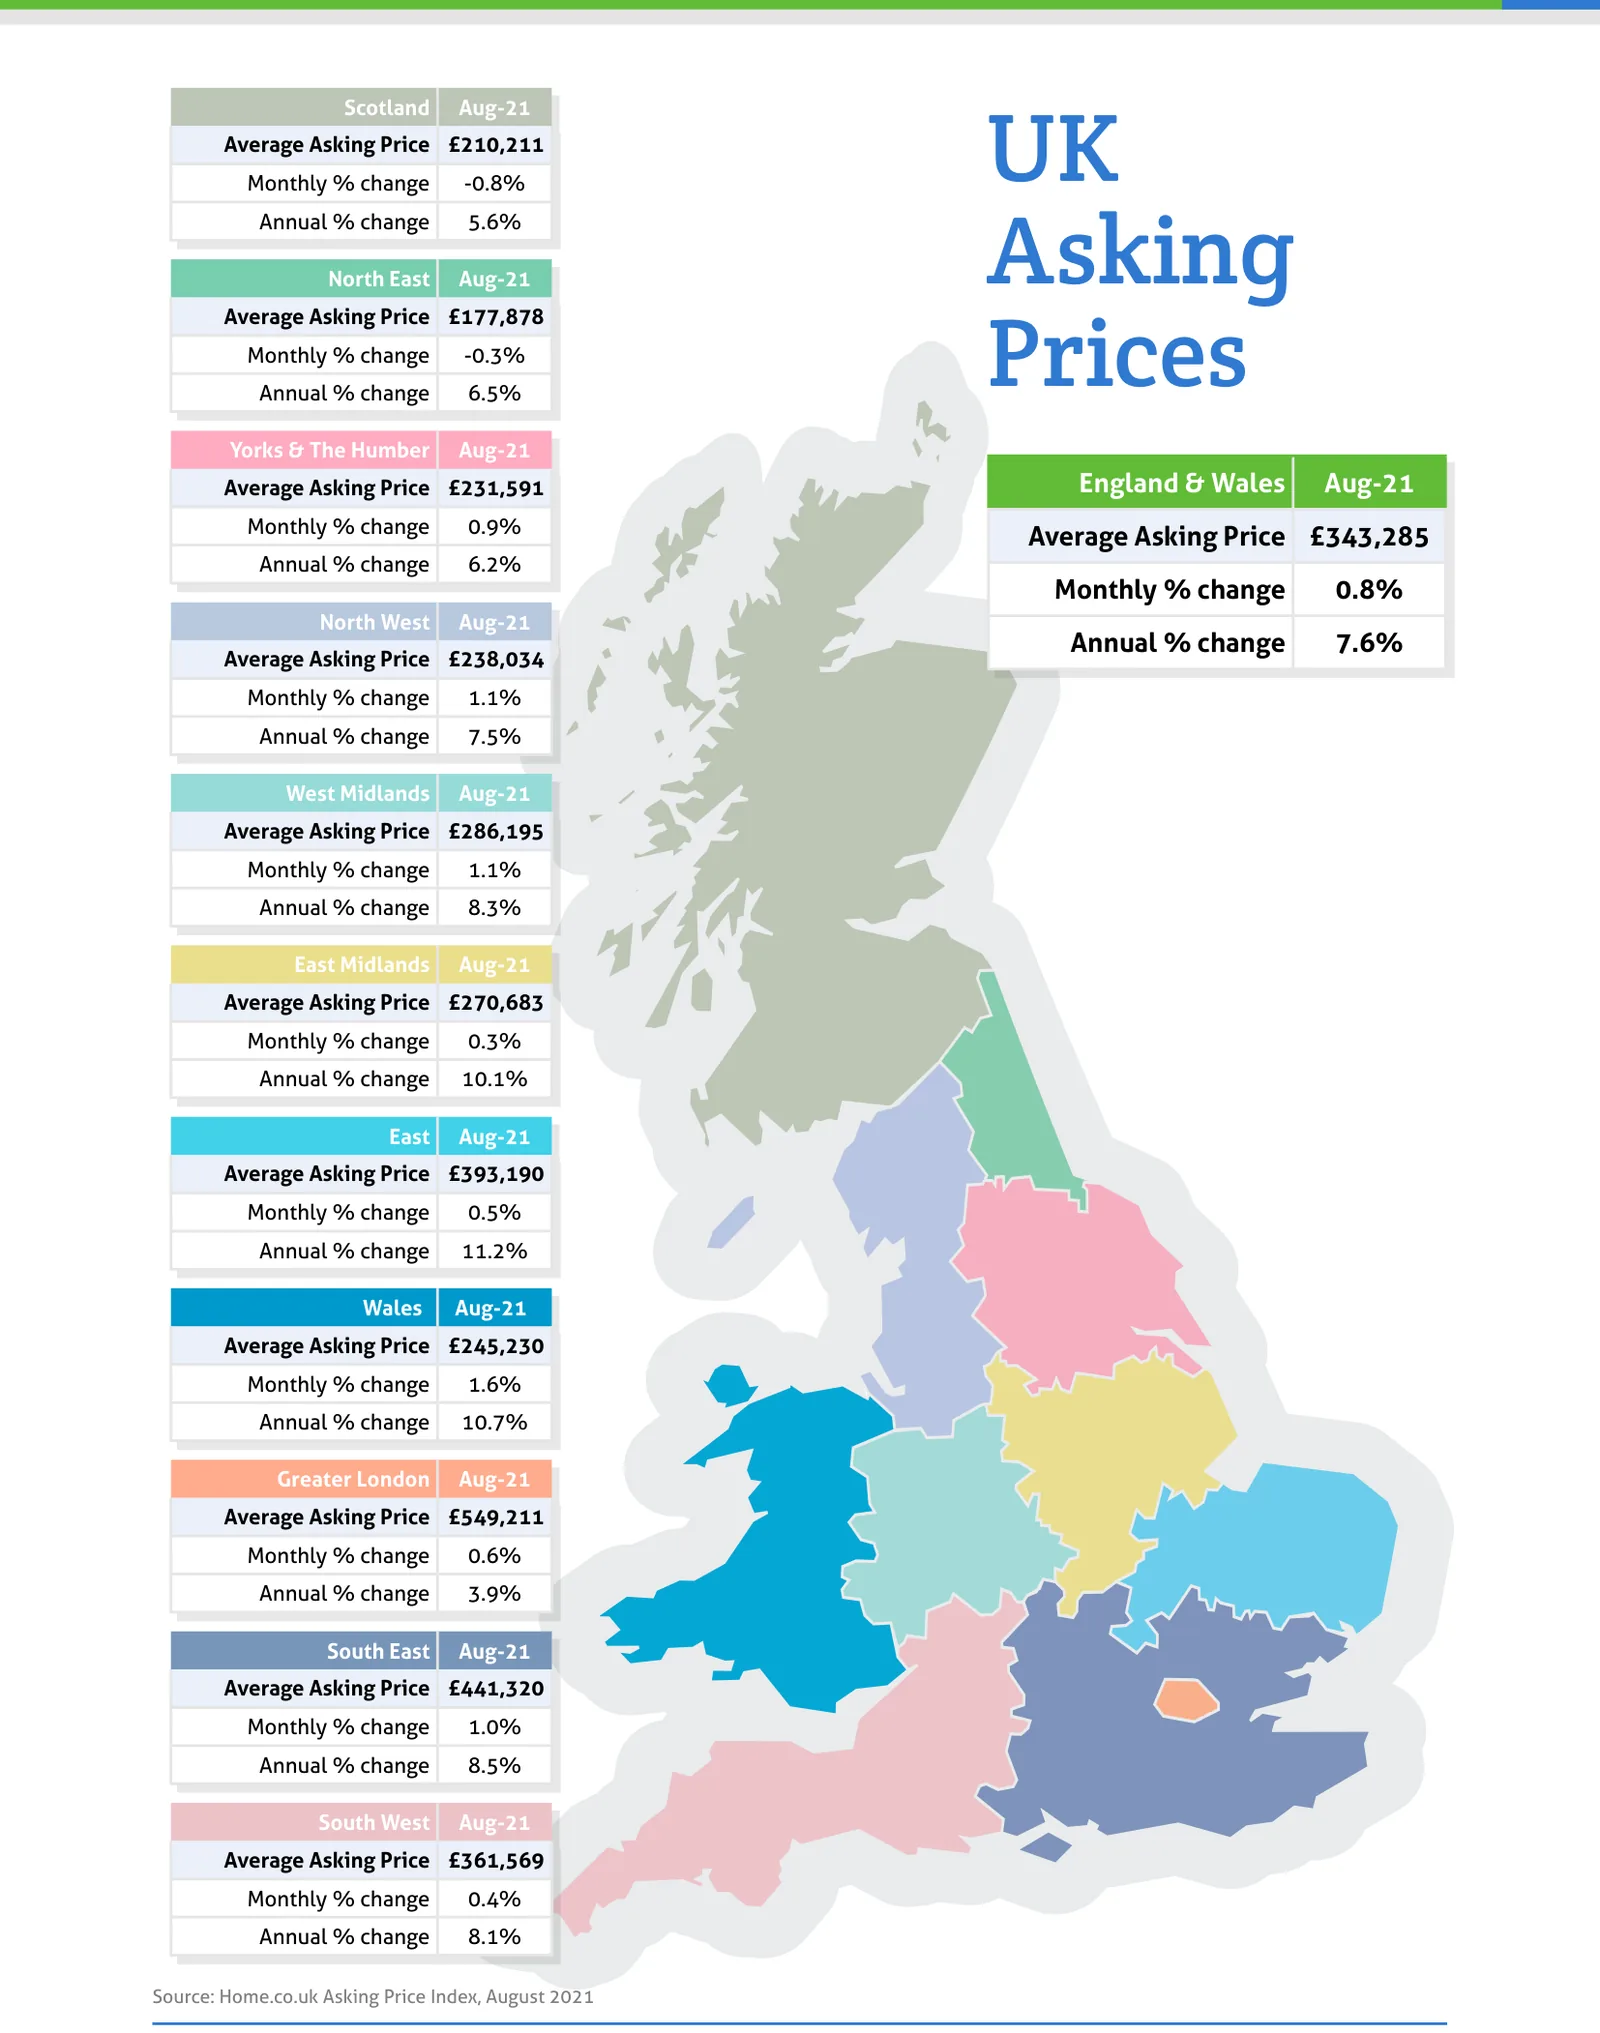
- Fierce demand has again forced up prices in every English region (except the North East) and Wales since last month, with the largest hikes in Wales (+1.6%), the North West (+1.1%) and the West Midlands (+1.1%).
- The East of England property market continues to lead the 12-month regional price growth chart with a stunning rise of 11.2%, followed closely by Wales (+10.7%).
- Greater London remains the UK's worst-performing region with 3.9% annualised growth although the trend is now upward and there are clear signals that the capital's sales market will soon surpass the previous average high registered back in May 2016.
- The sales market is now supported by rising rents in the Greater London lettings market. Annualised growth in asking rents has now firmly moved into positive territory following the COVID exodus (+3.9%). The greatest rises in asking rents over the last six months are in the City (+47.8%), Wandsworth (+22.9%), Hackney (+19.5%) and Islington (+15.5%), indicating that the wealthy are returning to city living.
- Scarcity of rental properties persists in all English regions, Scotland and Wales, further supporting record rents outside of London. Rents are up 3.7% across the UK since August 2020.
- The largest annualised average rent hikes remain in the East of England (+10.1%) and the West Midlands (+11.7%).
Summary
The total stock of property for sale continues its downward trajectory, recording another new low this month. The supply rate of new sales listings remains remarkably low across all English regions, Scotland and Wales, despite the fact that properties outside of Greater London are achieving record valuations. While still below their May 2016 peak, London prices are beginning to rise and look to be entering a new period of growth, supported by a rapidly recovering rental market especially in the more central boroughs. After an 18-month battering by the COVID pandemic, confidence is returning to the capital's property market.
Sales supply looks set to remain low until mortgage payment forbearance schemes end. When these will be fully phased out by lenders is unclear but the end of the furlough scheme on the 30th September has been confirmed by Chancellor Rishi Sunak, which may well cause an uptick in supply in both the sales and rentals markets. For the time being, rent arrears are relatively low (according to a Paragon survey), thanks in part to forbearance on the part of landlords, although job losses are feared as government assistance comes to an end for the 1.9 million furloughed workers, of whom an estimated 687,000 are renting.
Key figures
| Measure | Figure |
|---|---|
| Total stock of property for sale (England and Wales) | 266,369 |
| Annual change in stock (England and Wales) | -37.5% |
| Monthly supply of new instructions (UK) | -38% |
| Monthly change in asking prices (England and Wales) | +0.8% |
| Annual change in asking prices (England and Wales) | +7.6% |
| Typical Time on Market (England and Wales) | 77 days |
| Annual change in asking rents (UK) | +3.7% |
Figures are for England and Wales unless the report states otherwise, as published in the edition.
Charts from the report
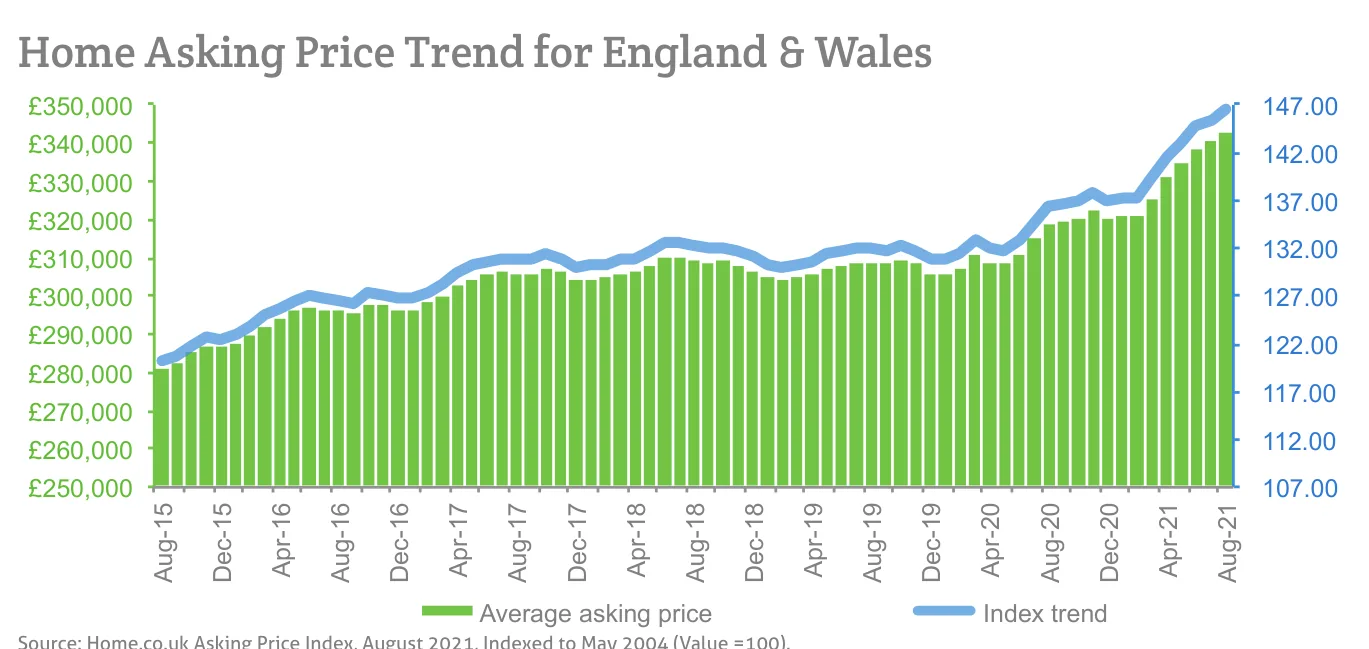
Source: Home.co.uk Asking Price Index, August 2021, Indexed to May 2004 (Value =100).
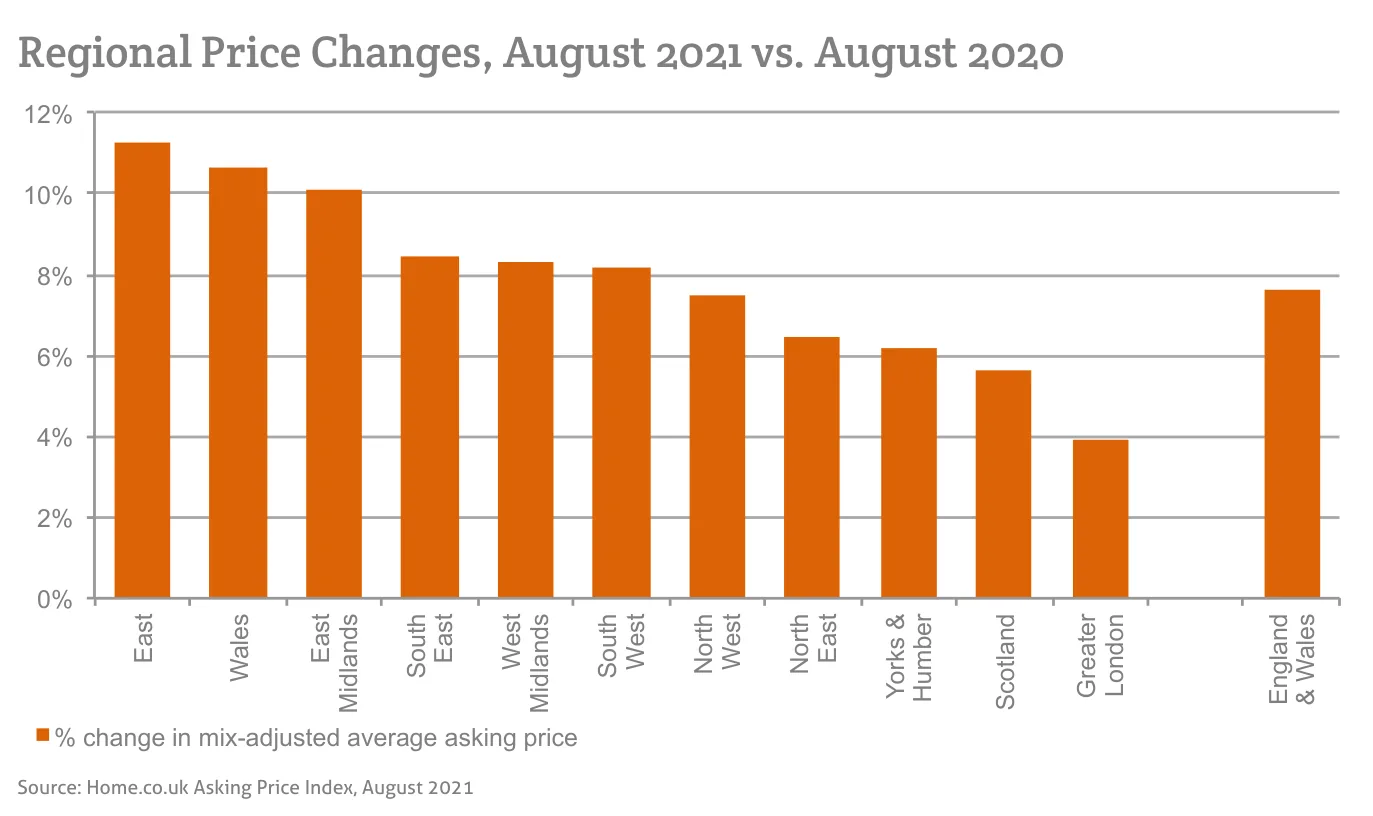
Source: Home.co.uk Asking Price Index, August 2021
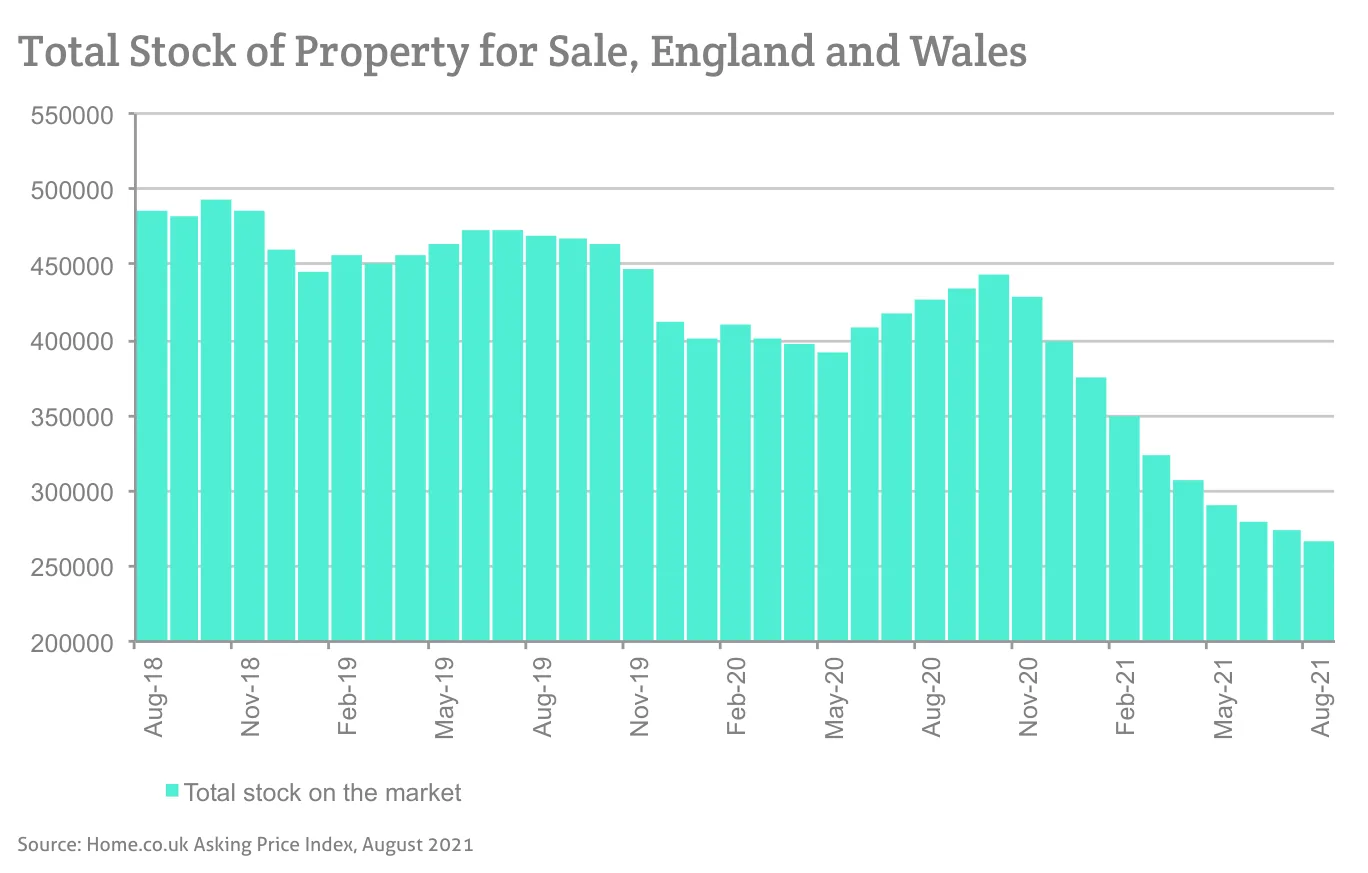
Source: Home.co.uk Asking Price Index, August 2021
Source: Home.co.uk Asking Price Index, August 2021
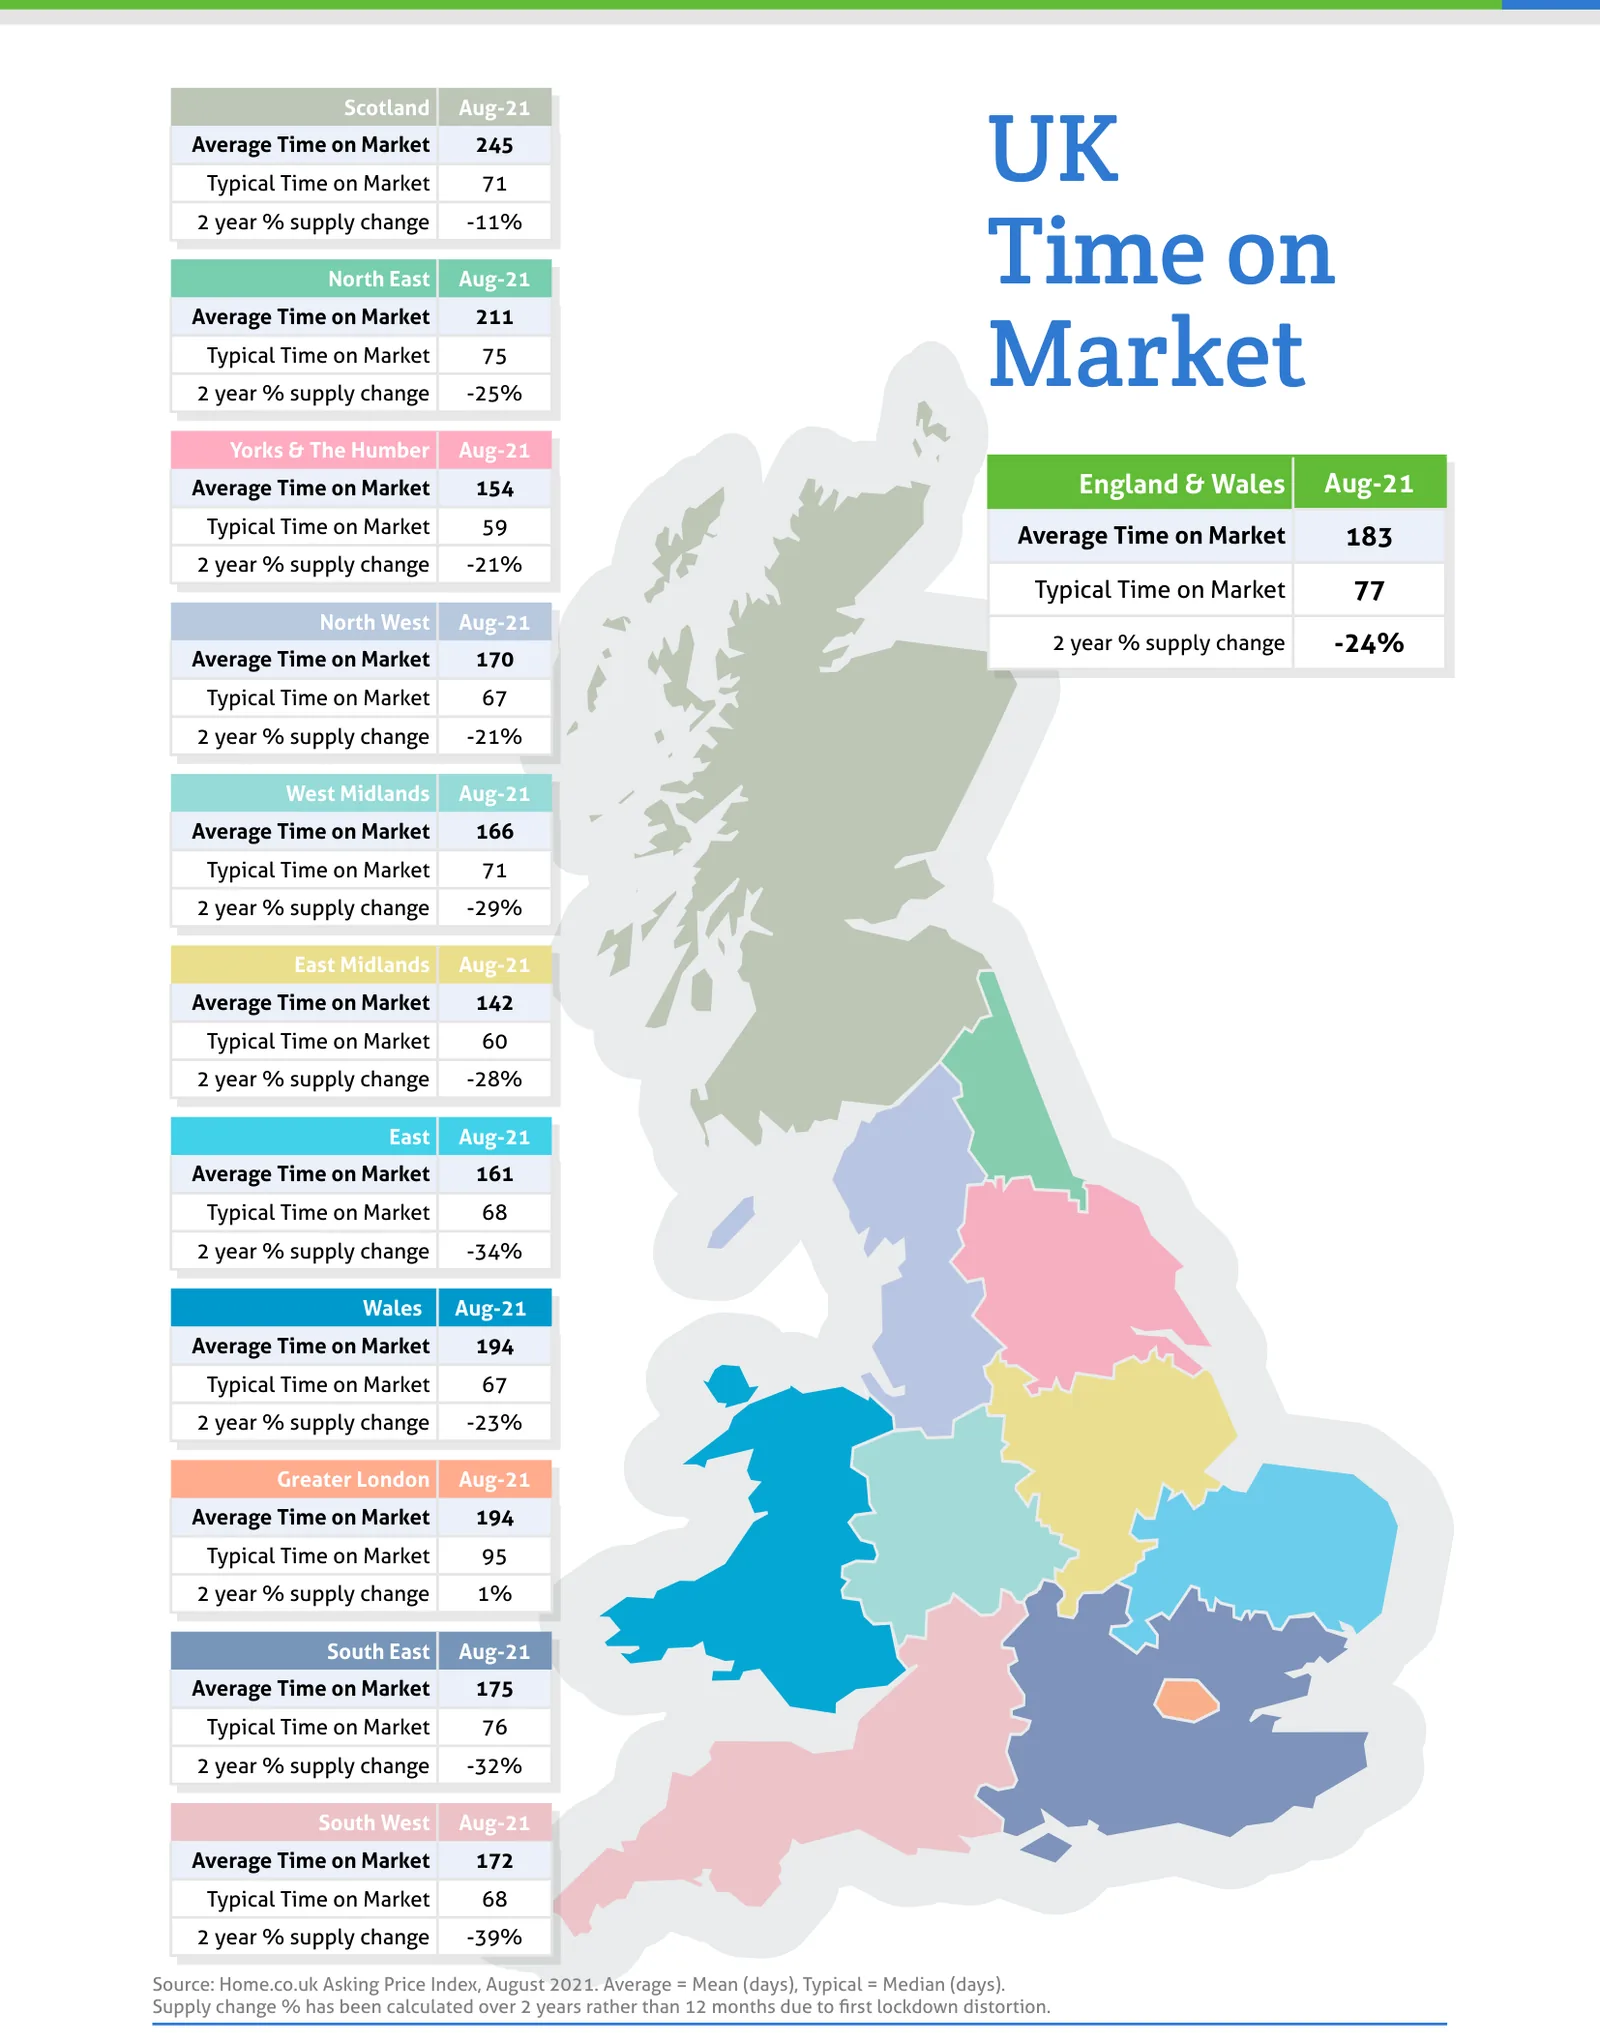
Source: Home.co.uk Asking Price Index, August 2021. Average = Mean (days), Typical = Median (days).
Regional tables
UK Asking Prices, Aug-21
| Region | Average Asking Price | Monthly % change | Annual % change |
|---|---|---|---|
| Scotland | £210,211 | -0.8% | 5.6% |
| North East | £177,878 | -0.3% | 6.5% |
| Yorks & The Humber | £231,591 | 0.9% | 6.2% |
| England & Wales | £343,285 | 0.8% | 7.6% |
| North West | £238,034 | 1.1% | 7.5% |
| West Midlands | £286,195 | 1.1% | 8.3% |
| East Midlands | £270,683 | 0.3% | 10.1% |
| East | £393,190 | 0.5% | 11.2% |
| Wales | £245,230 | 1.6% | 10.7% |
| Greater London | £549,211 | 0.6% | 3.9% |
| South East | £441,320 | 1.0% | 8.5% |
| South West | £361,569 | 0.4% | 8.1% |
UK Time on Market, Aug-21
| Region | Average Time on Market | Typical Time on Market | 2 year % supply change |
|---|---|---|---|
| Scotland | 245 | 71 | -11% |
| North East | 211 | 75 | -25% |
| Yorks & The Humber | 154 | 59 | -21% |
| England & Wales | 183 | 77 | -24% |
| North West | 170 | 67 | -21% |
| West Midlands | 166 | 71 | -29% |
| East Midlands | 142 | 60 | -28% |
| East | 161 | 68 | -34% |
| Wales | 194 | 67 | -23% |
| Greater London | 194 | 95 | 1% |
| South East | 175 | 76 | -32% |
| South West | 172 | 68 | -39% |
From the director's commentary
"Prices are up again but, as we established last month, mortgage forbearance and the furlough scheme have essentially disconnected the housing market from the economic woes of the coronavirus pandemic."
Doug Shephard, Director at Home.co.uk
Read the full August 2021 edition (PDF, 7 pages)
About the Home Asking Price Index
The Home Asking Price Index measures the change in the prices sellers ask for residential property across England, Wales and Scotland. Today it is computed every month from around half a million advertised homes and is mix-adjusted, so a change in what happens to be on the market does not move the figure; earlier editions state the sample they were built from. Because an asking price is set months before a sale completes, the index runs around five months ahead of completed-sale measures such as the UK House Price Index.
Every edition in the archive, back to October 2006, is listed on the index page. How we measure the UK property market explains the listing data behind it, and today's figures by area are on house prices and rental prices.
Text and figures above are quoted from the August 2021 edition as published, with punctuation normalised for the web, and are not revised. Later editions may restate them.
More in What is happening to house prices: the Home guide
Thinking about your next move?
See what your home's worth in seconds, with the UK's longest-running property data behind it.
Get an instant valuation