

























Home Asking Price Index, August 2014: rising supply puts the brakes on price rises
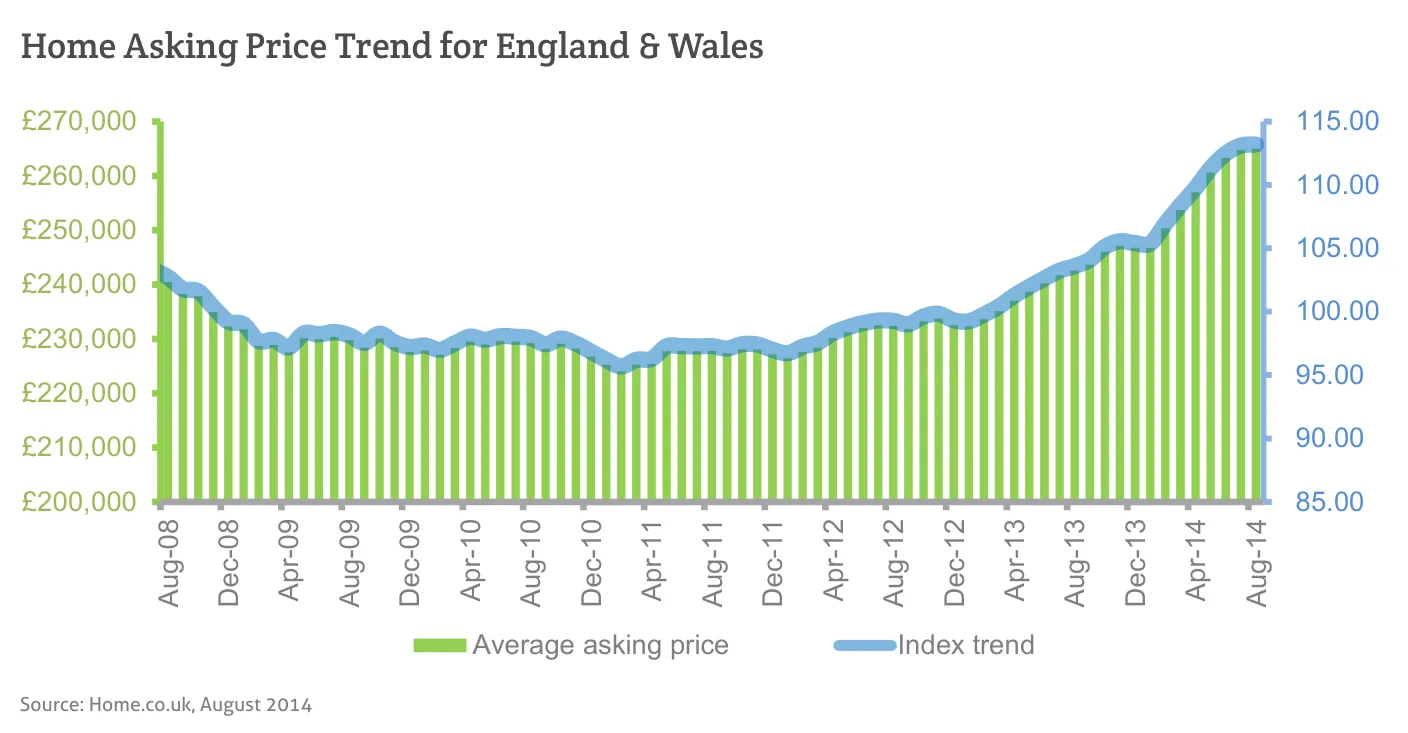
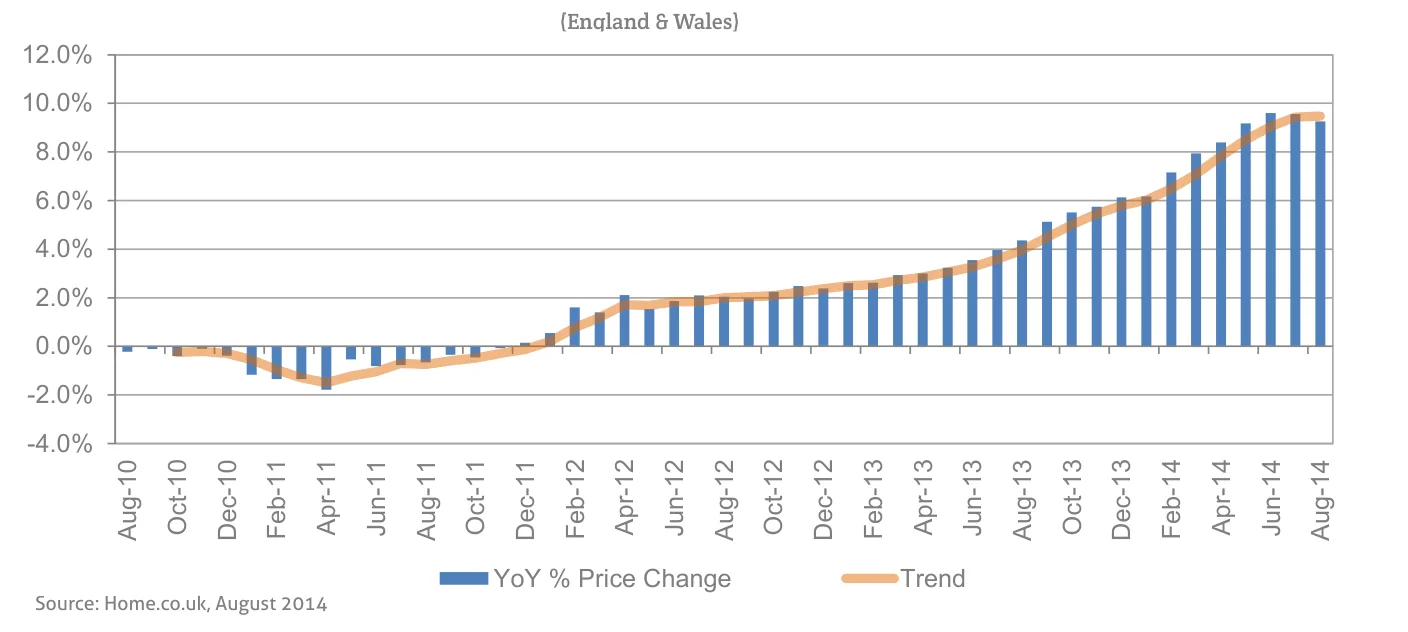
Asking prices in England and Wales rose only 0.1% in August as rising supply cooled the market, with annual growth easing to 9.3%.

This is the August 2014 edition of the Home Asking Price Index, released on 13 August 2014, under the headline:
Rising Supply Puts the Brakes on Price Rises
The headlines and summary below are the report's own words, with the key figures as it published them, followed by the report's charts and regional tables as printed.
Headlines
- Asking prices rise for a seventh consecutive month (albeit by just 0.1%), making the average annual appreciation for England and Wales fall 0.3% to 9.3%.
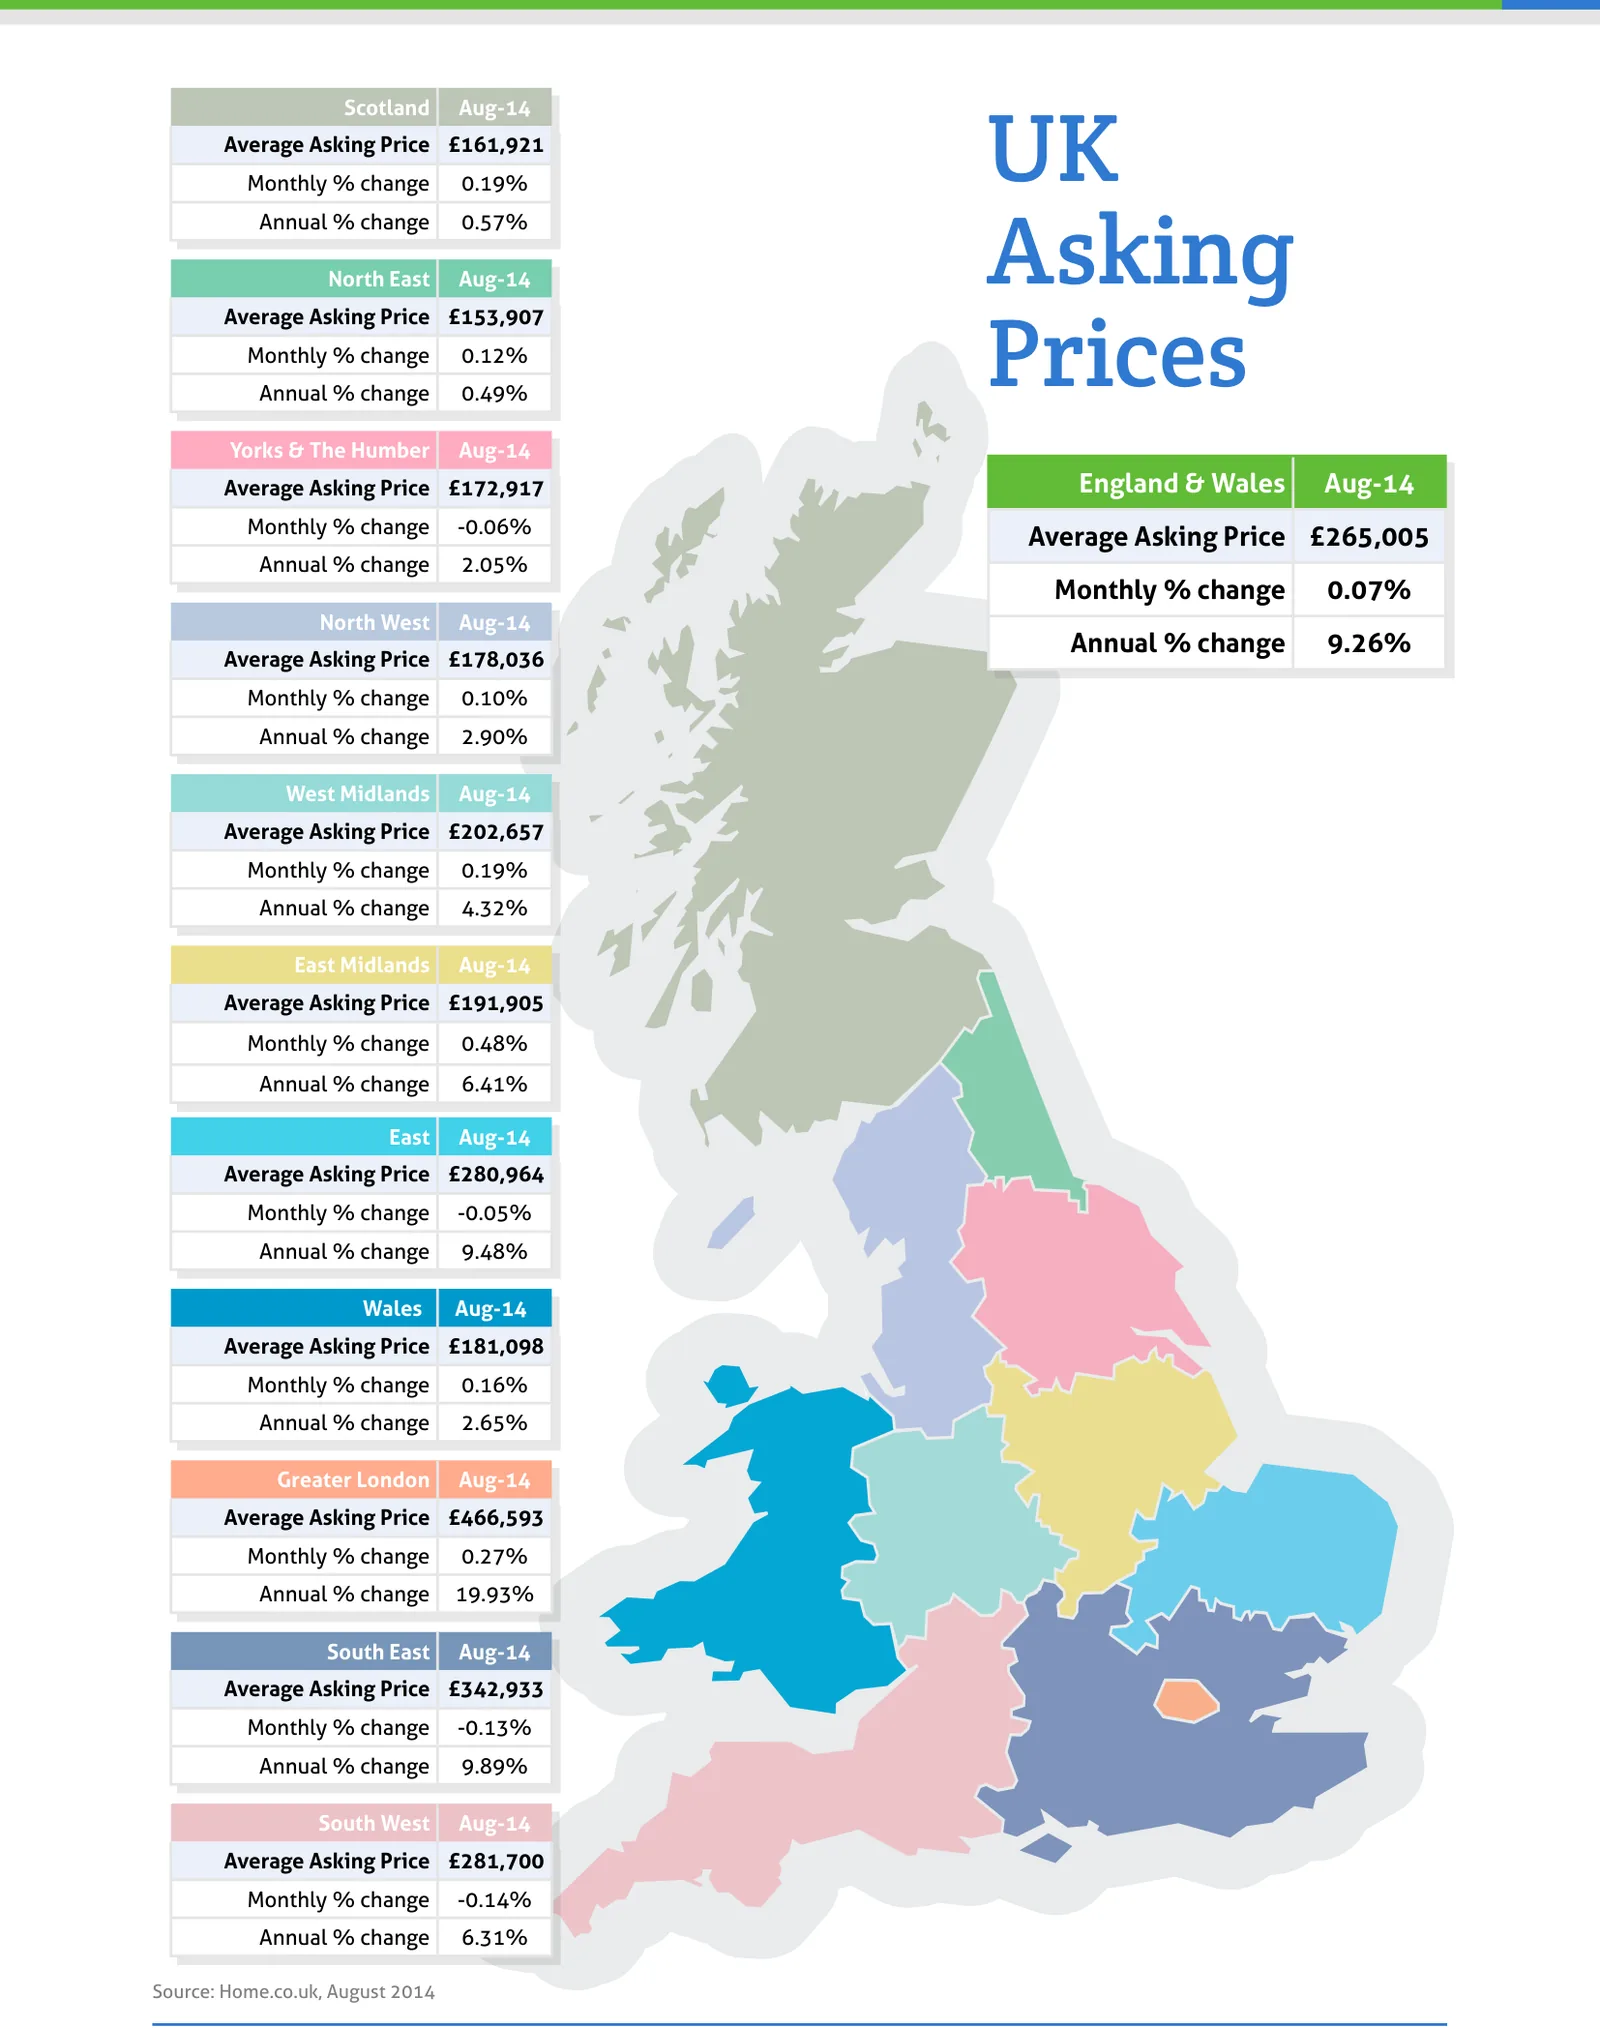
- Home prices actually dipped during the last month in the South East, South West, East Anglia and Yorkshire.
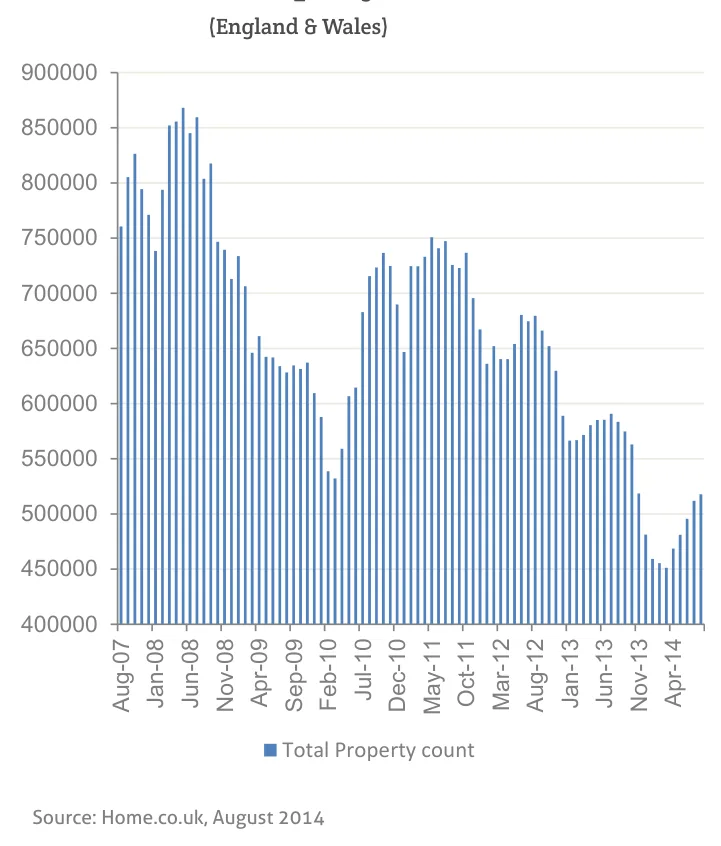
- The market dynamic is changing as the supply of property for sale rose last month in all regions except East Anglia and the South West.
- Supply of property for sale in Greater London up by 39% vs. July last year.
- Typical time on market across England and Wales unchanged at 90 days.
Summary
The property market across the UK shows signs of cooling as price rises slow down in response to rising supply. The average asking price for a flat has actually dipped slightly since July to £161,956, ending a 14-month rally. Less affected by supply issues, detached, semi and terraced properties continue to rise for the time being. Moreover, home prices actually dipped during the last month in the relatively strong regional markets of the South East, South West, East Anglia and Yorkshire for the first time this year (by just 0.1% overall), and this is further evidence of a cooling market. Greater London posted a more muted month-on-month price rise of 0.3%. Price rises in other English regions, Scotland and Wales since July were all similarly modest (0.2% or less), with the exception of the East Midlands which jumped 0.5%.
Key figures
| Measure | Figure |
|---|---|
| Average asking price (England & Wales) | £265,005 |
| Monthly change (England & Wales) | 0.07% |
| Annual change (England & Wales) | 9.26% |
| Typical time on market | 90 days |
| Average asking price for a flat | £161,956 |
| Supply increase (UK, 12 months) | 6% |
Figures are for England and Wales unless the report states otherwise, as published in the edition.
Charts from the report
Source: Home.co.uk, August 2014
Source: Home.co.uk, August 2014
Source: Home.co.uk, August 2014
Source: Home.co.uk, August 2014
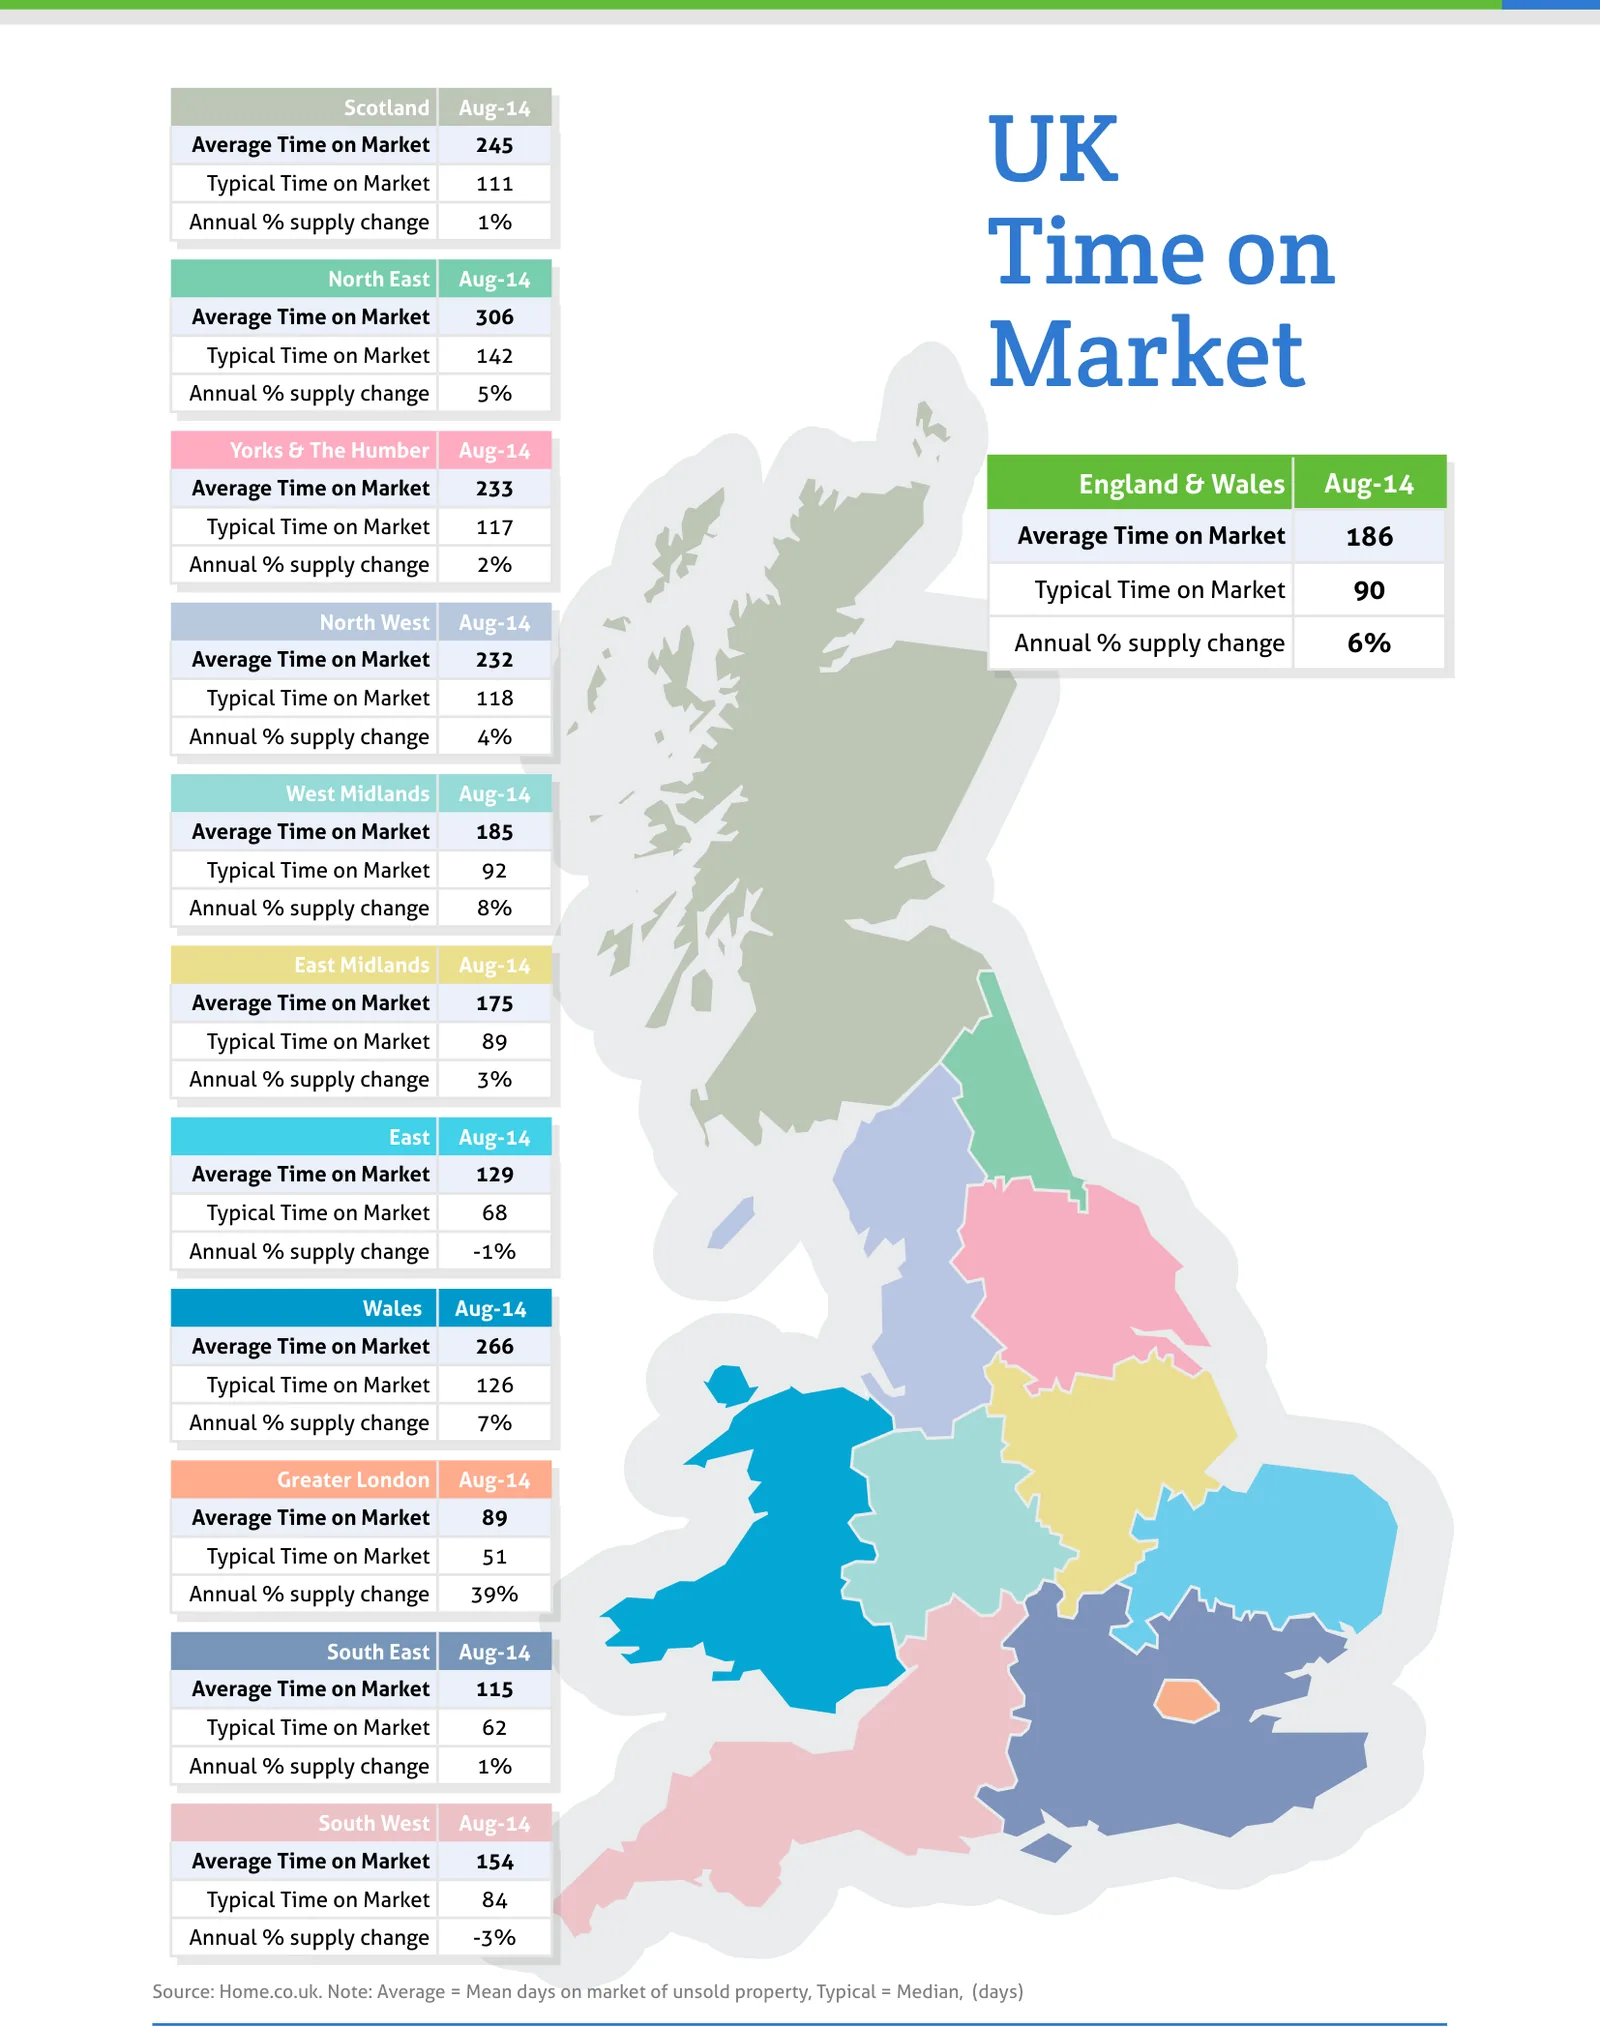
Source: Home.co.uk. Note: Average = Mean days on market of unsold property, Typical = Median, (days)
Regional tables
UK Asking Prices, Aug-14
| Region | Average Asking Price | Monthly % change | Annual % change |
|---|---|---|---|
| Scotland | £161,921 | 0.19% | 0.57% |
| North East | £153,907 | 0.12% | 0.49% |
| Yorks & The Humber | £172,917 | -0.06% | 2.05% |
| England & Wales | £265,005 | 0.07% | 9.26% |
| North West | £178,036 | 0.10% | 2.90% |
| West Midlands | £202,657 | 0.19% | 4.32% |
| East Midlands | £191,905 | 0.48% | 6.41% |
| East | £280,964 | -0.05% | 9.48% |
| Wales | £181,098 | 0.16% | 2.65% |
| Greater London | £466,593 | 0.27% | 19.93% |
| South East | £342,933 | -0.13% | 9.89% |
| South West | £281,700 | -0.14% | 6.31% |
UK Time on Market, Aug-14
| Region | Average Time on Market | Typical Time on Market | Annual % supply change |
|---|---|---|---|
| Scotland | 245 | 111 | 1% |
| North East | 306 | 142 | 5% |
| Yorks & The Humber | 233 | 117 | 2% |
| England & Wales | 186 | 90 | 6% |
| North West | 232 | 118 | 4% |
| West Midlands | 185 | 92 | 8% |
| East Midlands | 175 | 89 | 3% |
| East | 129 | 68 | -1% |
| Wales | 266 | 126 | 7% |
| Greater London | 89 | 51 | 39% |
| South East | 115 | 62 | 1% |
| South West | 154 | 84 | -3% |
From the director's commentary
"If we look at the wider supply-demand dynamics across the whole country, it is clear that buyer demand is certainly lower than it was before the financial crisis of 2007, but supply remains very low indeed. Such modest increases, from what is a record low level, are hardly likely to cause a crash any time soon, but they will help tame price rises and that will both help stabilise the market and be welcome news for aspirant buyers."
Doug Shephard, Director at Home.co.uk
Read the full August 2014 edition (PDF, 6 pages)
About the Home Asking Price Index
The Home Asking Price Index measures the change in the prices sellers ask for residential property across England, Wales and Scotland. Today it is computed every month from around half a million advertised homes and is mix-adjusted, so a change in what happens to be on the market does not move the figure; earlier editions state the sample they were built from. Because an asking price is set months before a sale completes, the index runs around five months ahead of completed-sale measures such as the UK House Price Index.
Every edition in the archive, back to October 2006, is listed on the index page. How we measure the UK property market explains the listing data behind it, and today's figures by area are on house prices and rental prices.
Text and figures above are quoted from the August 2014 edition as published, with punctuation normalised for the web, and are not revised. Later editions may restate them.
More in What is happening to house prices: the Home guide
Thinking about your next move?
See what your home's worth in seconds, with the UK's longest-running property data behind it.
Get an instant valuation