

























Home Asking Price Index, April 2025: home prices up in all regions except London due to oversupply
Asking prices rose 0.5% across England and Wales in March, gaining in every region except London, while annual growth stayed at just 1.4%.
This is the April 2025 edition of the Home Asking Price Index, released on 16 April 2025, under the headline:
Home Prices Up in All Regions Except London Due to Oversupply
The headlines and summary below are the report's own words, with the key figures as it published them, followed by the report's charts and regional tables as printed.
Headlines
- Asking prices rose in every English region (except Greater London), Scotland and Wales during March, making the national average rise by a further 0.5%. Such rises are typical for the time of year, so the slip in London prices attests to the level of oversupply.
- Overall, annualised home price growth across England and Wales remains well below the level of inflation at just 1.4% overall.
- Supply of new sales properties entering the market during March 2025 remains moderate in most areas except for London, the South West and Wales.
- The largest March price hikes are in Scotland, Wales and the East Midlands, posting month-on-month gains of 1.3%, 1.0% and 0.9% respectively.
- Scotland overtakes Yorkshire to become the top regional property market growth leader with an impressive year-on-year gain of 5.0%. Meanwhile, the South East retains its position as the worst regional performer with an abysmal annualised gain of 0.2%.
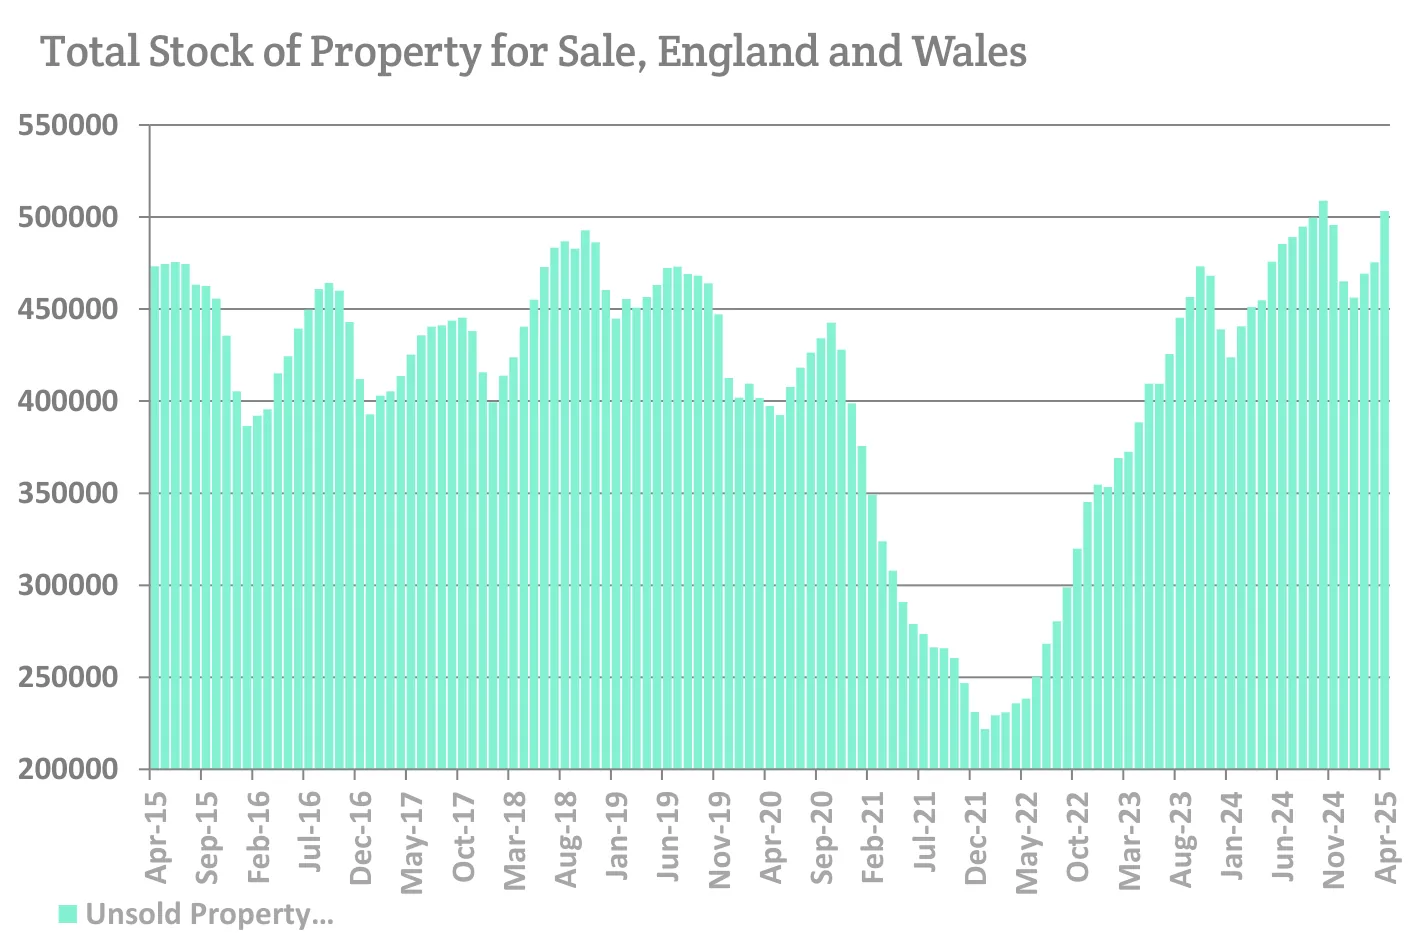
- Sales market momentum shows a significant increase over April 2024. A burst in activity has sent the property turnover rate higher than any of the previous ten years of April readings, while Typical Time on Market is just one day higher than in April last year despite higher stock levels.
- The unsold sales stock count for England and Wales increased by a massive 27,732 properties during the last month, which is far above seasonal expectations. The current total of 503,176 is relatively very high and is the largest April figure since 2013.
- The annualised national growth in asking rents has slipped into the negative (-0.7%), driven down by a rise in supply (22%). The national growth figure is in the red due to the negative performance of London, the West Midlands and Yorkshire. Meanwhile, the East Midlands continues to show exceptional performance, with rental growth of 9.3%.
- The City of London followed by Lambeth indicate the largest declines in asking rents of all London boroughs, with annualised rental falls of 10.5% and 8.6% respectively. Meanwhile, the best performers are Westminster and the tiny rental markets in the boroughs of Sutton and Bromley, with rents increasing by 13.5%, 6.5% and 6.2% respectively.
Summary
Corresponding record sales stock levels (the highest April figure since 2013) gives much cause for concern given that in all likelihood demand will fall back now that the stamp duty deadline has passed. Annualised price growth remains weak overall and the mix-adjusted national average asking price has yet to regain the high set in 2022. The weakest price growth continues to be evident in the southern regions, where rental yields tend to be lower.
Whilst a burst in sales activity presents several positive metrics regarding the current UK housing market, it is important to also note some dark clouds on the horizon. A surge in buyer demand coupled with seasonal expectations and optimism regarding possible further reductions in mortgage rates has driven UK home prices higher. Prices during March have risen in Scotland, Wales and all English regions with the exception of Greater London, where oversupply has thwarted the expected seasonal uptick. Indeed, oversupply is a growing problem as ever greater numbers of vendors instruct agents across the UK.
Key figures
| Measure | Figure |
|---|---|
| Monthly asking price change | +0.5% |
| Annual asking price growth | 1.4% |
| Annual asking price growth, April 2024 | 0.8% |
| Unsold sales stock total | 503,176 |
| Monthly increase in unsold stock | 27,732 |
| Annual asking rent growth | -0.7% |
| Rise in rental supply | 22% |
Figures are for England and Wales unless the report states otherwise, as published in the edition.
Charts from the report
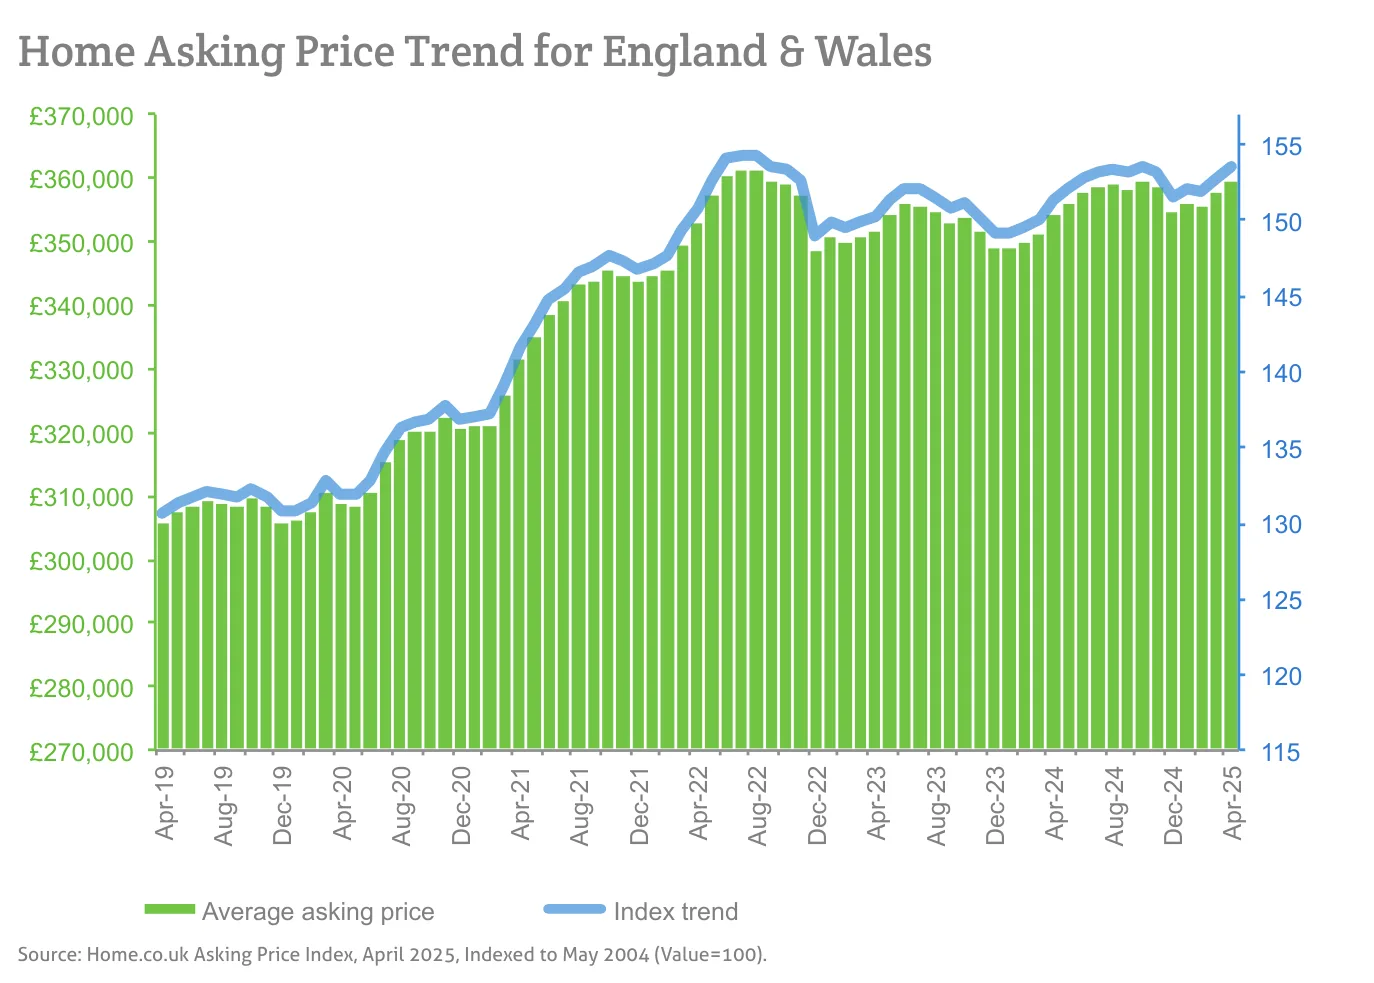
Source: Home.co.uk Asking Price Index, April 2025, Indexed to May 2004 (Value=100).
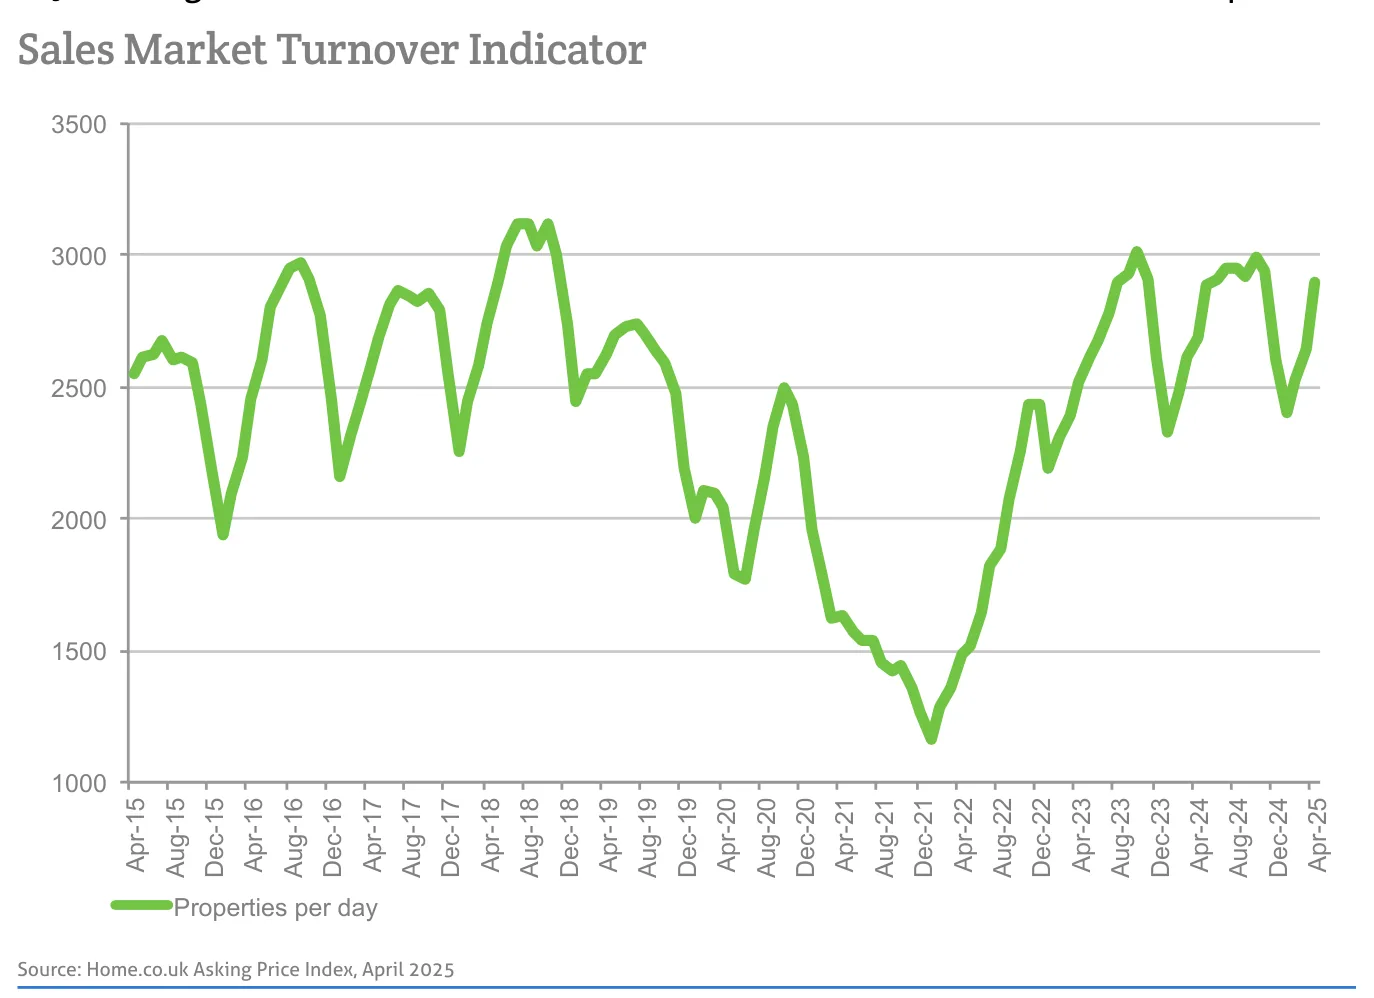
Source: Home.co.uk Asking Price Index, April 2025
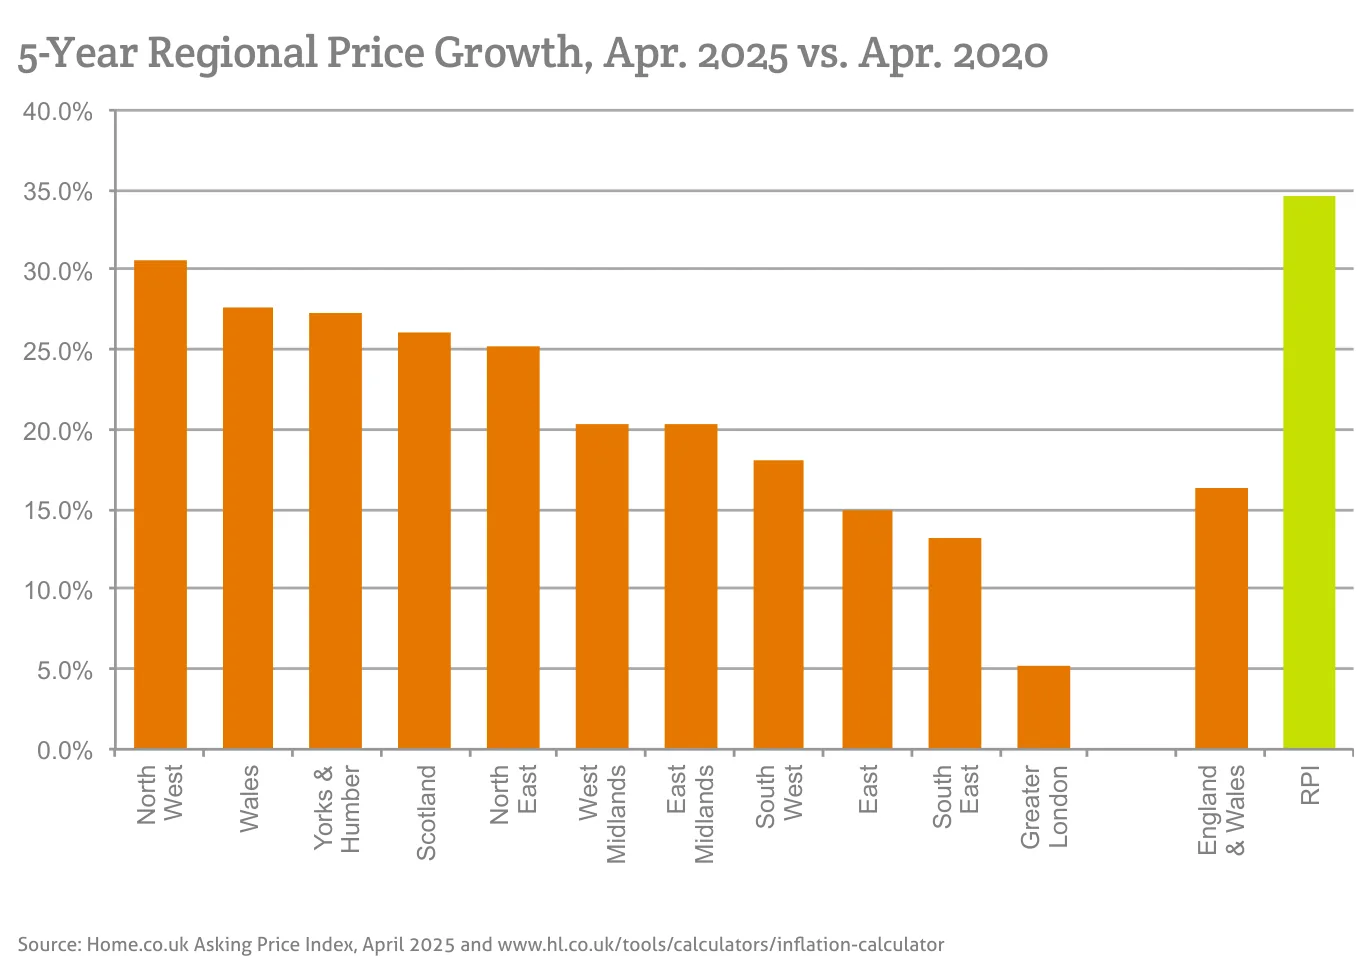
Source: Home.co.uk Asking Price Index, April 2025 and www.hl.co.uk/tools/calculators/inflation-calculator
Source: Home.co.uk Asking Price Index, April 2025
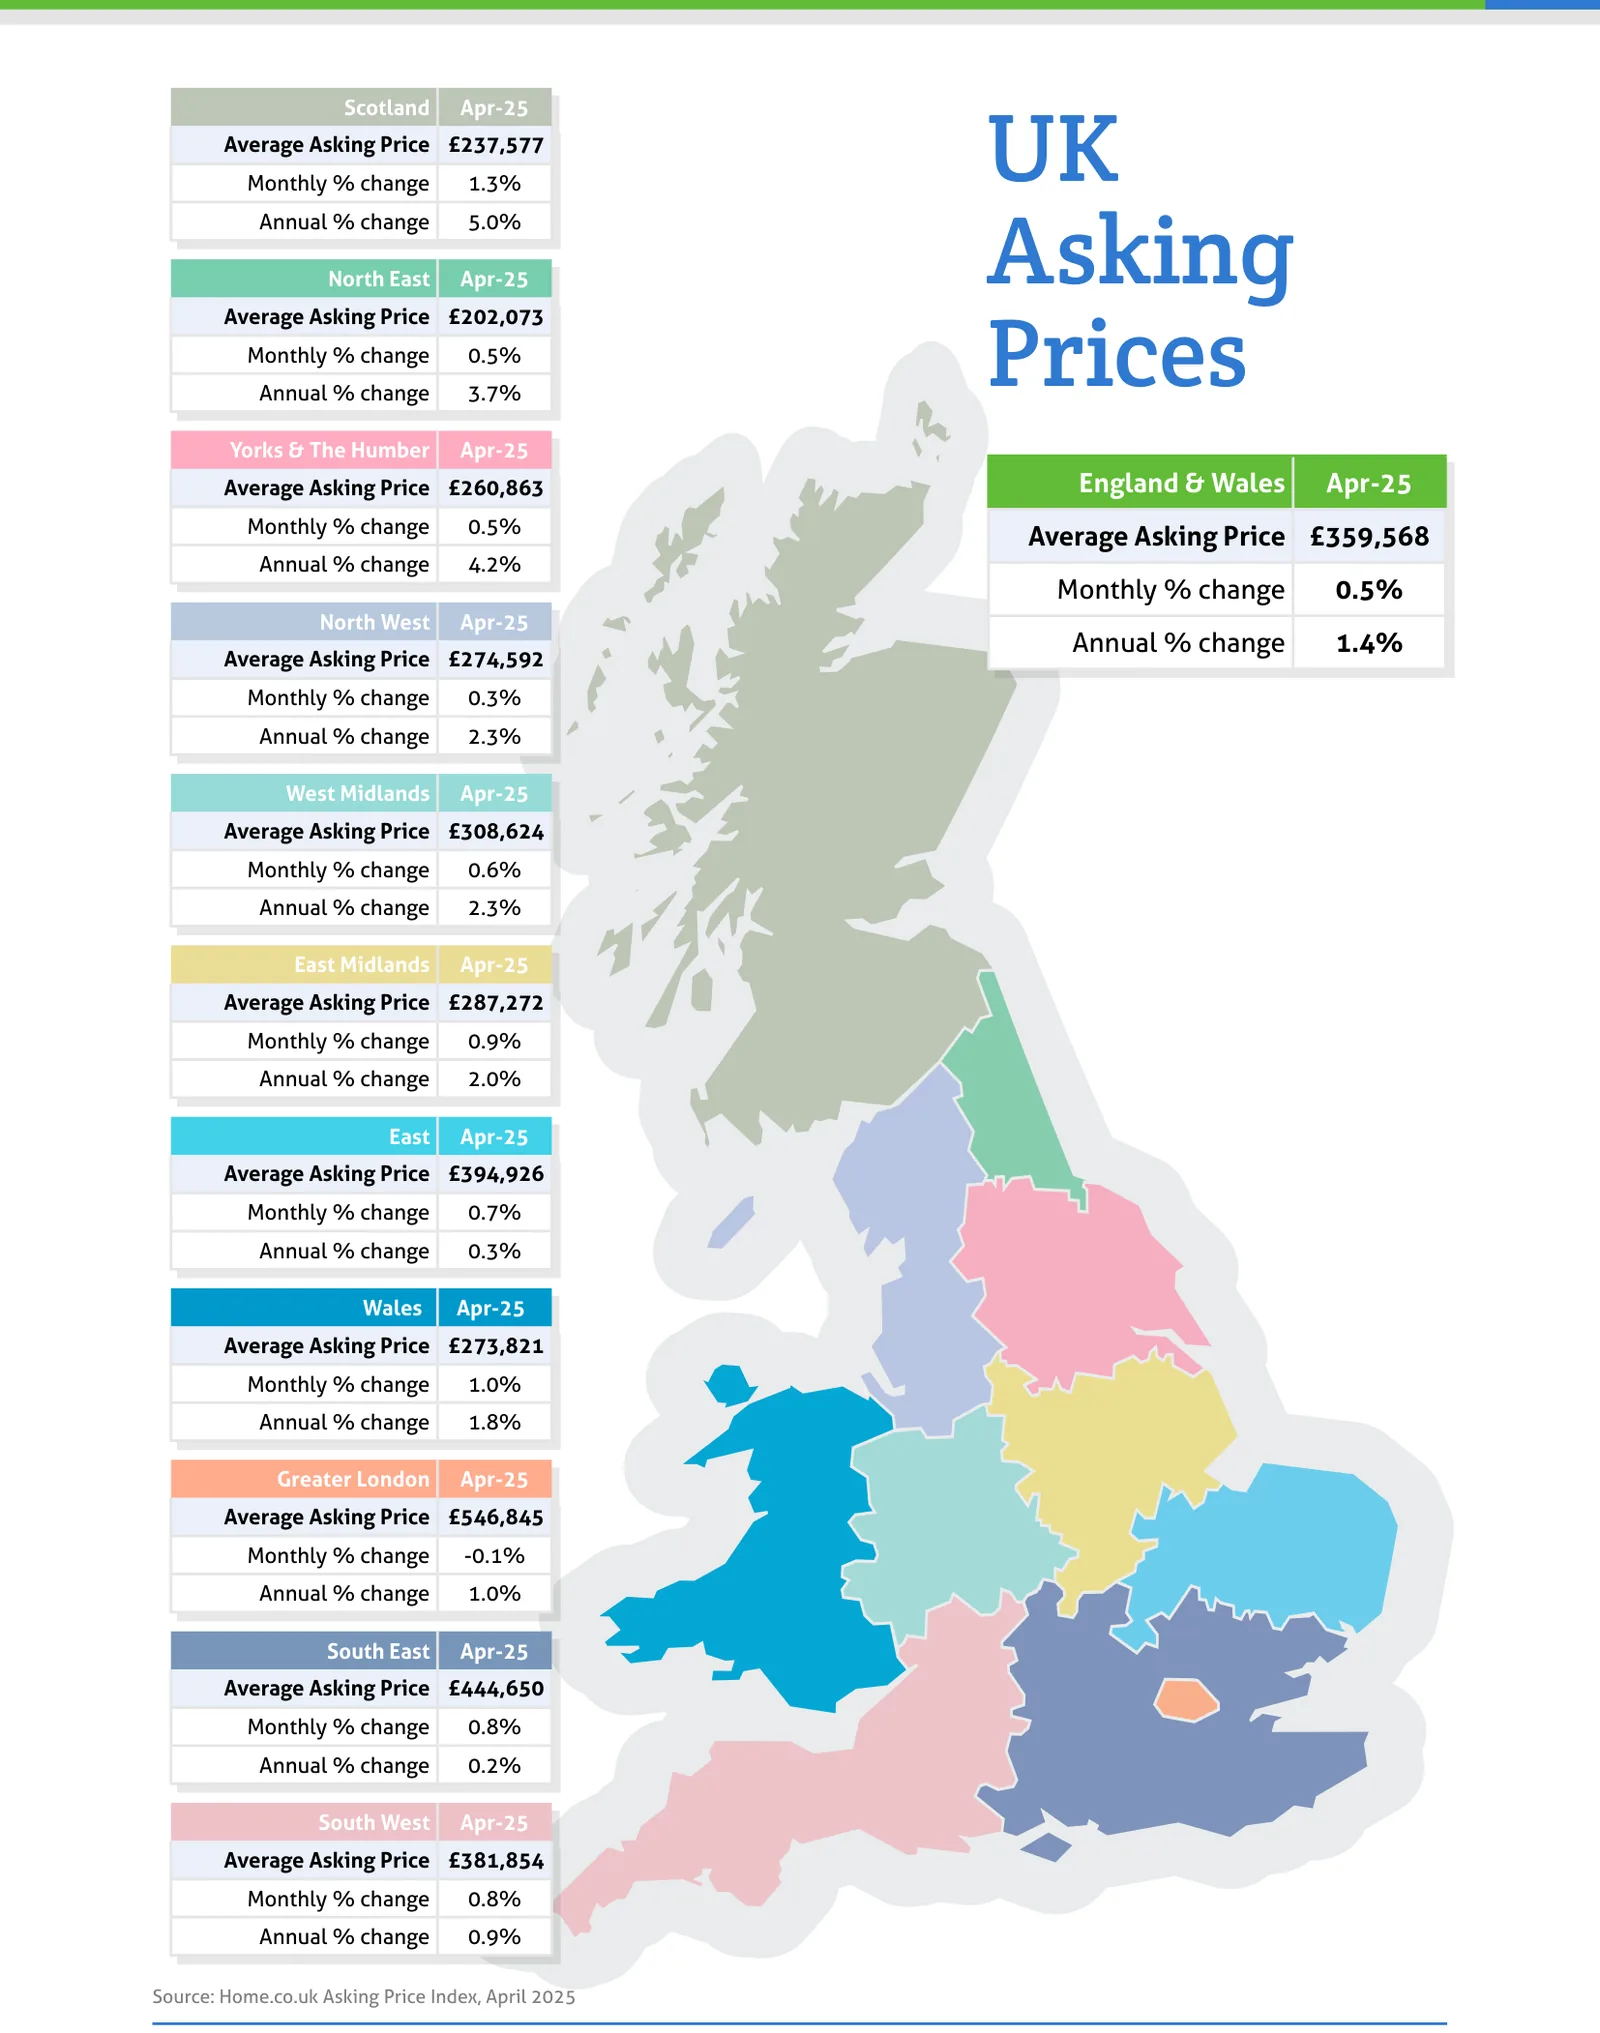
Source: Home.co.uk Asking Price Index, April 2025
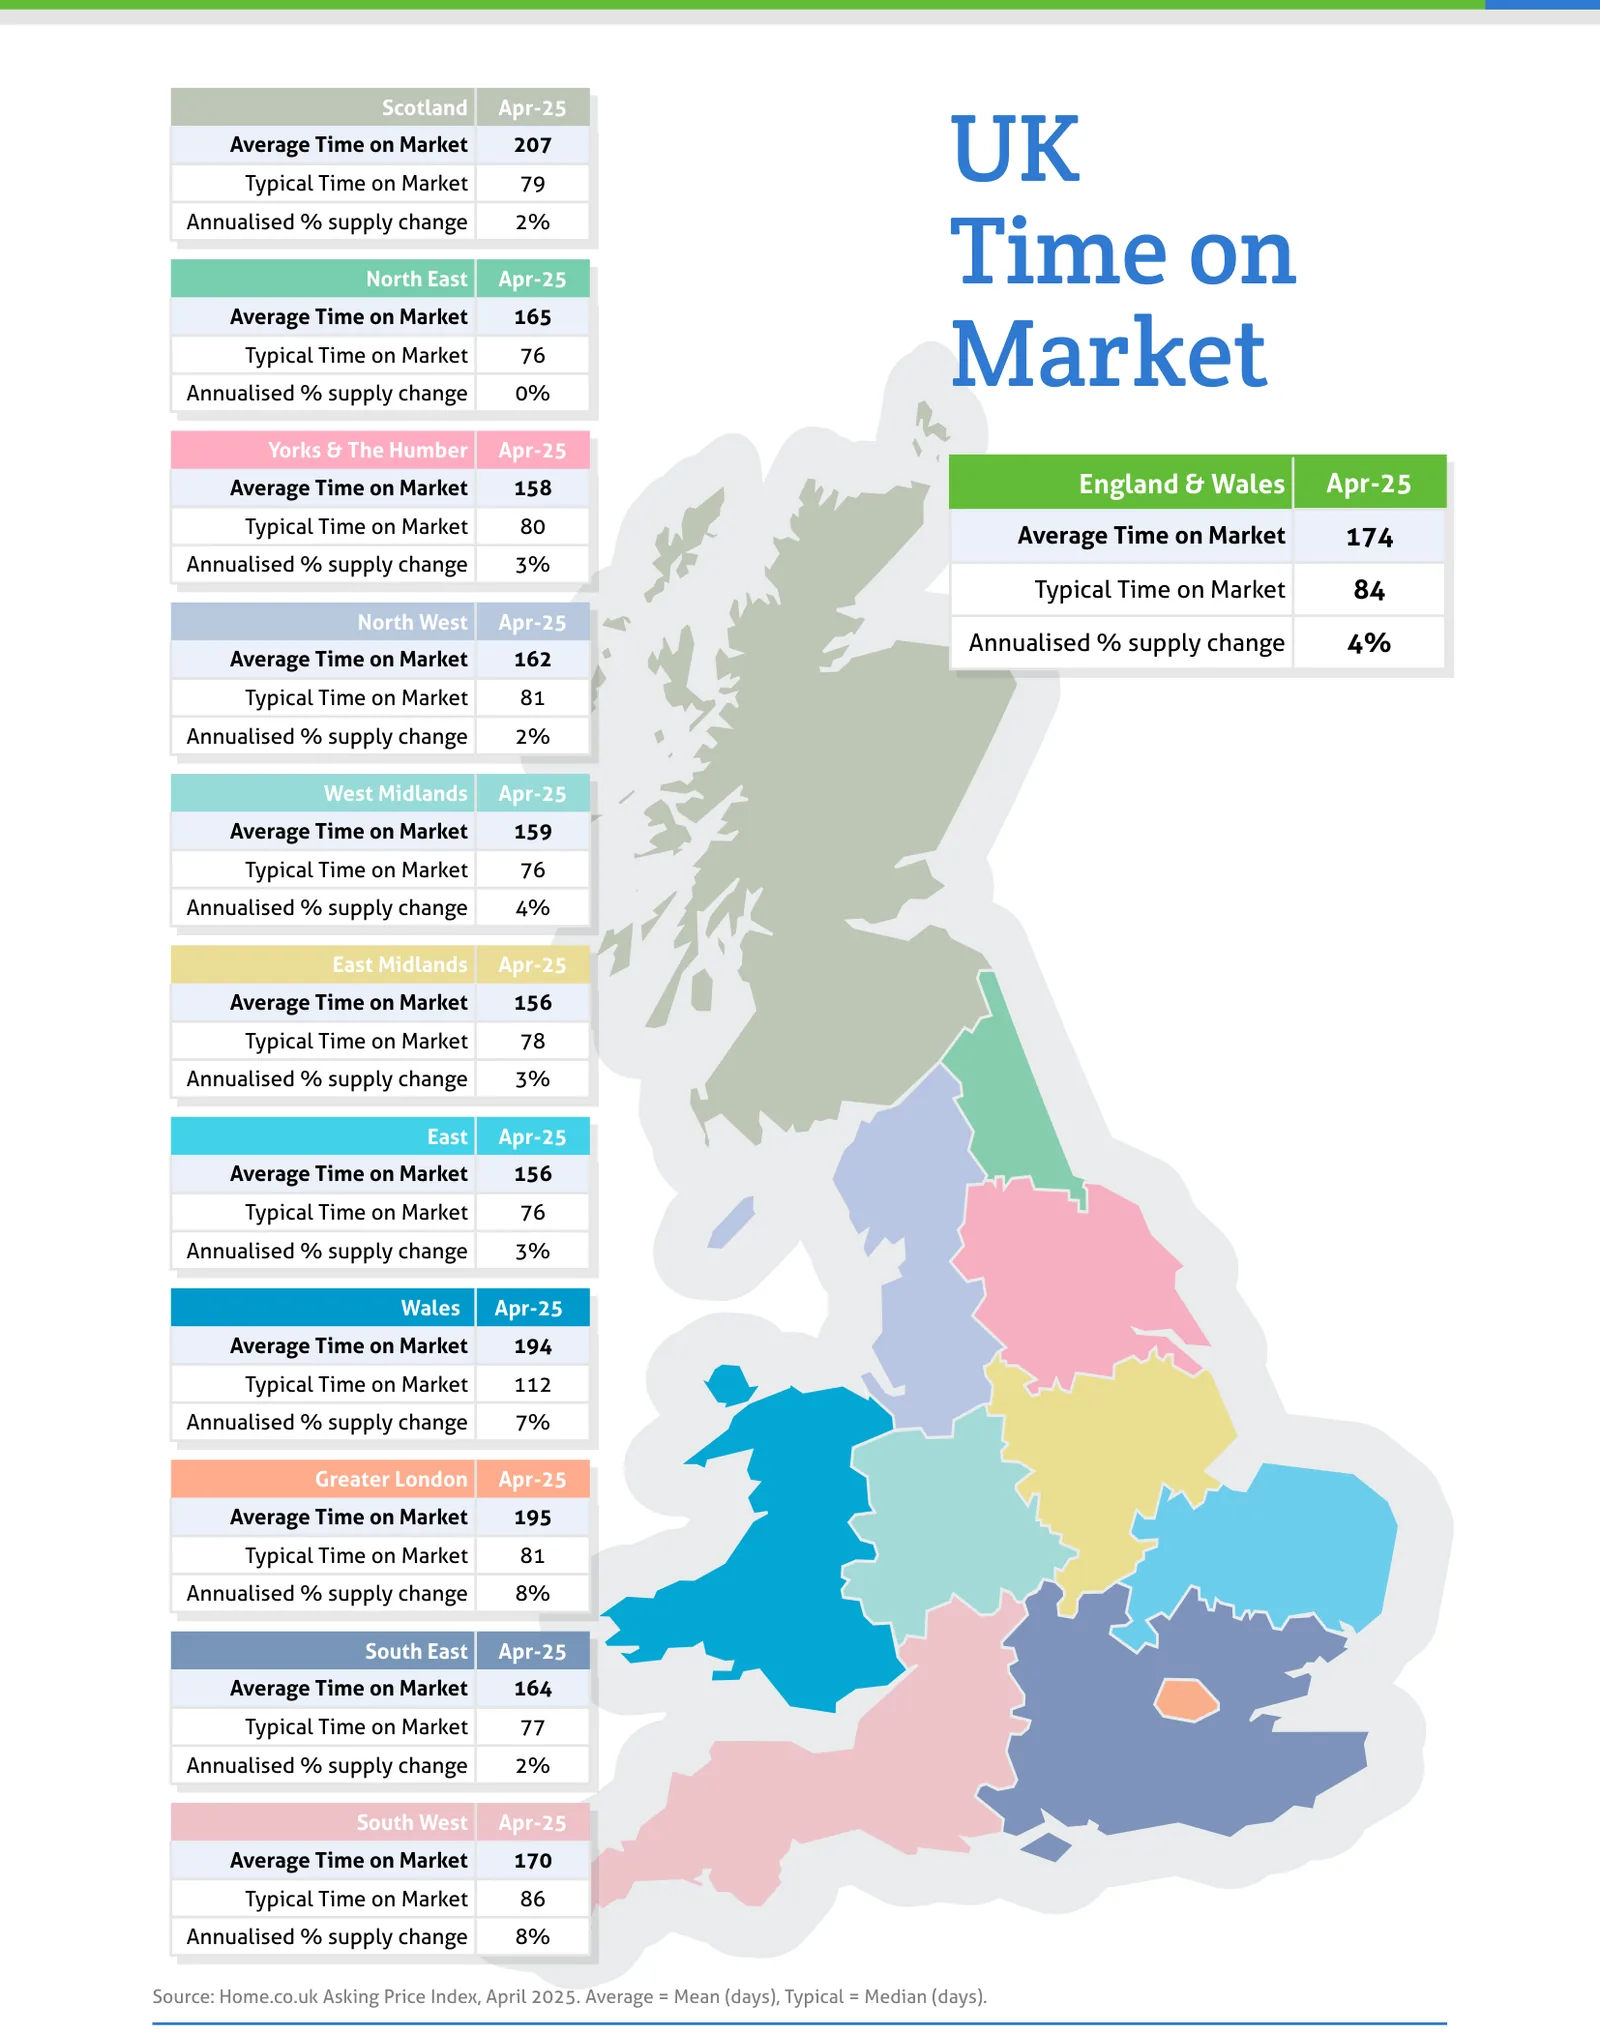
Source: Home.co.uk Asking Price Index, April 2025. Average = Mean (days), Typical = Median (days).
Regional tables
UK Asking Prices, Apr-25
| Region | Average Asking Price | Monthly % change | Annual % change |
|---|---|---|---|
| Scotland | £237,577 | 1.3% | 5.0% |
| North East | £202,073 | 0.5% | 3.7% |
| Yorks & The Humber | £260,863 | 0.5% | 4.2% |
| England & Wales | £359,568 | 0.5% | 1.4% |
| North West | £274,592 | 0.3% | 2.3% |
| West Midlands | £308,624 | 0.6% | 2.3% |
| East Midlands | £287,272 | 0.9% | 2.0% |
| East | £394,926 | 0.7% | 0.3% |
| Wales | £273,821 | 1.0% | 1.8% |
| Greater London | £546,845 | -0.1% | 1.0% |
| South East | £444,650 | 0.8% | 0.2% |
| South West | £381,854 | 0.8% | 0.9% |
UK Time on Market, Apr-25
| Region | Average Time on Market | Typical Time on Market | Annualised % supply change |
|---|---|---|---|
| Scotland | 207 | 79 | 2% |
| North East | 165 | 76 | 0% |
| Yorks & The Humber | 158 | 80 | 3% |
| England & Wales | 174 | 84 | 4% |
| North West | 162 | 81 | 2% |
| West Midlands | 159 | 76 | 4% |
| East Midlands | 156 | 78 | 3% |
| East | 156 | 76 | 3% |
| Wales | 194 | 112 | 7% |
| Greater London | 195 | 81 | 8% |
| South East | 164 | 77 | 2% |
| South West | 170 | 86 | 8% |
From the director's commentary
"Demand for property clearly depends on people retaining their jobs. Current trends suggest that demand will be eroded increasingly quickly as more and more businesses shed workers in an attempt to cut costs and survive."
Doug Shephard, Director at Home.co.uk
Read the full April 2025 edition (PDF, 9 pages)
About the Home Asking Price Index
The Home Asking Price Index measures the change in the prices sellers ask for residential property across England, Wales and Scotland. Today it is computed every month from around half a million advertised homes and is mix-adjusted, so a change in what happens to be on the market does not move the figure; earlier editions state the sample they were built from. Because an asking price is set months before a sale completes, the index runs around five months ahead of completed-sale measures such as the UK House Price Index.
Every edition in the archive, back to October 2006, is listed on the index page. How we measure the UK property market explains the listing data behind it, and today's figures by area are on house prices and rental prices.
Text and figures above are quoted from the April 2025 edition as published, with punctuation normalised for the web, and are not revised. Later editions may restate them.
More in What is happening to house prices: the Home guide
Thinking about your next move?
See what your home's worth in seconds, with the UK's longest-running property data behind it.
Get an instant valuation