

























Home Asking Price Index, April 2024: prices surge as properties 'fly off the shelves'
Average asking prices for England and Wales rose 0.9% month-on-month and 0.8% year-on-year, while new instructions increased 12% and time on market fell to 83 days.
This is the April 2024 edition of the Home Asking Price Index, released on 17 April 2024, under the headline:
Prices Surge as Properties 'Fly Off the Shelves'
The headlines and summary below are the report's own words, with the key figures as it published them, followed by the report's charts and regional tables as printed.
Headlines
- Asking price growth accelerates. Prices are up 0.9% since last month across England and Wales and 0.8% since April 2023.
- Prices were hiked again in ALL English regions and Wales during the last month, indicating increasing positive sentiment, although prices in Scotland dipped a little.
- Market momentum is really taking off, as indicated by the Typical Time on Market for unsold property in England and Wales dropping 21 days since last month. The current median is 83 days; in pre-COVID April 2019, the same measure was 93 days.
- The total unsold sales stock count for England and Wales indicates a small rise in line with seasonal expectations, although this increase is dwarfed by the number of new instructions (ca.139,000). Hence, since many properties have changed status to SOLD or SSTC, the current total of unsold property is a mere 3,000 more than last month.
- The number of new instructions entering the market during March 2024 was 12% more than during March 2023. This notable increase underlines the greater vendor optimism and the increasing alacrity of the market.
- The North West tops the regional property market growth league with a year-on-year gain of 4.1% while the East of England remains the worst performing region over the same period at -1.2%.
- Falling asking rents in London, the UK's largest rental market by far, have significantly impacted the national growth figure. The annualised change is just 2.1% despite double digit growth in some regions; the North East, for example, is indicating growth at +17.1% year-on-year. Greater London rents are down 4.8%.
- Rents continue to slide in several London boroughs due to oversupply, although the overall picture is increasingly mixed. Some boroughs such as Islington have returned to significant growth (+9.5%) while the worst performer remains Kensington and Chelsea with a year-on-year fall in asking rents of 18.1%.
Summary
While price growth is to be expected during spring, the size of the price rises in several regions surpasses the norm. Confident vendors in the South West and Yorkshire hiked prices so much during the last month that the mix-adjusted average rose by 1.7% and 1.6% respectively. Moreover, they are not alone, as the North East, Wales, and West Midlands also show month-on-month price hikes above 1%. Such rapid price hikes may not be entirely justified by current demand, although given the fact that Typical Time on Market for unsold property is now lower than it was in April 2019, there is some cause for confident pricing.
Positive trends in all the key indicators underline the fact that the UK property sales market has recovered from the interest rate shocks and is proceeding apace. Properties are moving through the market more rapidly overall than was observed in pre-COVID years. Confidence has risen significantly following the rebalancing of supply and demand, as demonstrated by a return to modest year-on-year price growth overall.
Positive market sentiment has triggered a rise in new instructions. The total of new market entrants during the last month is 12% higher than a year ago, affording greater choice for buyers. Demand is also increasing as previously hesitant homebuyers return, comforted by price stability and the probable end to rising interest rates. As we stated last month, pent-up demand will be a key driver of pricing this year.
Key figures
| Measure | Figure |
|---|---|
| Monthly asking price change | +0.9% |
| Annual asking price change | +0.8% |
| Typical Time on Market | 83 days |
| Total unsold stock | 454,667 |
| New instructions annual change | +12% |
| UK asking rent annual change | +2.8% |
Figures are for England and Wales unless the report states otherwise, as published in the edition.
Charts from the report
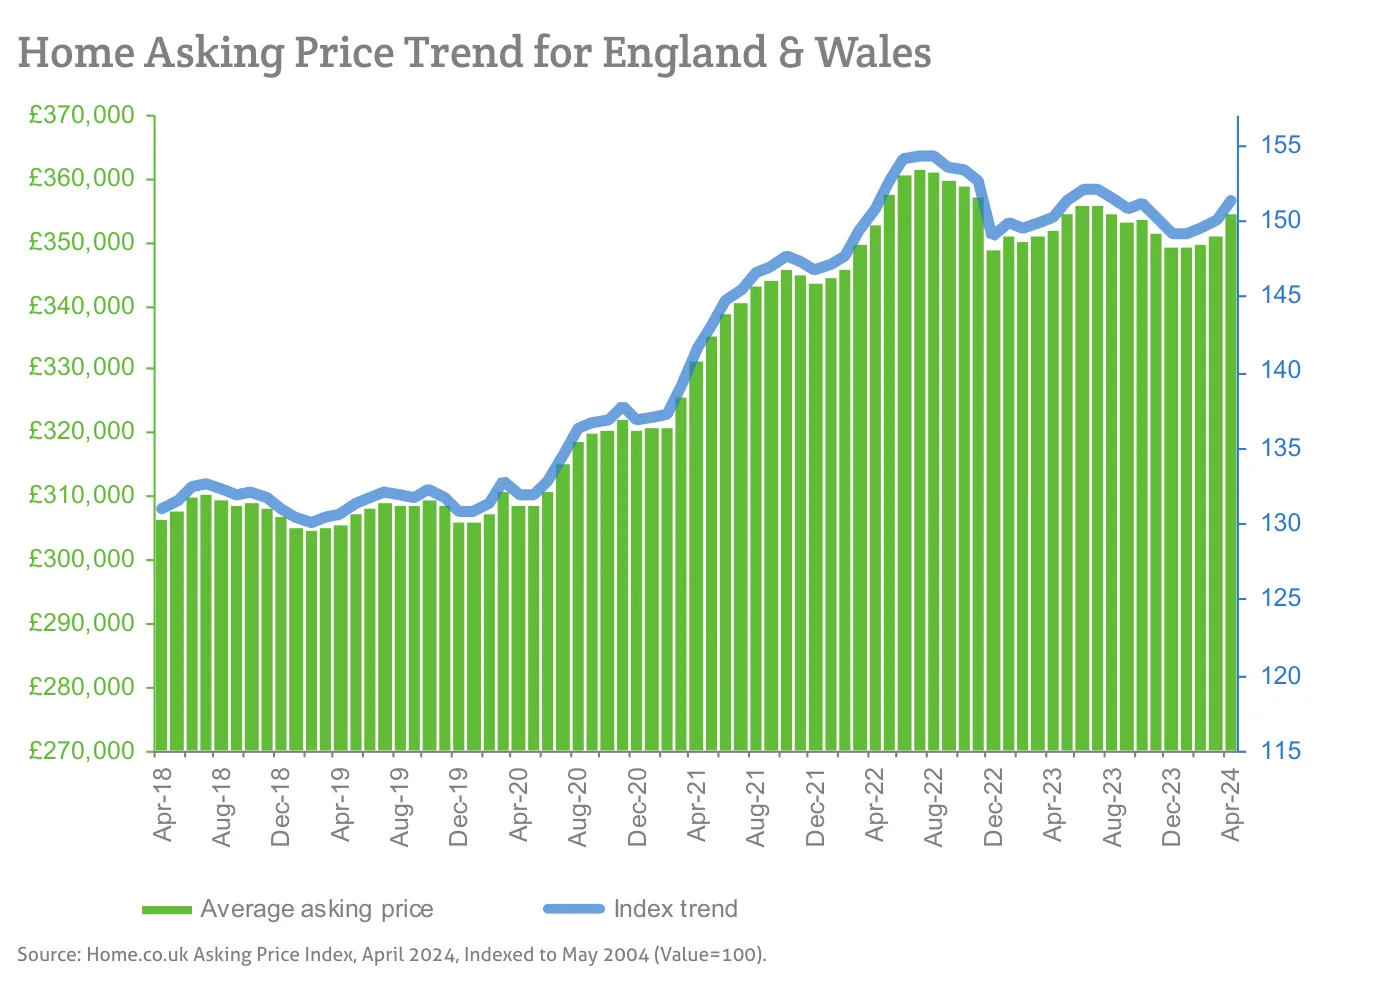
Source: Home.co.uk Asking Price Index, April 2024, Indexed to May 2004 (Value=100).
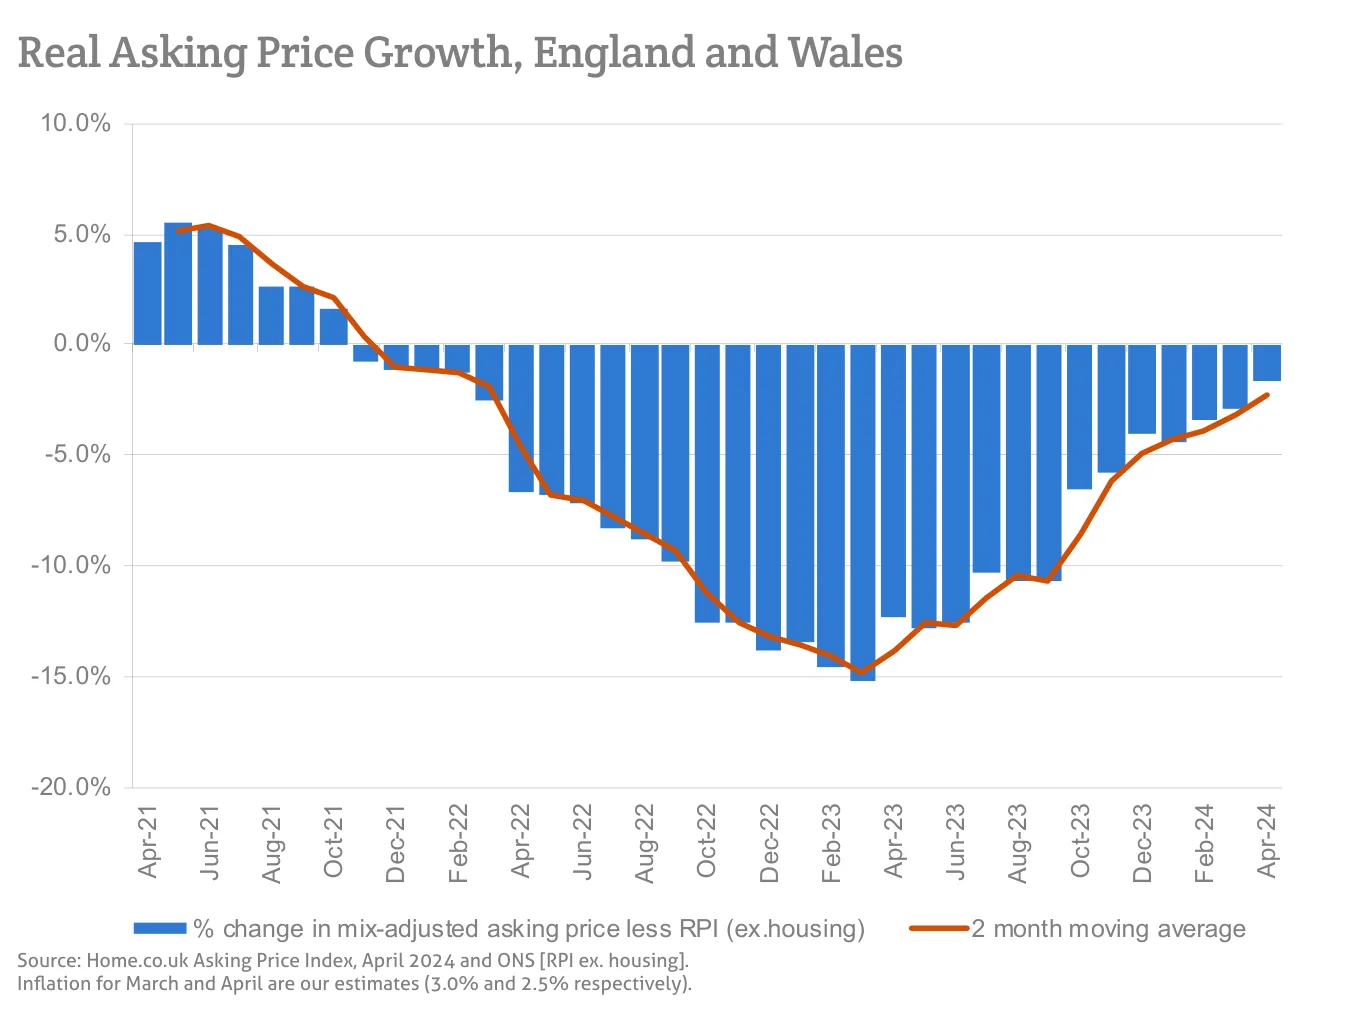
Source: Home.co.uk Asking Price Index, April 2024 and ONS [RPI ex. housing].
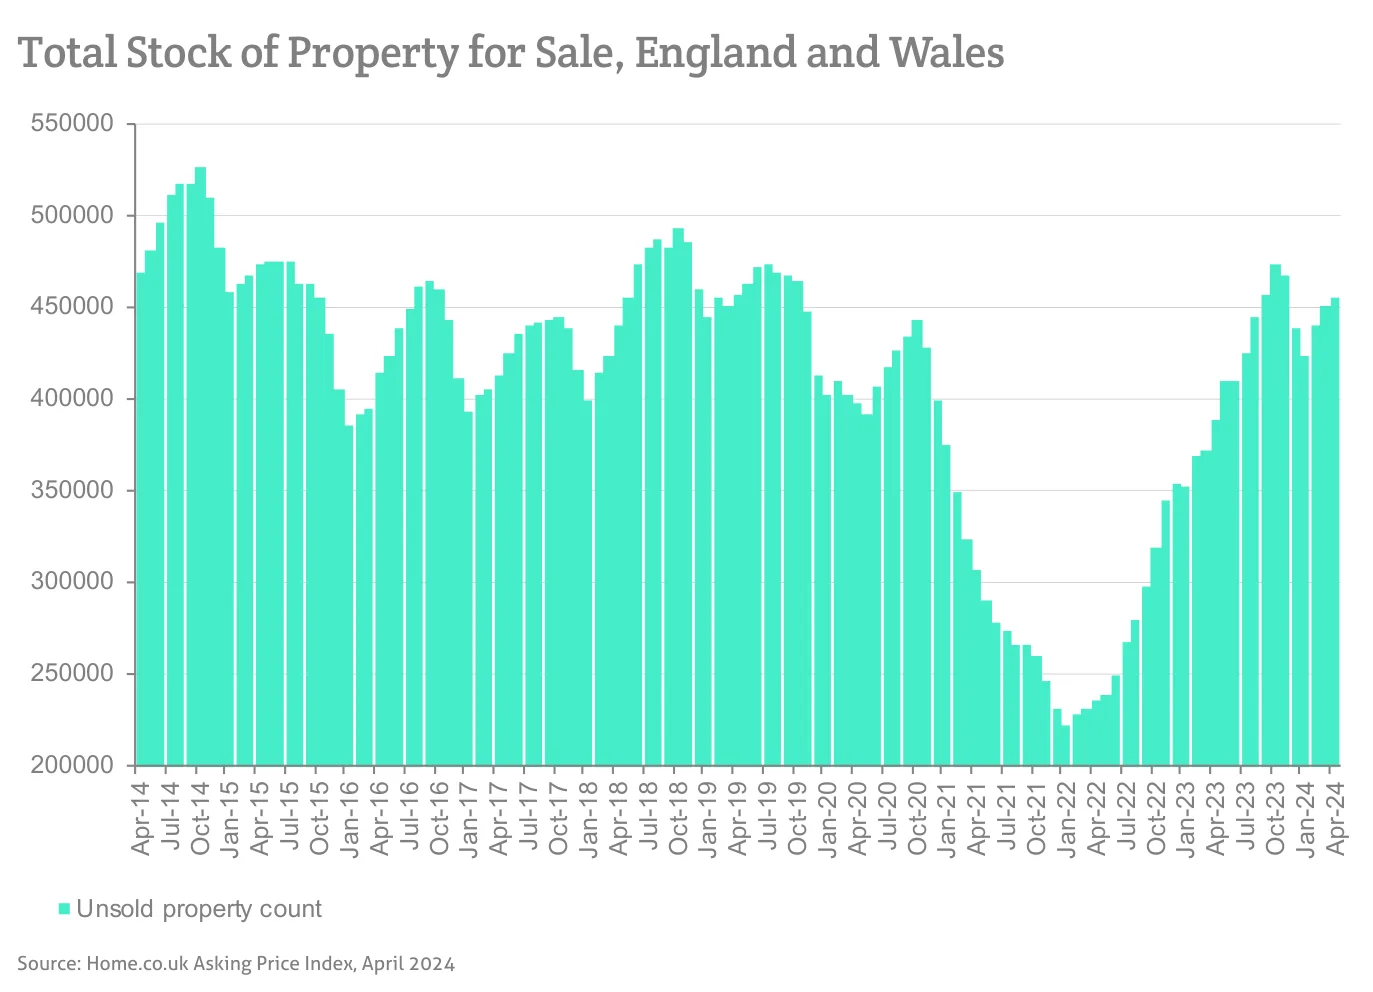
Source: Home.co.uk Asking Price Index, April 2024
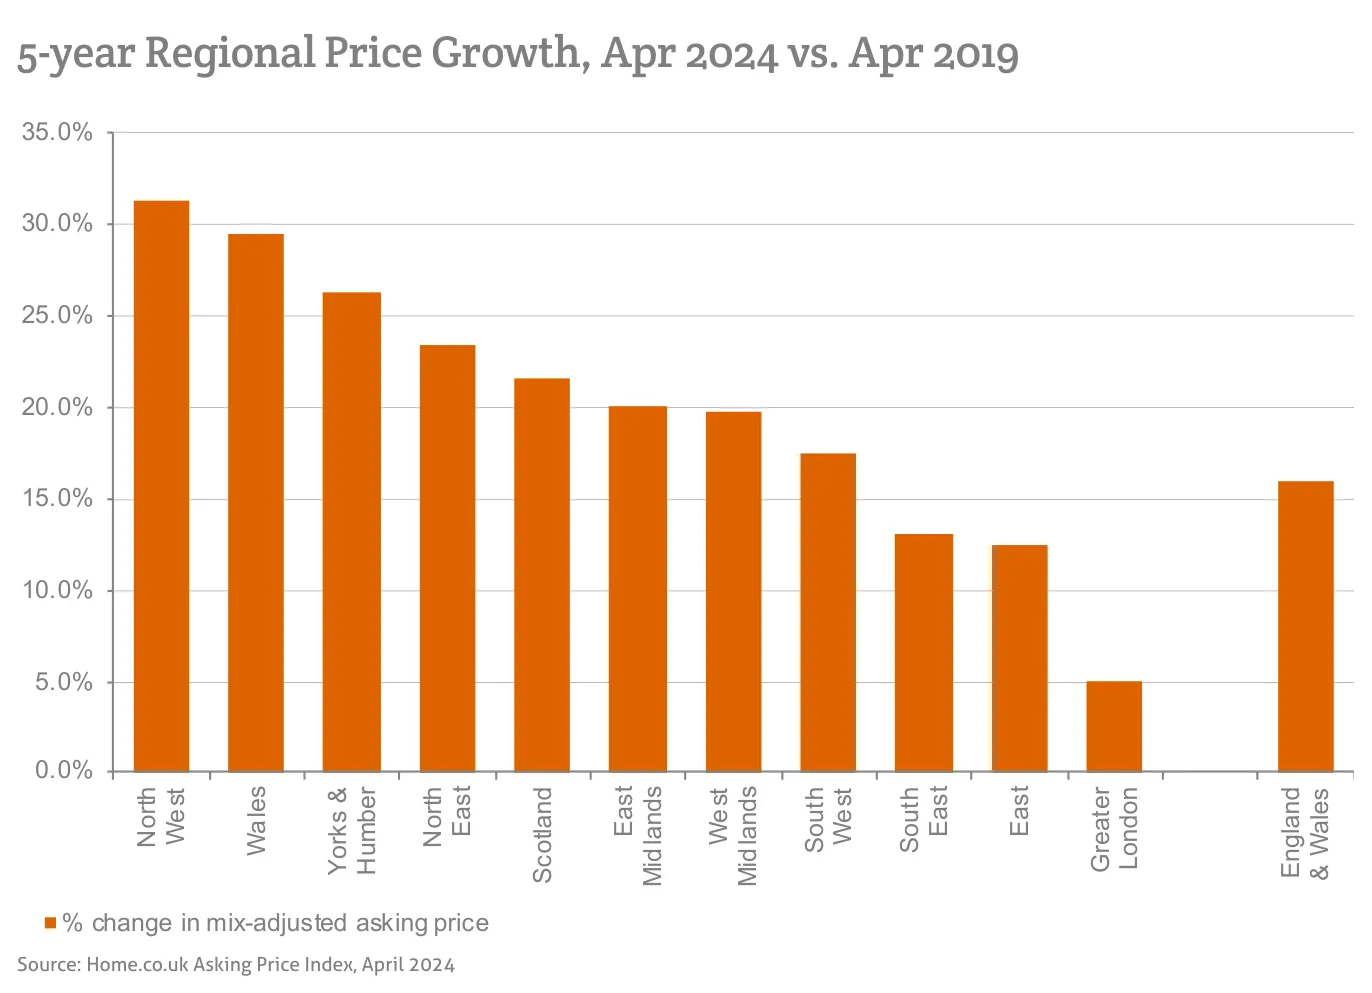
Source: Home.co.uk Asking Price Index, April 2024
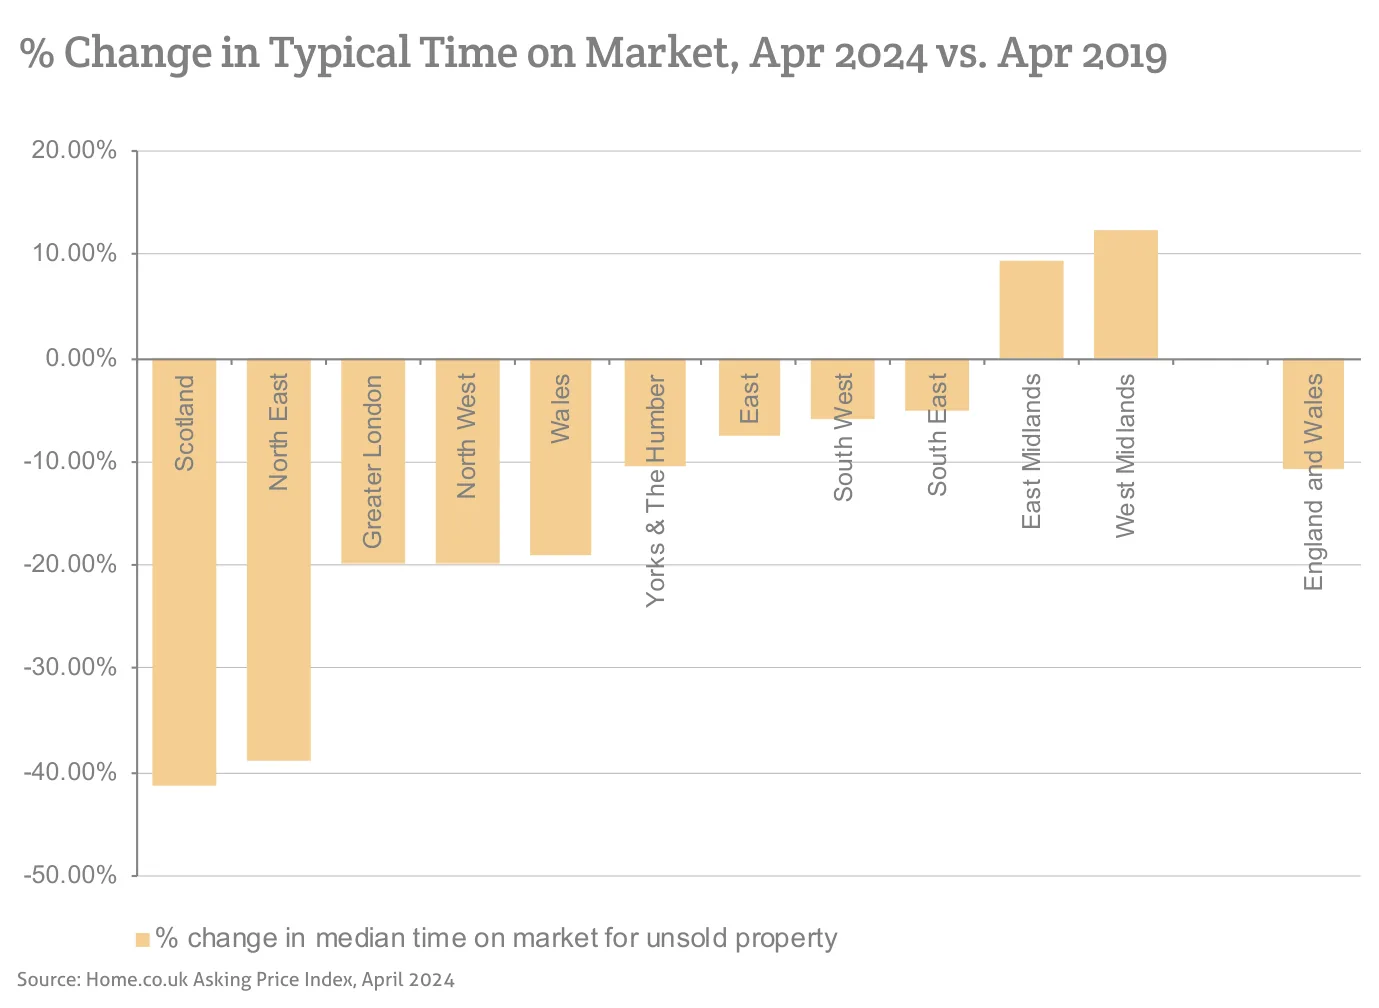
Source: Home.co.uk Asking Price Index, April 2024
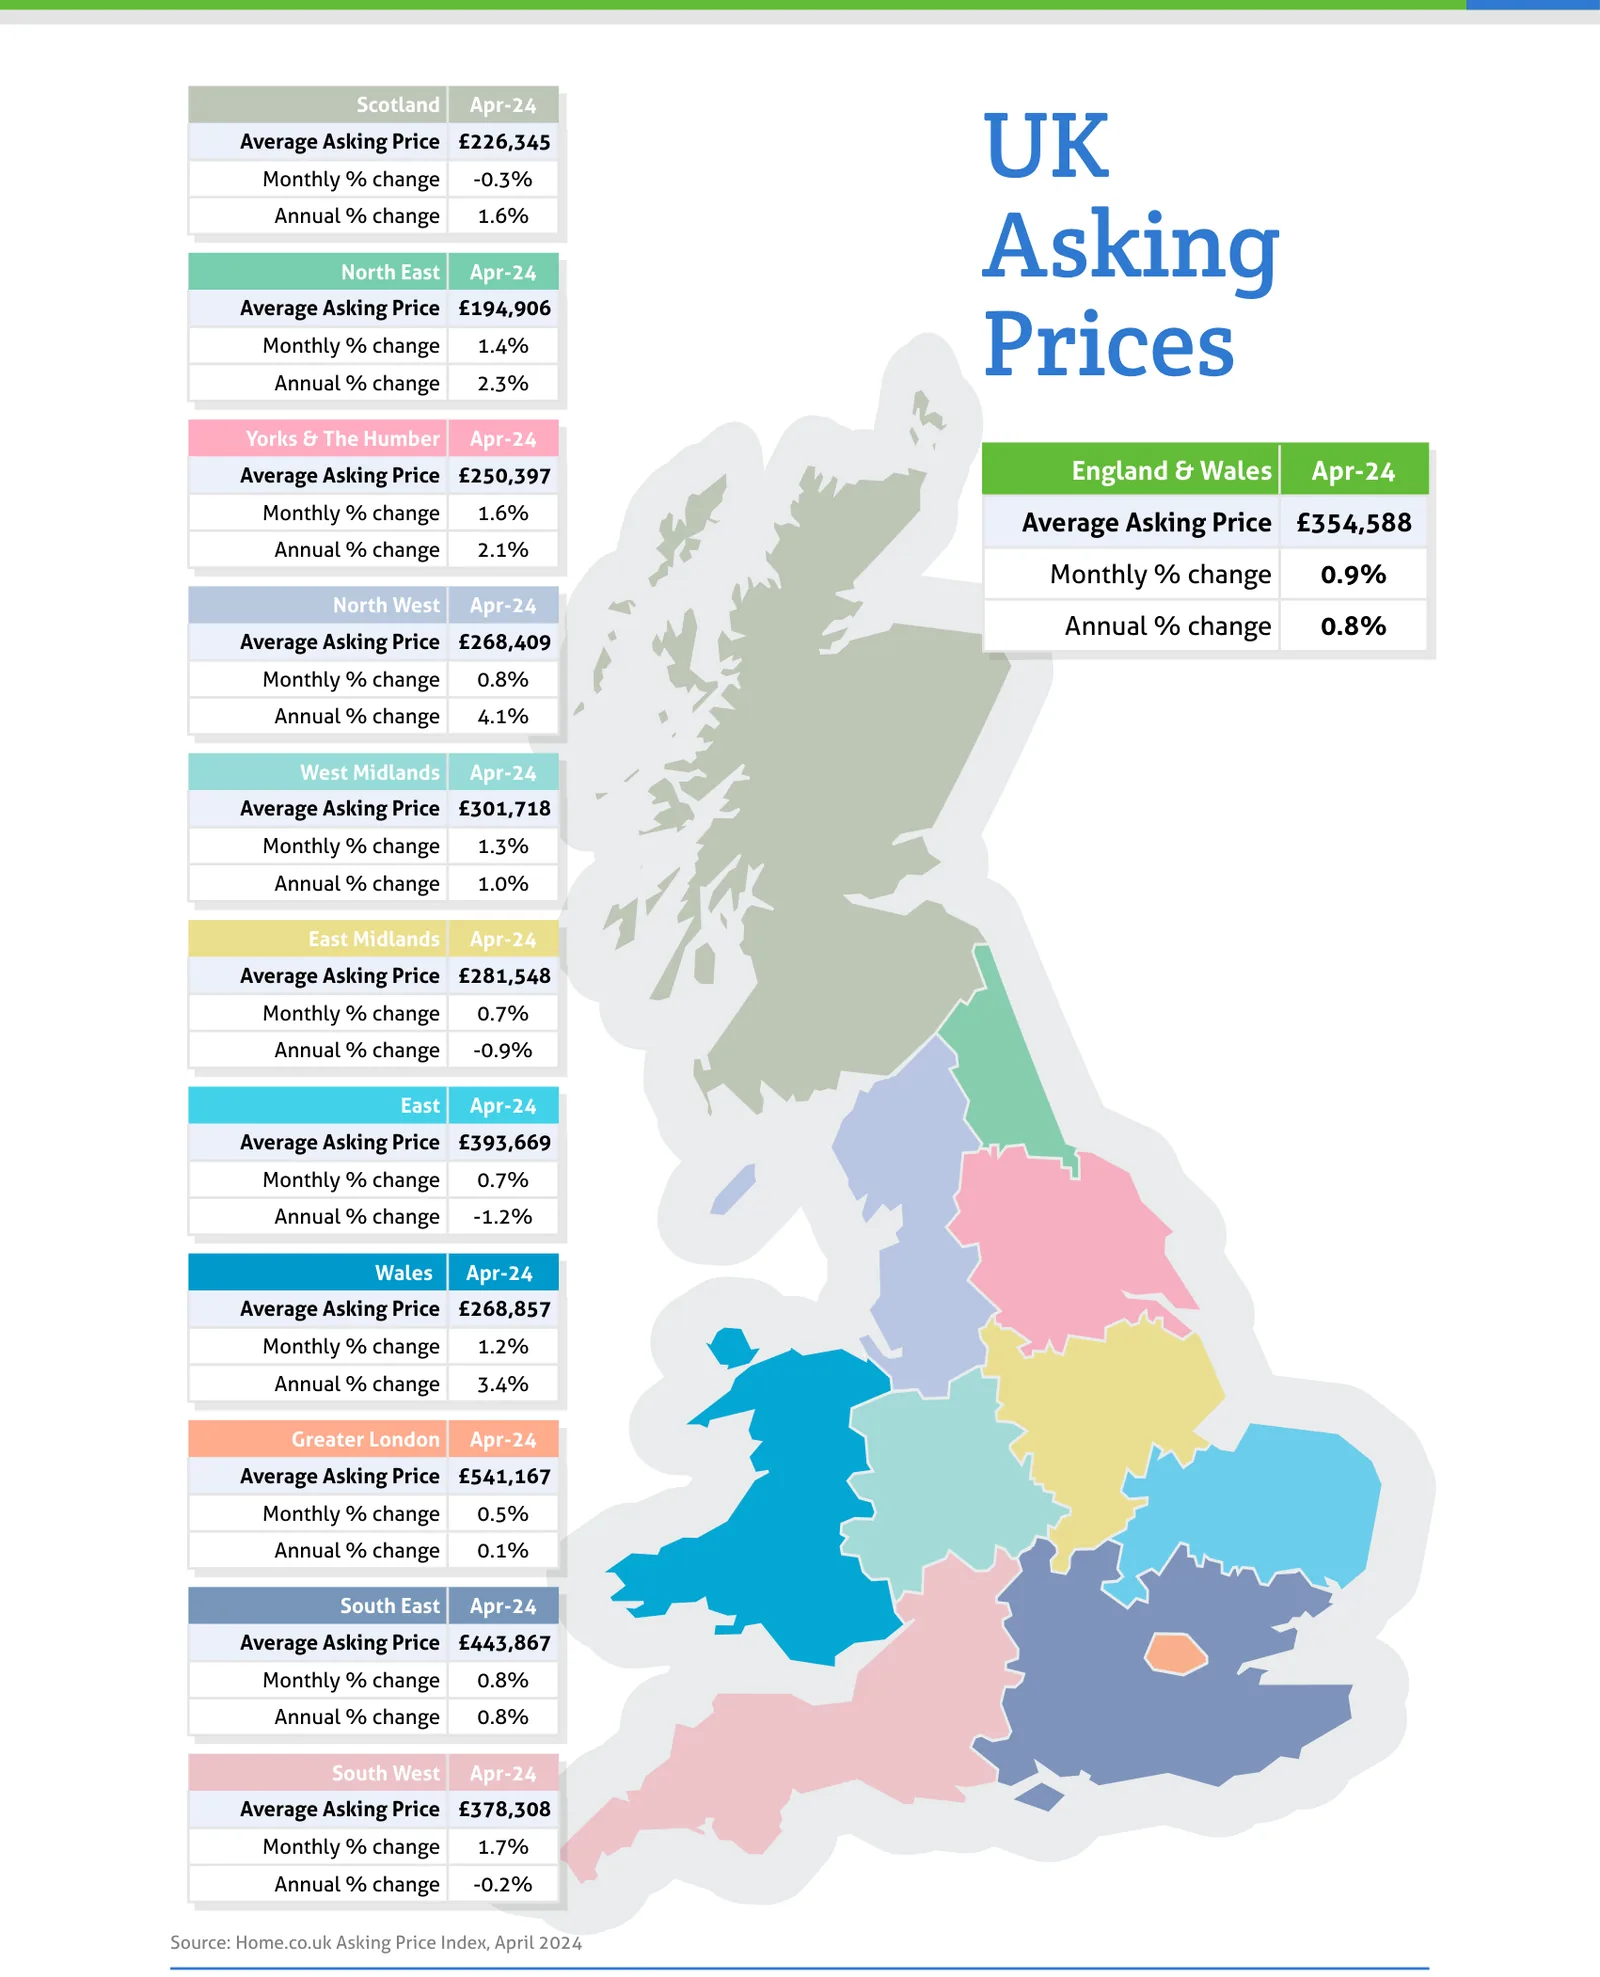
Source: Home.co.uk Asking Price Index, April 2024
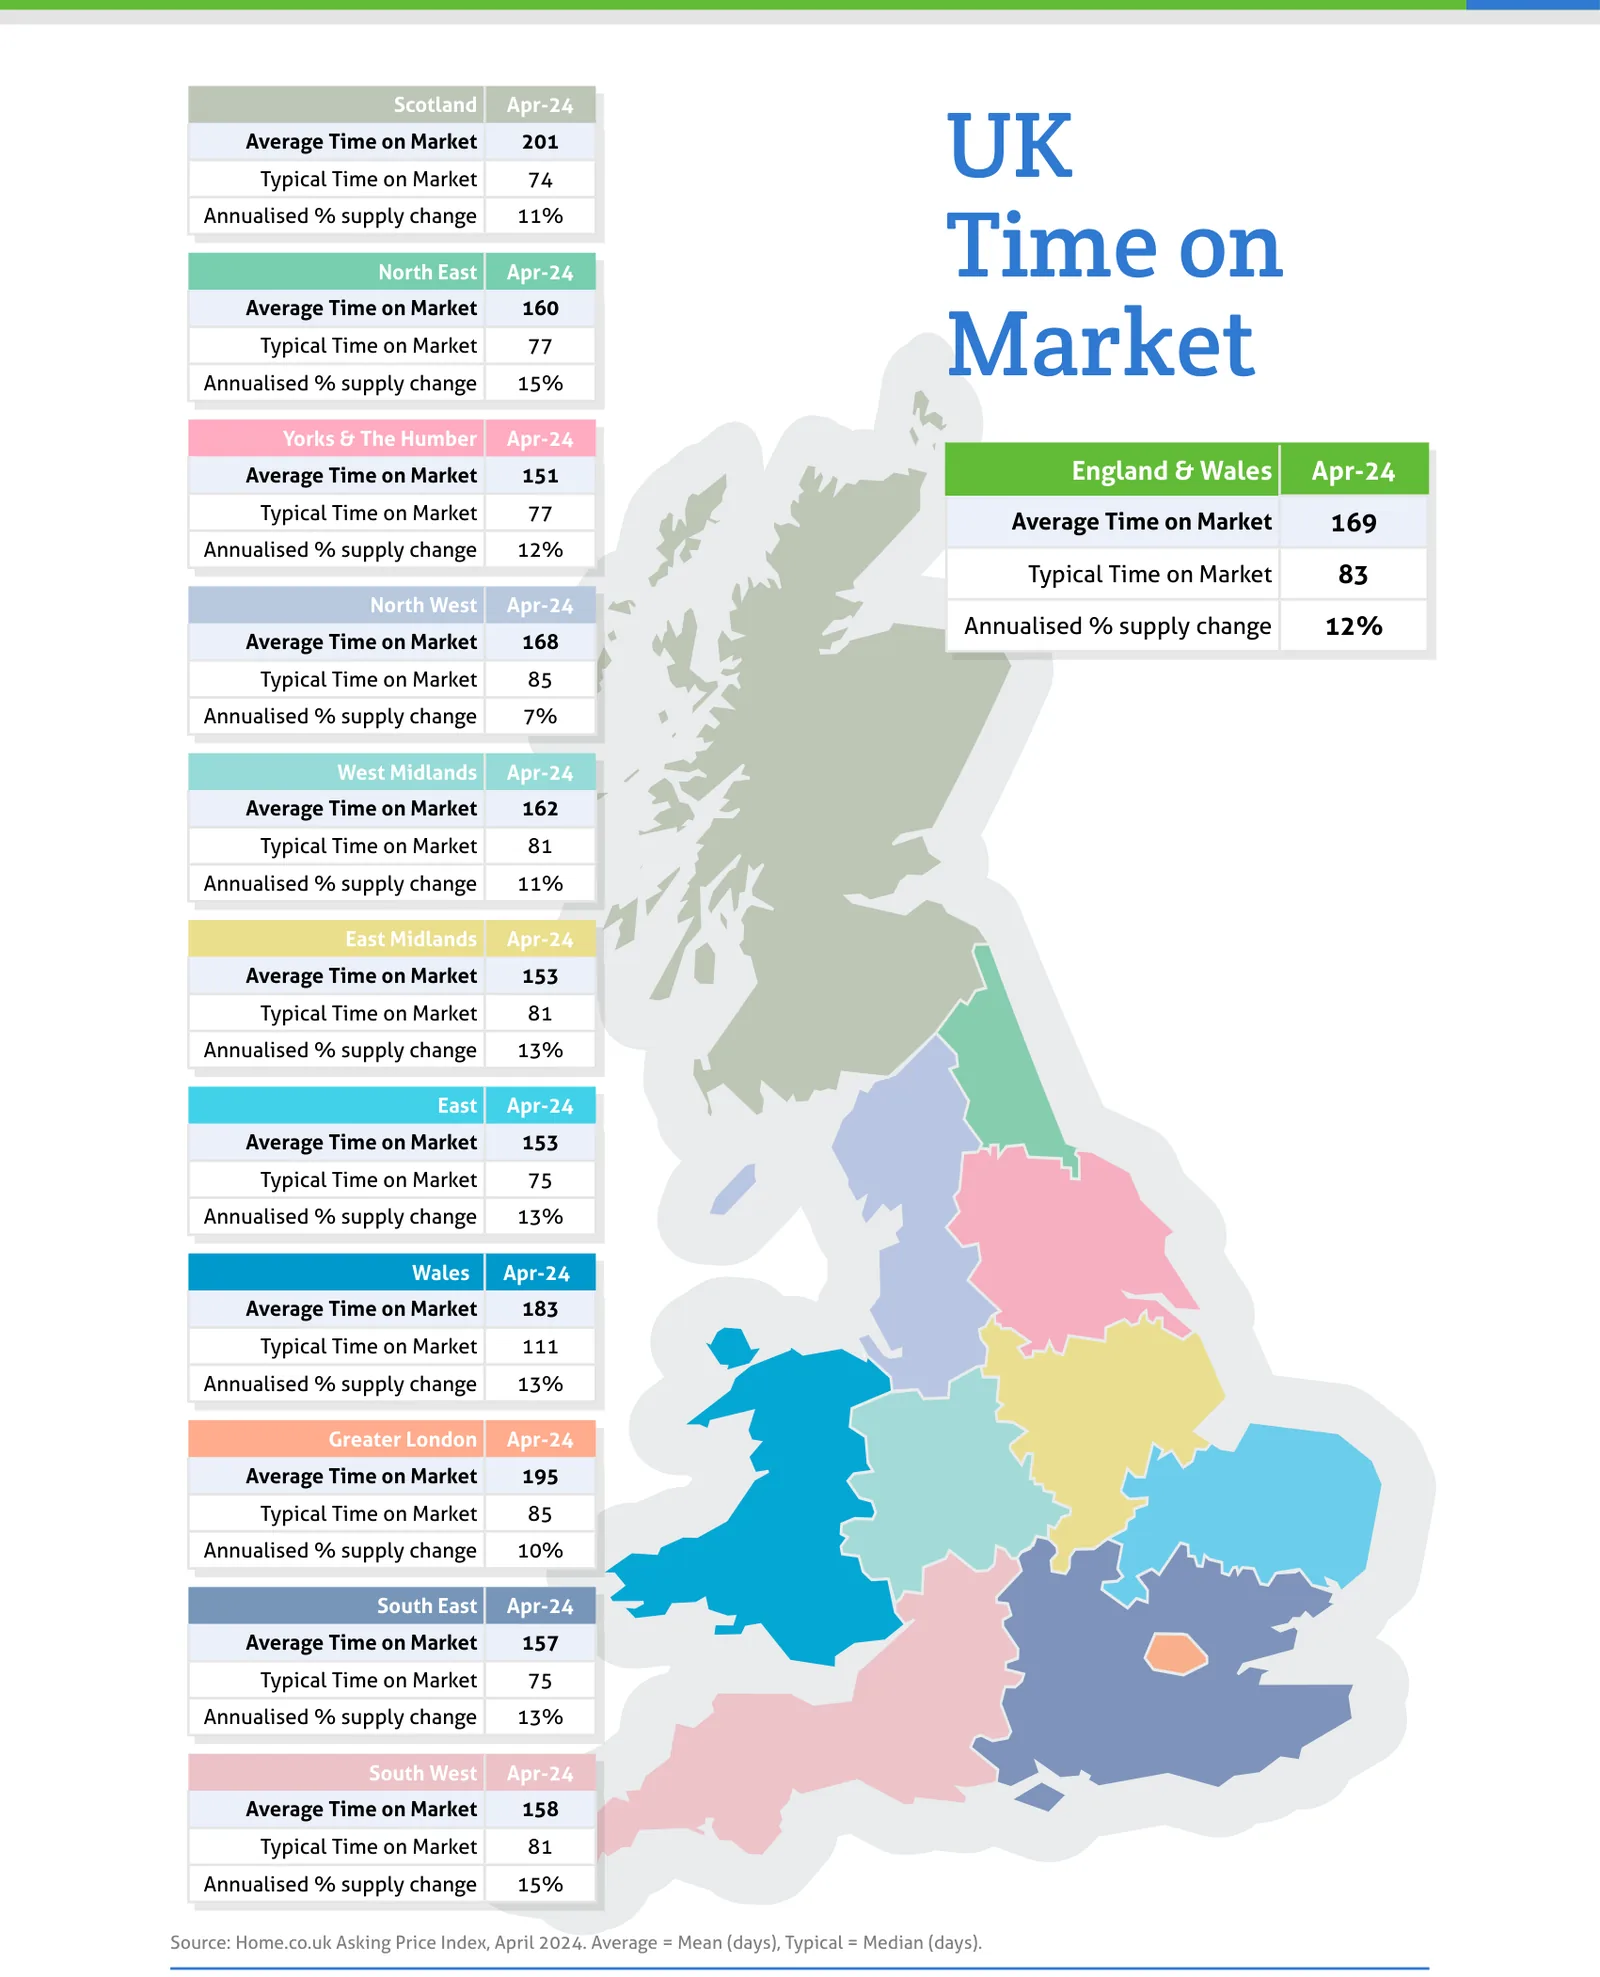
Source: Home.co.uk Asking Price Index, April 2024. Average = Mean (days), Typical = Median (days).
Regional tables
UK Asking Prices, Apr-24
| Region | Average Asking Price | Monthly % change | Annual % change |
|---|---|---|---|
| Scotland | £226,345 | -0.3% | 1.6% |
| North East | £194,906 | 1.4% | 2.3% |
| Yorks & The Humber | £250,397 | 1.6% | 2.1% |
| England & Wales | £354,588 | 0.9% | 0.8% |
| North West | £268,409 | 0.8% | 4.1% |
| West Midlands | £301,718 | 1.3% | 1.0% |
| East Midlands | £281,548 | 0.7% | -0.9% |
| East | £393,669 | 0.7% | -1.2% |
| Wales | £268,857 | 1.2% | 3.4% |
| Greater London | £541,167 | 0.5% | 0.1% |
| South East | £443,867 | 0.8% | 0.8% |
| South West | £378,308 | 1.7% | -0.2% |
UK Time on Market, Apr-24
| Region | Average Time on Market | Typical Time on Market | Annualised % supply change |
|---|---|---|---|
| Scotland | 201 | 74 | 11% |
| North East | 160 | 77 | 15% |
| Yorks & The Humber | 151 | 77 | 12% |
| England & Wales | 169 | 83 | 12% |
| North West | 168 | 85 | 7% |
| West Midlands | 162 | 81 | 11% |
| East Midlands | 153 | 81 | 13% |
| East | 153 | 75 | 13% |
| Wales | 183 | 111 | 13% |
| Greater London | 195 | 85 | 10% |
| South East | 157 | 75 | 13% |
| South West | 158 | 81 | 15% |
From the director's commentary
"Renewed confidence has put a spring in the step of the market. The recovery is well underway, even in the worst-hit regions where lost ground is steadily being clawed back in the wake of the 14 successive interest rate hikes."
Doug Shephard, Director at Home.co.uk
Read the full April 2024 edition (PDF, 10 pages)
About the Home Asking Price Index
The Home Asking Price Index measures the change in the prices sellers ask for residential property across England, Wales and Scotland. Today it is computed every month from around half a million advertised homes and is mix-adjusted, so a change in what happens to be on the market does not move the figure; earlier editions state the sample they were built from. Because an asking price is set months before a sale completes, the index runs around five months ahead of completed-sale measures such as the UK House Price Index.
Every edition in the archive, back to October 2006, is listed on the index page. How we measure the UK property market explains the listing data behind it, and today's figures by area are on house prices and rental prices.
Text and figures above are quoted from the April 2024 edition as published, with punctuation normalised for the web, and are not revised. Later editions may restate them.
More in What is happening to house prices: the Home guide
Thinking about your next move?
See what your home's worth in seconds, with the UK's longest-running property data behind it.
Get an instant valuation