

























Home Asking Price Index, April 2021: prices rocket as stock hits new low
Asking prices across England and Wales rose 1.8% in the month, taking annual growth to 7.4%, while total stock fell to a record low of 307,892.
This is the April 2021 edition of the Home Asking Price Index, released on 14 April 2021, under the headline:
Prices Rocket as Stock Hits New Low
The headlines and summary below are the report's own words, with the key figures as it published them, followed by the report's charts and regional tables as printed.
Headlines
- Asking prices across England and Wales add 1.8% since last month (the largest monthly rise since May 2007), pushing annualised growth up to 7.4%.
- The total stock of property for sale in England and Wales has fallen again, setting a new all-time low of 307,892, 22.5% lower than in April 2020.
- Monthly supply remains well below expectations in all regions except Greater London where new listings are up 20% compared to March 2019 and up 59% compared to March 2020.
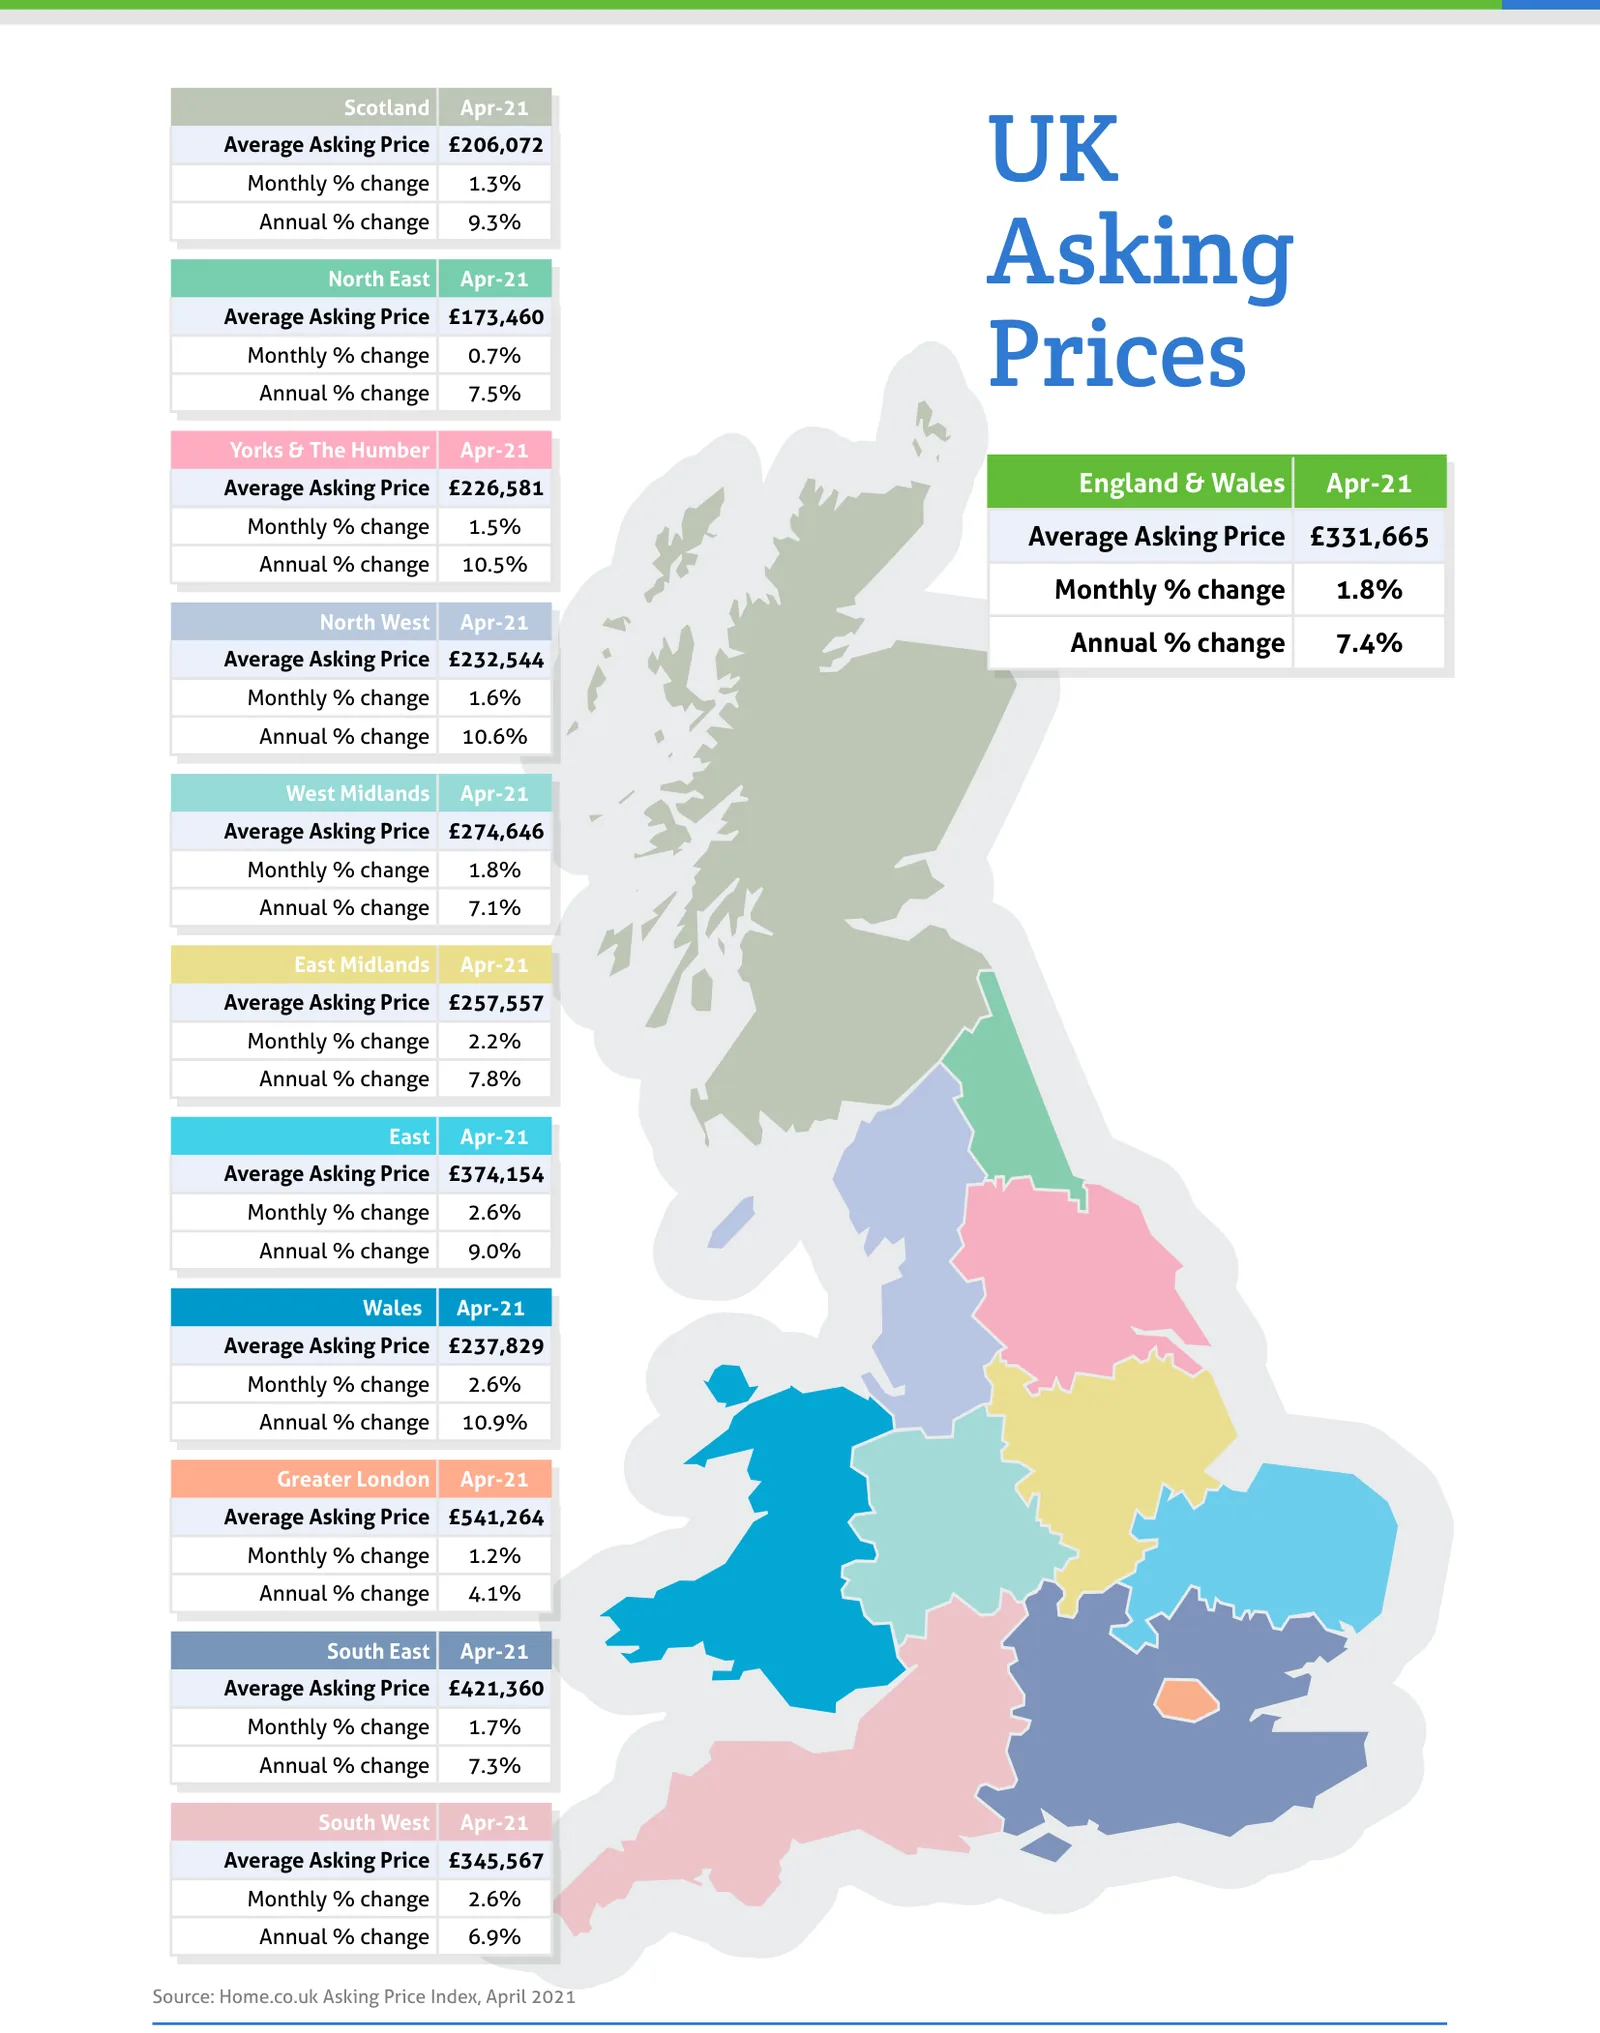
- Renewed demand and lack of supply has forced up prices in every English region and Scotland and Wales since last month, with the largest hikes in the South West, Wales and East of England, all equalling 2.6%.
- The Welsh property market now leads the 12-month regional growth chart at 10.9%, while Yorkshire and the North West lead the English regions with annualised price rises of 10.5% and 10.6% respectively.
- Greater London remains the UK's worst-performing region with 4.1% annualised growth. Next worst is the South West where prices have risen 6.9% over the last twelve months.
- Market momentum has increased rapidly as buyers snap up the little stock available, with the Typical Time on Market for unsold property in England and Wales falling by 27 days since last month to just 86 days. This figure is 15 days less than in April 2020.
- Rents continue to collapse in the Greater London lettings market due to the worsening supply glut, down 17.8% year-on-year, while several central boroughs register reductions in average rent greater than 20%.
- Contrastingly, acute scarcity of available rental property is evident in all other English regions, Scotland and Wales, thereby driving up rents. By way of example, 40% fewer rental properties in the South West entered the market last month compared to a year ago.
- The largest annualised average rent hikes are in the North West (+11.1%) and the South West (+12.6%).
Summary
The current state of the UK market shows vast disparities at the regional level, chiefly between Greater London and the rest of the UK. Fundamental differences in the supply/demand dynamic due to the COVID pandemic have translated into a two-speed market. On the one hand, London prices are suffering from oversupply and lack of demand, while prices in the remaining English regions, Scotland and Wales are soaring due to scarcity and pumped-up demand.
Asking prices outside of London are going berserk as demand completely overwhelms the little supply there is. The twin stimulus measures of the extended Stamp Duty holiday (till the end of June) and government-backed 95% mortgages are having a dangerously destabilising effect on home prices in regional markets plagued by lack of supply.
Key figures
| Measure | Figure |
|---|---|
| Monthly asking price change | +1.8% |
| Annual asking price growth | +7.4% |
| Total unsold stock | 307,892 |
| Stock change year-on-year | -22.5% |
| Typical Time on Market | 86 days |
| Change in Typical Time on Market since last month | -27 days |
| New instructions vs two years ago (UK average) | -25% |
| Stock vs record high (May 2008) | -65% |
Figures are for England and Wales unless the report states otherwise, as published in the edition.
Charts from the report
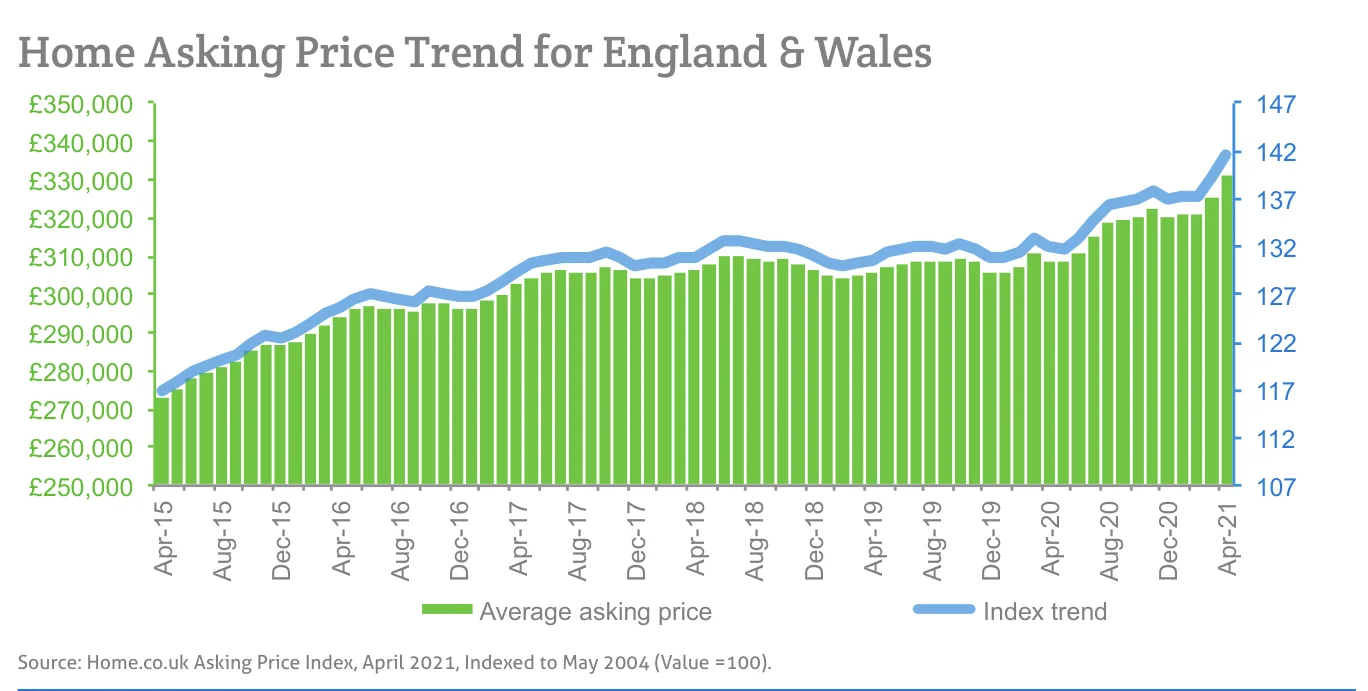
Source: Home.co.uk Asking Price Index, April 2021, Indexed to May 2004 (Value =100).
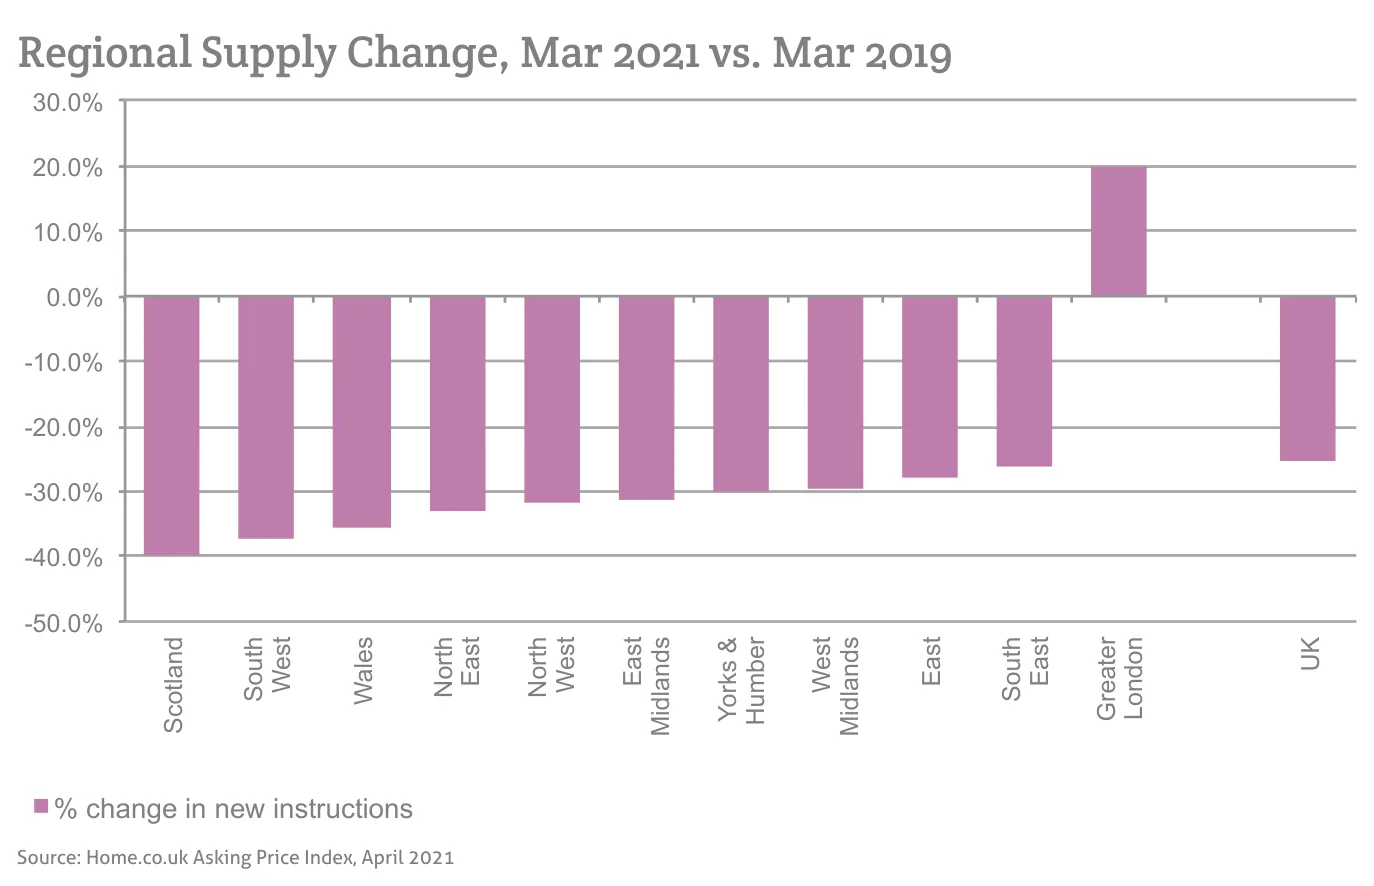
Source: Home.co.uk Asking Price Index, April 2021
Source: Home.co.uk Asking Price Index, April 2021
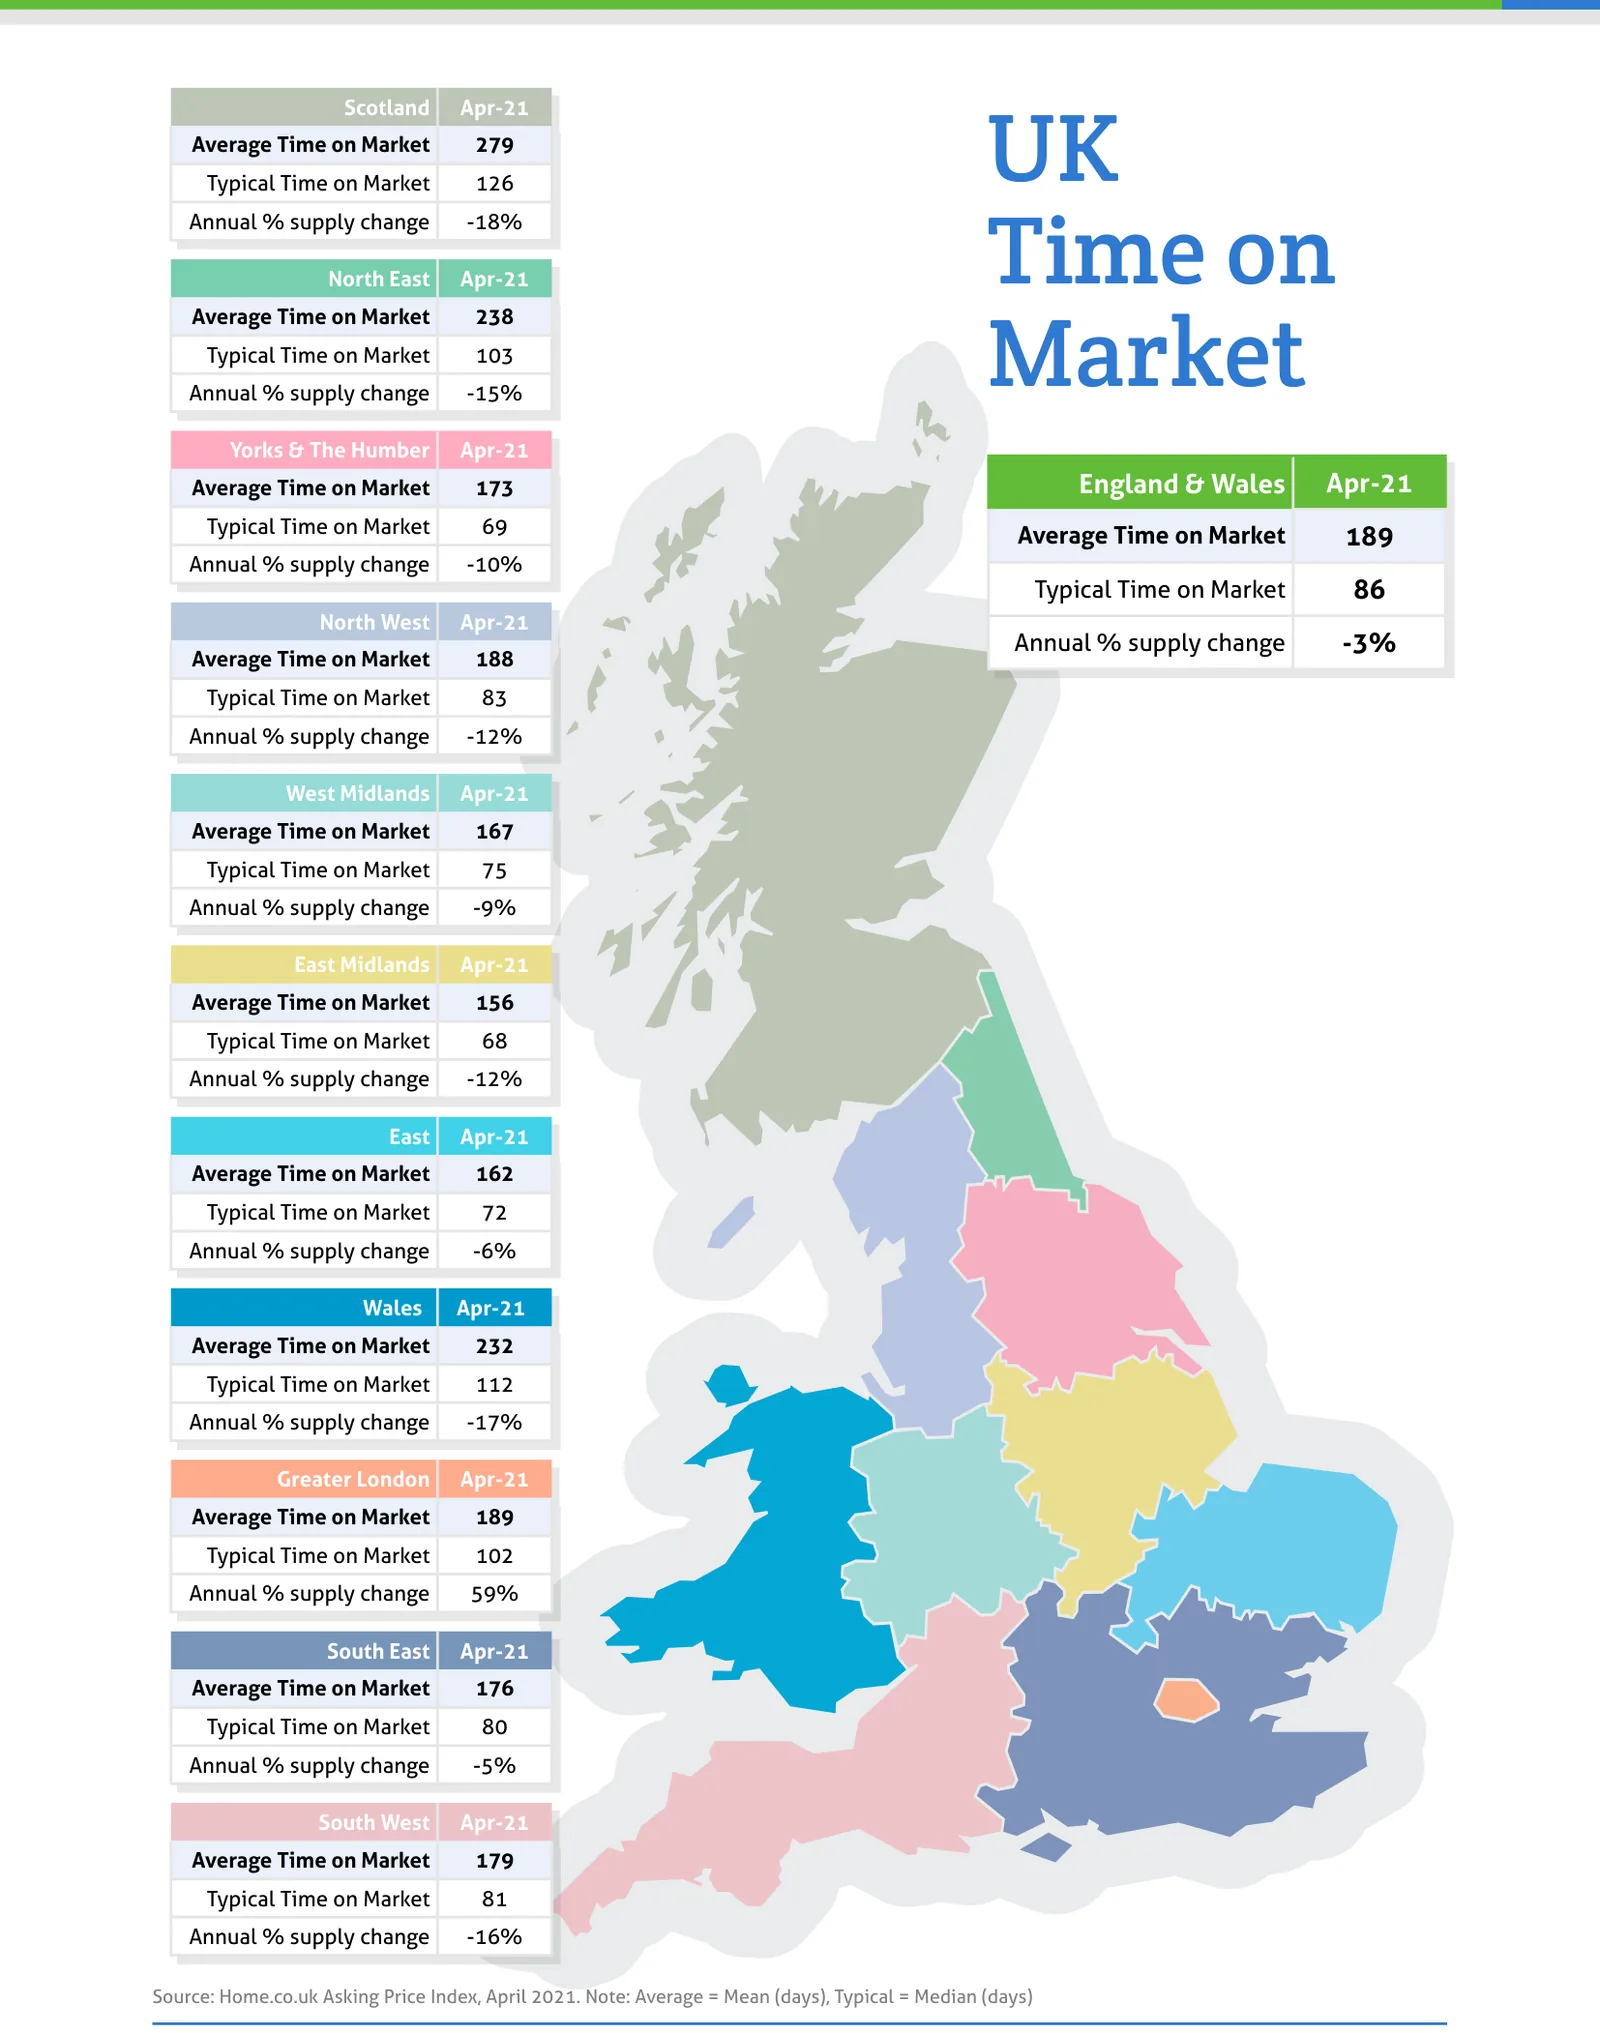
Source: Home.co.uk Asking Price Index, April 2021. Note: Average = Mean (days), Typical = Median (days)
Regional tables
UK Asking Prices, Apr-21
| Region | Average Asking Price | Monthly % change | Annual % change |
|---|---|---|---|
| Scotland | £206,072 | 1.3% | 9.3% |
| North East | £173,460 | 0.7% | 7.5% |
| Yorks & The Humber | £226,581 | 1.5% | 10.5% |
| England & Wales | £331,665 | 1.8% | 7.4% |
| North West | £232,544 | 1.6% | 10.6% |
| West Midlands | £274,646 | 1.8% | 7.1% |
| East Midlands | £257,557 | 2.2% | 7.8% |
| East | £374,154 | 2.6% | 9.0% |
| Wales | £237,829 | 2.6% | 10.9% |
| Greater London | £541,264 | 1.2% | 4.1% |
| South East | £421,360 | 1.7% | 7.3% |
| South West | £345,567 | 2.6% | 6.9% |
UK Time on Market, Apr-21
| Region | Average Time on Market | Typical Time on Market | Annual % supply change |
|---|---|---|---|
| Scotland | 279 | 126 | -18% |
| North East | 238 | 103 | -15% |
| Yorks & The Humber | 173 | 69 | -10% |
| England & Wales | 189 | 86 | -3% |
| North West | 188 | 83 | -12% |
| West Midlands | 167 | 75 | -9% |
| East Midlands | 156 | 68 | -12% |
| East | 162 | 72 | -6% |
| Wales | 232 | 112 | -17% |
| Greater London | 189 | 102 | 59% |
| South East | 176 | 80 | -5% |
| South West | 179 | 81 | -16% |
From the director's commentary
"We're monitoring a market on steroids. With regions such as the North West, Yorkshire and Wales already showing price growth in the double figures, it would appear that the additional twin government stimulus is having the desired effect on the UK property market."
Doug Shephard, Director at Home.co.uk
Read the full April 2021 edition (PDF, 7 pages)
About the Home Asking Price Index
The Home Asking Price Index measures the change in the prices sellers ask for residential property across England, Wales and Scotland. Today it is computed every month from around half a million advertised homes and is mix-adjusted, so a change in what happens to be on the market does not move the figure; earlier editions state the sample they were built from. Because an asking price is set months before a sale completes, the index runs around five months ahead of completed-sale measures such as the UK House Price Index.
Every edition in the archive, back to October 2006, is listed on the index page. How we measure the UK property market explains the listing data behind it, and today's figures by area are on house prices and rental prices.
Text and figures above are quoted from the April 2021 edition as published, with punctuation normalised for the web, and are not revised. Later editions may restate them.
More in What is happening to house prices: the Home guide
Thinking about your next move?
See what your home's worth in seconds, with the UK's longest-running property data behind it.
Get an instant valuation