

























Home Asking Price Index, April 2020: UK home market paralysed by lockdown
New sales instructions across the UK fell 23% year-on-year in April 2020 as the COVID-19 lockdown froze the housing market and average prices dipped 0.6%.
This is the April 2020 edition of the Home Asking Price Index, released on 15 April 2020, under the headline:
UK Home Market Paralysed by Lockdown
The headlines and summary below are the report's own words, with the key figures as it published them, followed by the report's charts and regional tables as printed.
Headlines
- Supply of new sales instructions plummets across the UK (down 23% year-on-year) as the COVID-19 lockdown thwarts activity.
- The largest regional fall in the number of new instructions year-on-year is in Scotland, followed by London and the South West.
- Home prices slip 0.6% month-on-month as fewer, perhaps more desperate, vendors list their properties.
- Owing to the pandemic, the average Time on Market for sales properties in England and Wales has begun to rise when normally it falls as springtime confidence surges.
- The North West and Wales remain atop the regional growth table, both with year-on-year price hikes of 4.3%.
- The total sales stock across England and Wales is now shrinking even more quickly; down by 13.0% year-on-year.
- For the time being, East of England remains the UK's worst-performing region with the average asking price just 0.7% lower than twelve months ago.
- A bad situation turns catastrophic for the rental sector, already suffering shortages, as the supply of newly available rental property across the UK plummets 23% year-on-year.
- Competition for the dwindling number of available properties to let has driven up the mix-adjusted average rent in Greater London by 9.0% in just twelve months.
Summary
The lockdown imposed to curb the spread of the COVID-19 virus has frozen the housing market. Estate agent offices are closed until further notice. Hence, new listings have fallen off a cliff. Moreover, price movements in such times are essentially meaningless and forecasts of falling prices are premature to say the least. As in any market, price information is only representative when a certain threshold of transactions has been surpassed.
However, for the time being, both supply and demand have essentially ceased. Only once the COVID-19 pandemic has ended will we see a return of both demand and supply. Demand, being chiefly credit based, looks set to return more quickly but the resurgence of supply may well be slower and start from very low levels. We do not yet know when the market will have the all clear to proceed, but, when it does, the imbalance between future supply and demand will have clear implications for significant upward price adjustments. Moreover, investors burned by the stock market will be looking for safer investments post-pandemic and this will boost demand even further.
Key figures
| Measure | Figure |
|---|---|
| Average asking price (England & Wales) | £308,897 |
| Monthly change (England & Wales) | -0.6% |
| Annual change (England & Wales) | 1.8% |
| Total sales stock change (England & Wales, YoY) | -13.0% |
| New sales instructions (UK, YoY) | -23% |
| New rental supply (UK, YoY) | -23% |
| Average rent growth (Greater London, YoY) | +9.0% |
Figures are for England and Wales unless the report states otherwise, as published in the edition.
Charts from the report
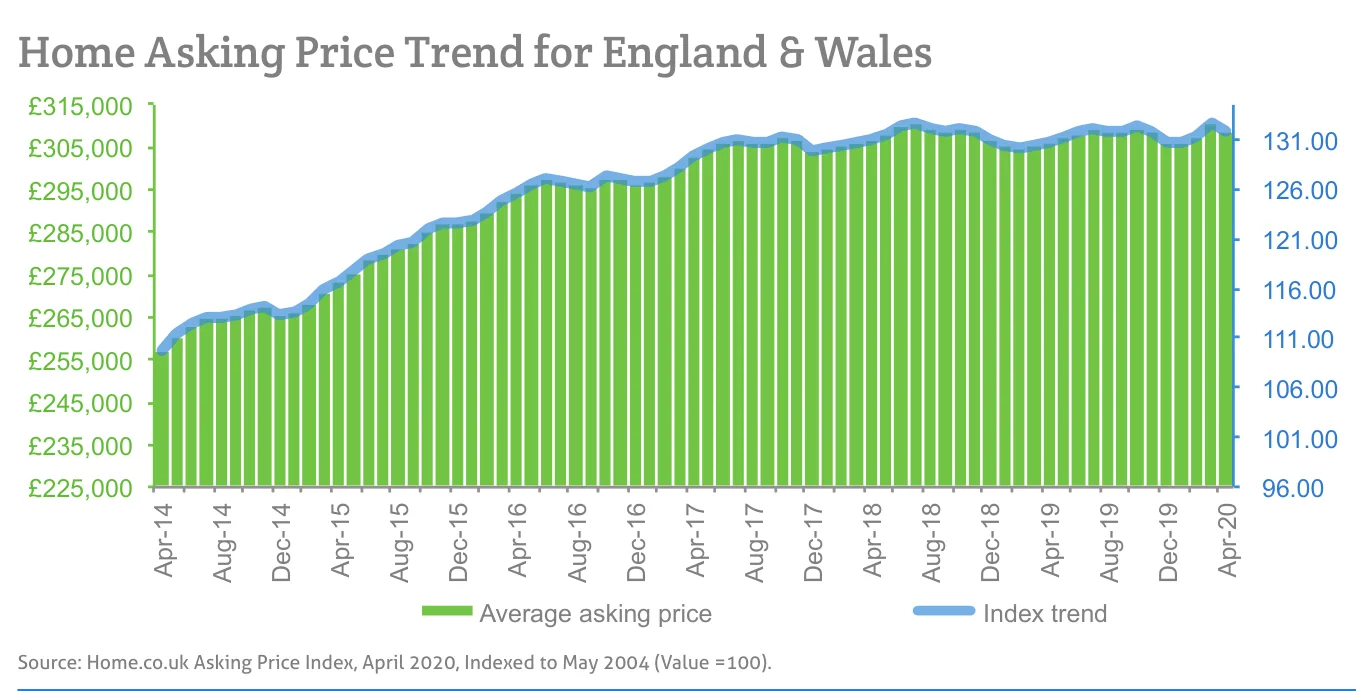
Source: Home.co.uk Asking Price Index, April 2020, Indexed to May 2004 (Value =100).
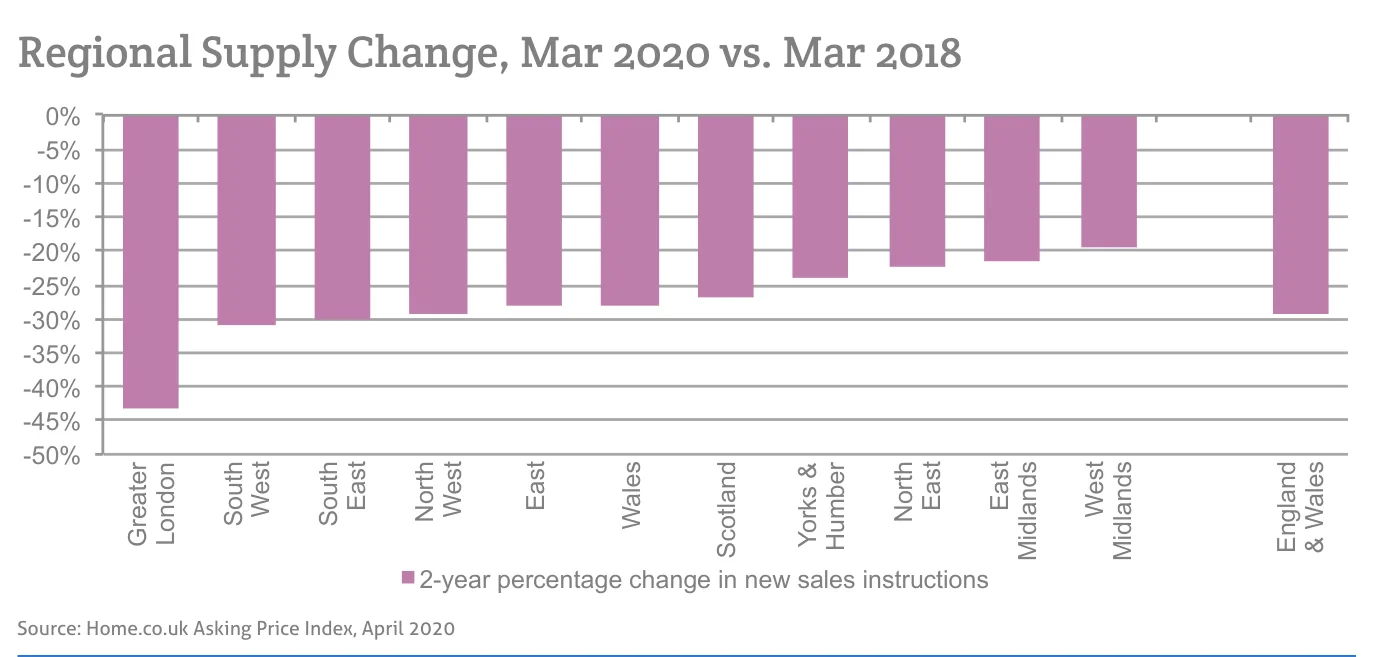
Source: Home.co.uk Asking Price Index, April 2020
Source: Home.co.uk Asking Price Index, April 2020
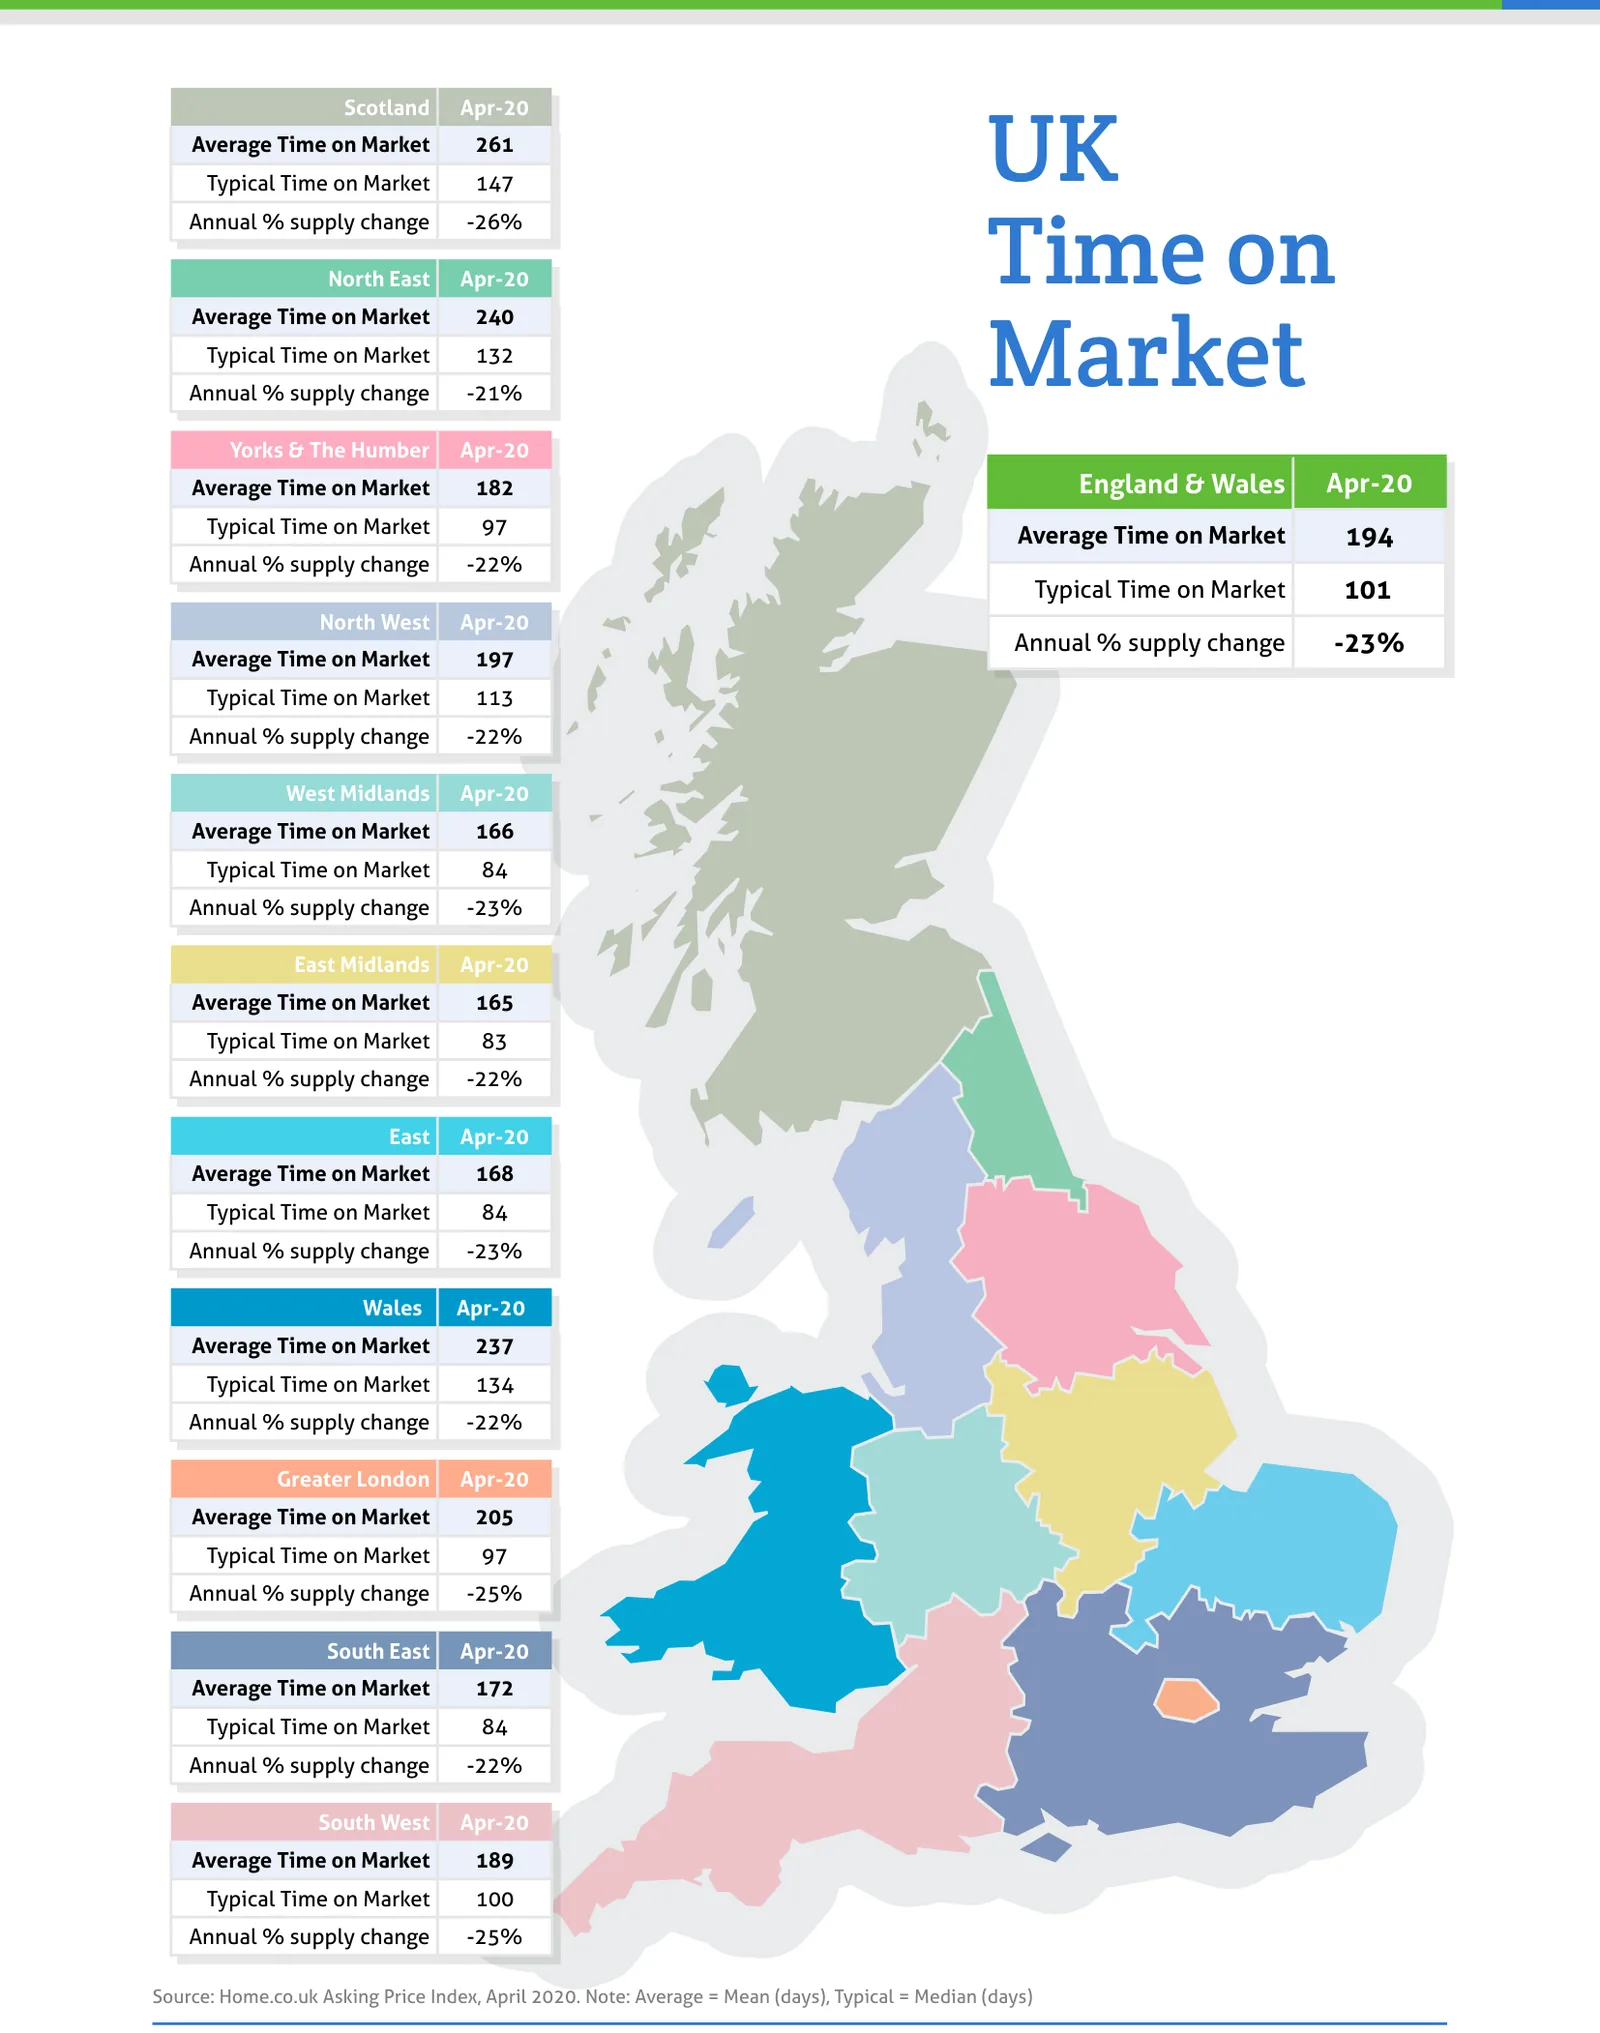
Source: Home.co.uk Asking Price Index, April 2020. Note: Average = Mean (days), Typical = Median (days)
Regional tables
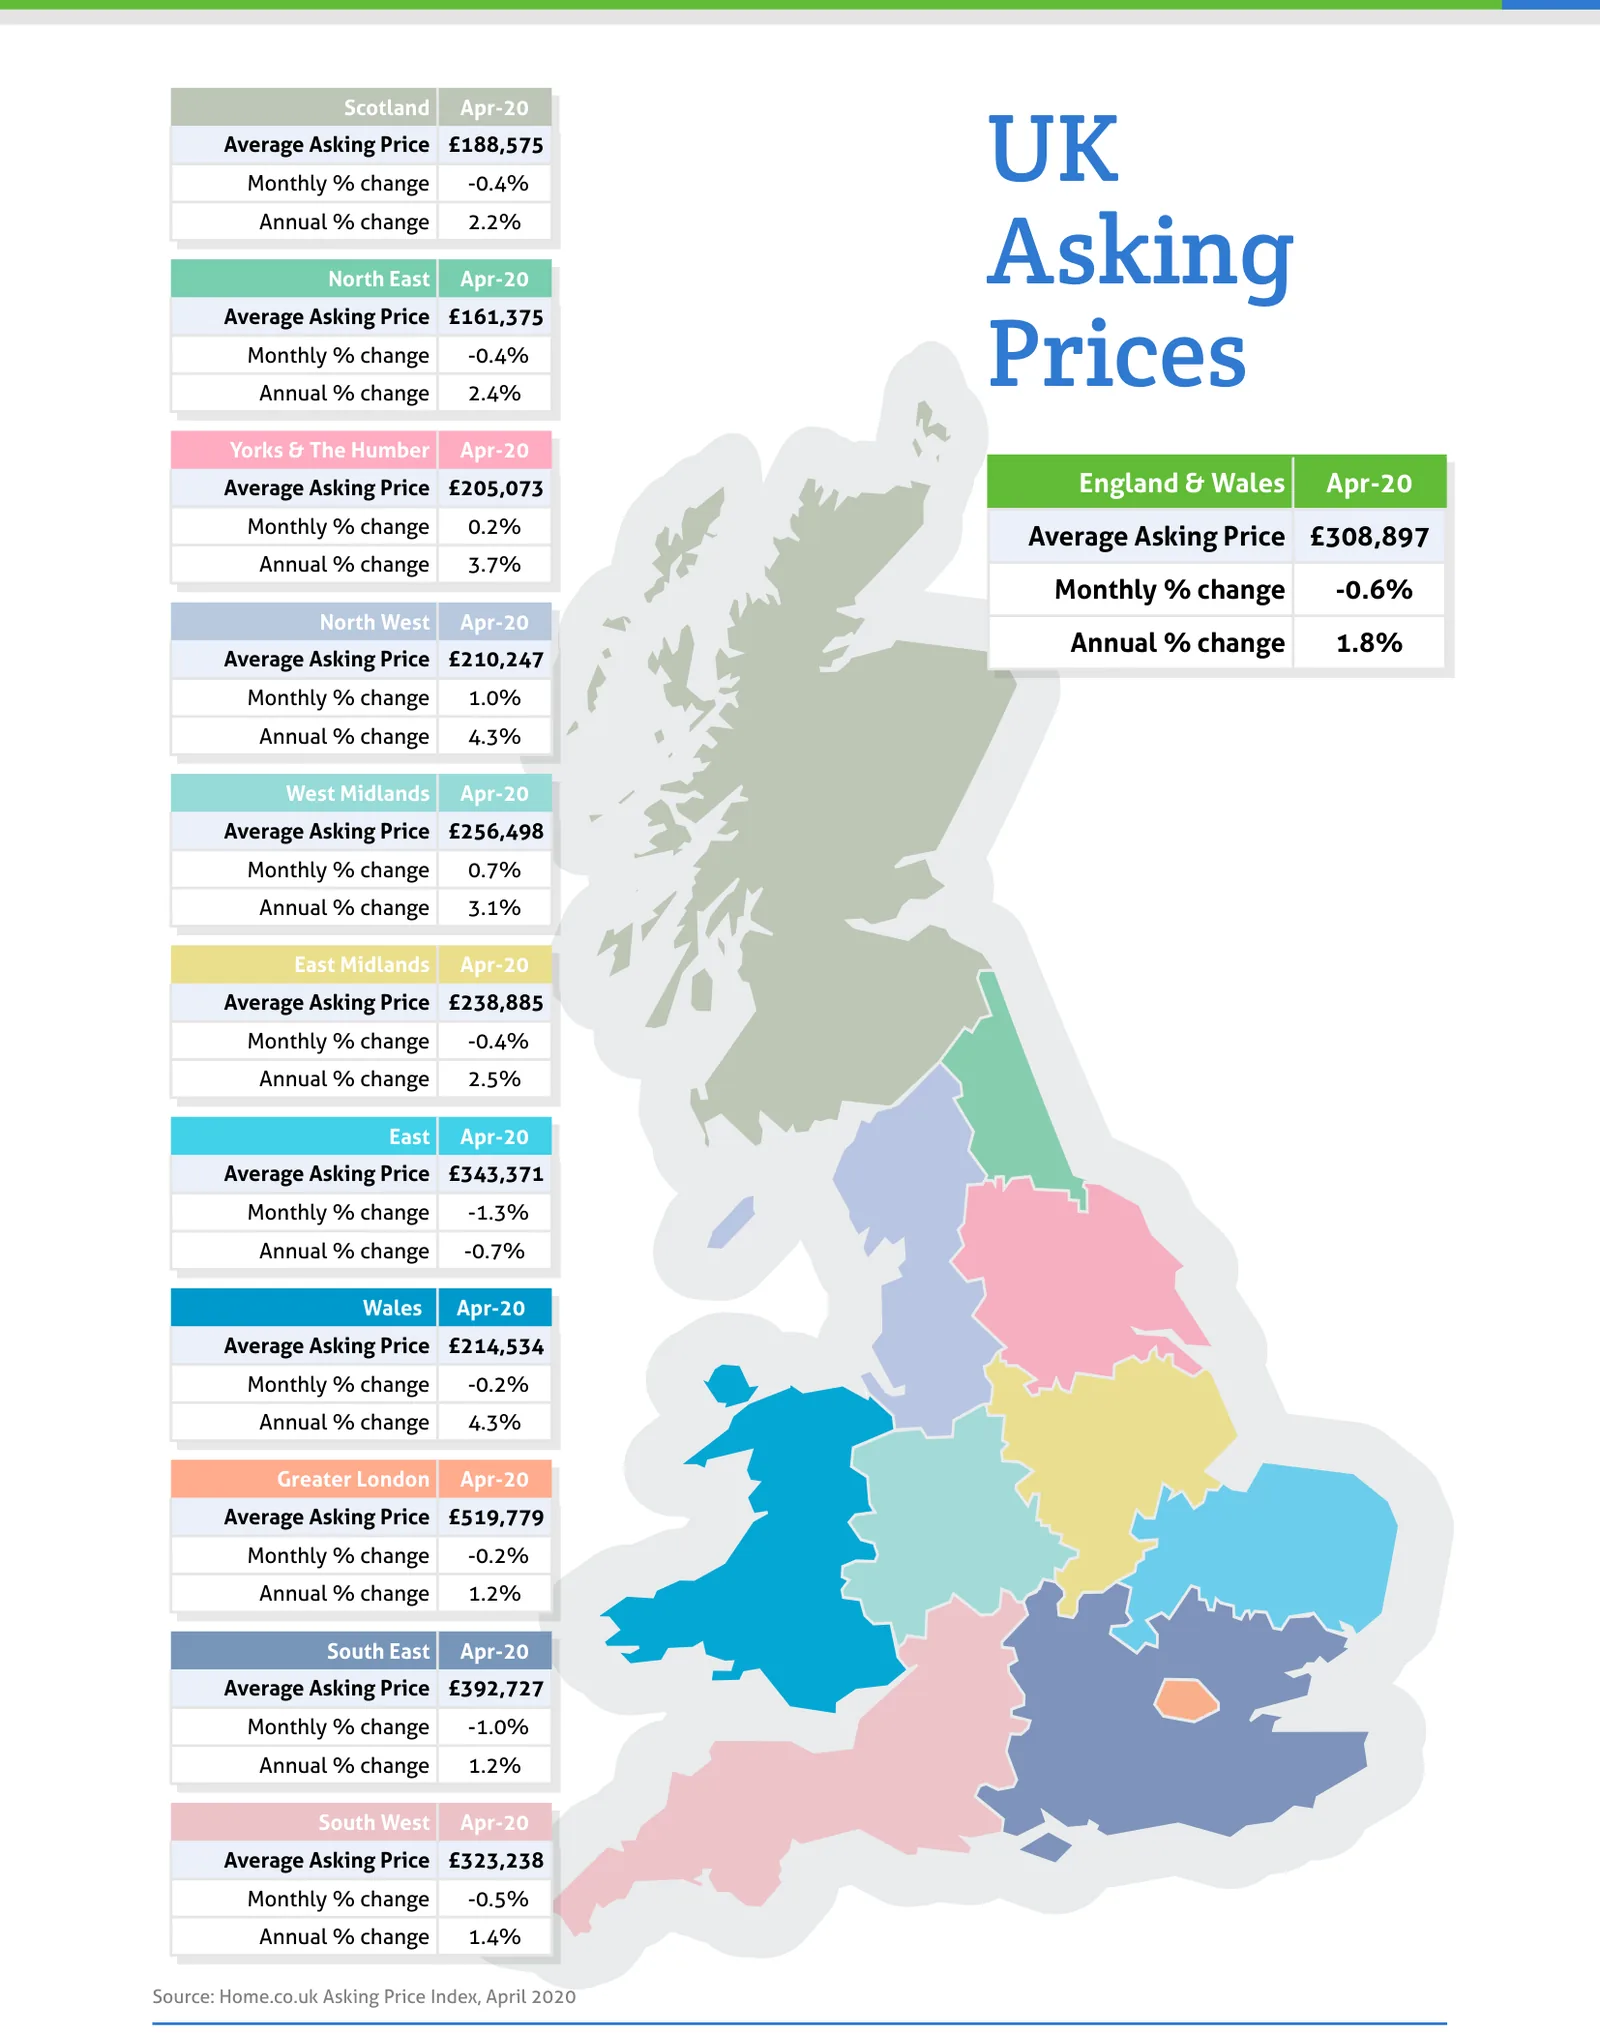
UK Asking Prices, Apr-20
| Region | Average Asking Price | Monthly % change | Annual % change |
|---|---|---|---|
| Scotland | £188,575 | -0.4% | 2.2% |
| North East | £161,375 | -0.4% | 2.4% |
| Yorks & The Humber | £205,073 | 0.2% | 3.7% |
| England & Wales | £308,897 | -0.6% | 1.8% |
| North West | £210,247 | 1.0% | 4.3% |
| West Midlands | £256,498 | 0.7% | 3.1% |
| East Midlands | £238,885 | -0.4% | 2.5% |
| East | £343,371 | -1.3% | -0.7% |
| Wales | £214,534 | -0.2% | 4.3% |
| Greater London | £519,779 | -0.2% | 1.2% |
| South East | £392,727 | -1.0% | 1.2% |
| South West | £323,238 | -0.5% | 1.4% |
UK Time on Market, Apr-20
| Region | Average Time on Market | Typical Time on Market | Annual % supply change |
|---|---|---|---|
| Scotland | 261 | 147 | -26% |
| North East | 240 | 132 | -21% |
| Yorks & The Humber | 182 | 97 | -22% |
| England & Wales | 194 | 101 | -23% |
| North West | 197 | 113 | -22% |
| West Midlands | 166 | 84 | -23% |
| East Midlands | 165 | 83 | -22% |
| East | 168 | 84 | -23% |
| Wales | 237 | 134 | -22% |
| Greater London | 205 | 97 | -25% |
| South East | 172 | 84 | -22% |
| South West | 189 | 100 | -25% |
From the director's commentary
"Some plans for a new home, of course, will simply be postponed but till when? We look optimistically to Q3 for a possible recovery given that Wuhan, the Chinese city where the virus emerged, has ended lockdown after just over two months."
Doug Shephard, Director at Home.co.uk
Read the full April 2020 edition (PDF, 6 pages)
About the Home Asking Price Index
The Home Asking Price Index measures the change in the prices sellers ask for residential property across England, Wales and Scotland. Today it is computed every month from around half a million advertised homes and is mix-adjusted, so a change in what happens to be on the market does not move the figure; earlier editions state the sample they were built from. Because an asking price is set months before a sale completes, the index runs around five months ahead of completed-sale measures such as the UK House Price Index.
Every edition in the archive, back to October 2006, is listed on the index page. How we measure the UK property market explains the listing data behind it, and today's figures by area are on house prices and rental prices.
Text and figures above are quoted from the April 2020 edition as published, with punctuation normalised for the web, and are not revised. Later editions may restate them.
More in What is happening to house prices: the Home guide
Thinking about your next move?
See what your home's worth in seconds, with the UK's longest-running property data behind it.
Get an instant valuation