 Buy
 Rent
 Sell
 New
 Prices





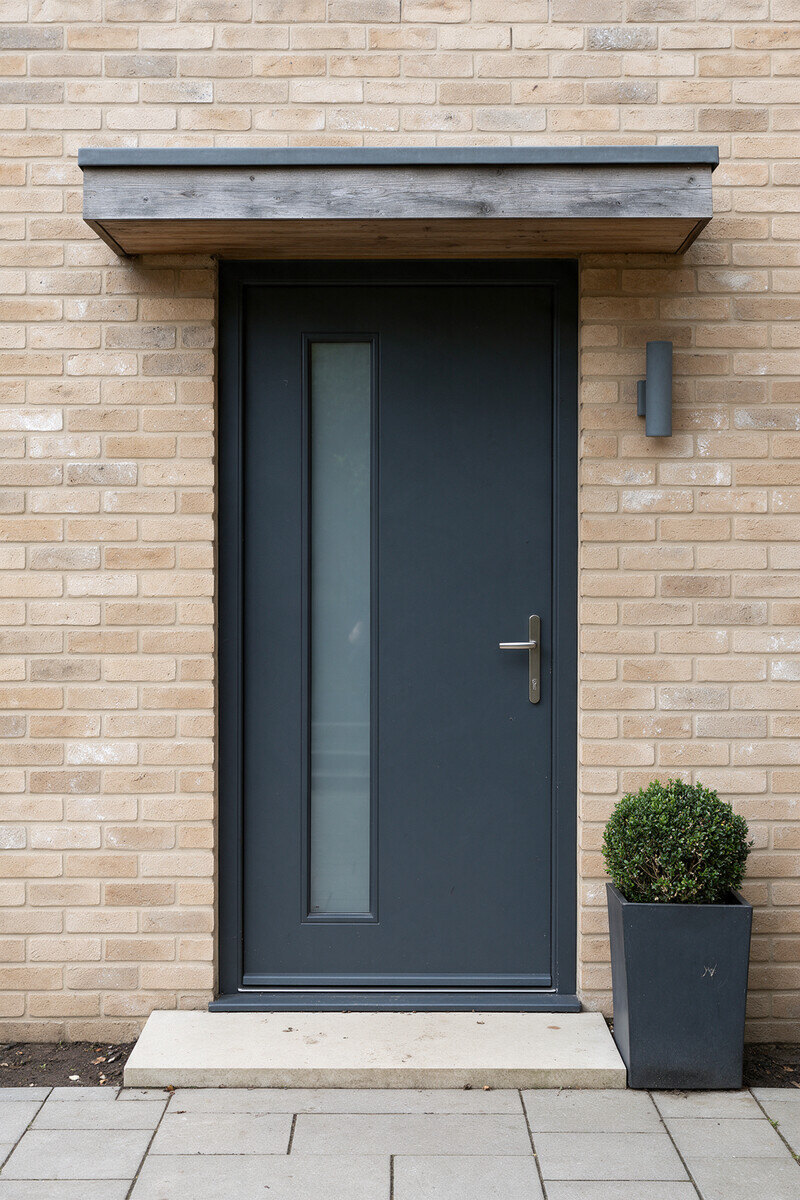
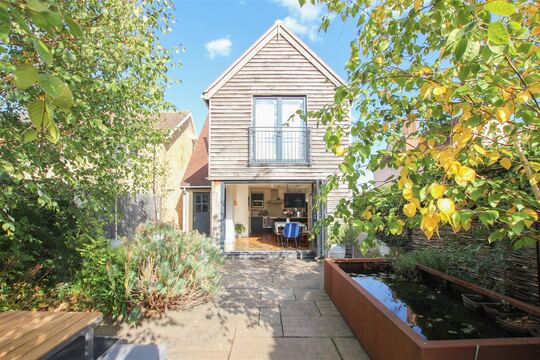
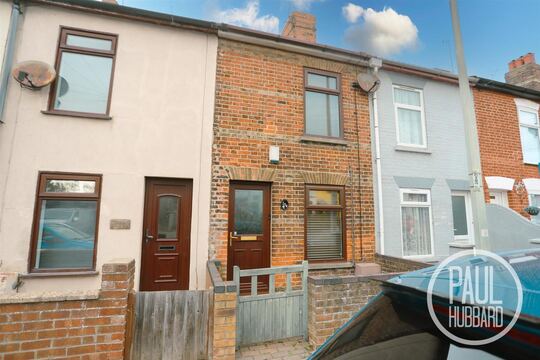
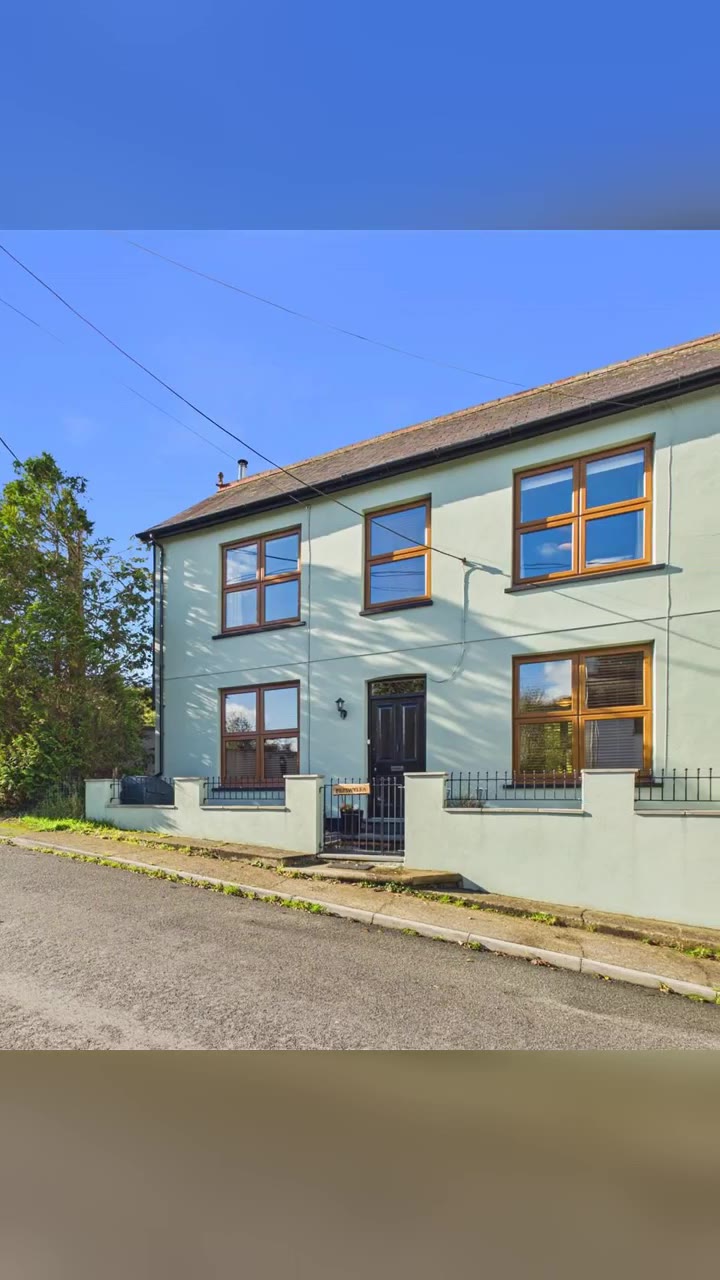

House Prices in KY8
Live asking prices — data to 5 November 2026, updated daily
Properties for Sale
257
16 new in last 14 days
Average Price
£205,366
Median £165,000
Avg. Time on Market
128 days
Median 90 days
Price Range
£54k to £456k
Middle 90% of asking prices
Market Breakdown
Data to:
Properties by Price
Distribution of asking prices in KY8
Properties by Type
What's on the market in KY8
Properties by Bedrooms
Bedroom count distribution in KY8
Time on Market
How long properties have been listed in KY8
Prices by Property Type in KY8
| Type | Count | Avg. Price | Median | Avg. Days |
|---|---|---|---|---|
| Flat | 63 | £93,822 | £79,000 | 96 |
| Terraced | 46 | £166,213 | £152,000 | 102 |
| Semi-Detached | 36 | £182,819 | £179,000 | 82 |
| Detached | 44 | £419,405 | £349,498 | 172 |
Prices by Bedrooms in KY8
| Bedrooms | Count | Avg. Price | Median | Avg. Days |
|---|---|---|---|---|
| 1 Bed | 11 | £91,454 | £70,000 | 107 |
| 2 Bed | 88 | £118,835 | £109,975 | 94 |
| 3 Bed | 84 | £193,402 | £187,500 | 112 |
| 4 Bed | 41 | £359,510 | £300,000 | 116 |
| 5+ Bed | 14 | £581,138 | £440,000 | 291 |
Properties by Price Range in KY8
| Price Range | Count | Avg. Days on Market | Share |
|---|---|---|---|
| Under £100k | 61 | 115 |
|
| £100k – £200k | 102 | 116 |
|
| £200k – £300k | 48 | 126 |
|
| £300k – £400k | 29 | 117 |
|
| £400k – £500k | 6 | 315 |
|
| £500k – £1M | 9 | 218 |
|
| Over £1M | 2 | 346 |
|
Properties by Time on Market in KY8
| Duration | Count | Share |
|---|---|---|
| Less than 1 month | 39 |
|
| 1 – 2 months | 55 |
|
| 2 – 3 months | 33 |
|
| 3 – 4 months | 28 |
|
| 4 – 6 months | 49 |
|
| 6 – 9 months | 32 |
|
| 9 – 12 months | 6 |
|
| 12 – 18 months | 8 |
|
| Over 18 months | 5 |
|
More Market Data for KY8
Asking Price Trends
How asking prices have changed over the last 12 months
Time on Market Trends
How long properties have been sitting unsold over time
Selling Prices
Actual sold prices from Land Registry records
Time to Sell
How long each property type takes to sell
Sold Prices by Month
Monthly breakdown of completed sales
Browse Properties
See all 257 properties currently for sale
Related Resources for KY8
Search Another Location
Find house price data for any UK town, city, or postcode