 Buy
 Rent
 Sell
 New
 Prices





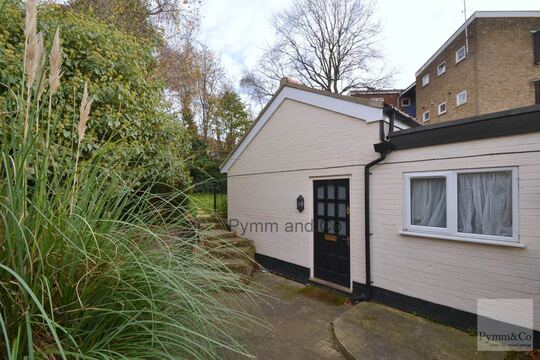
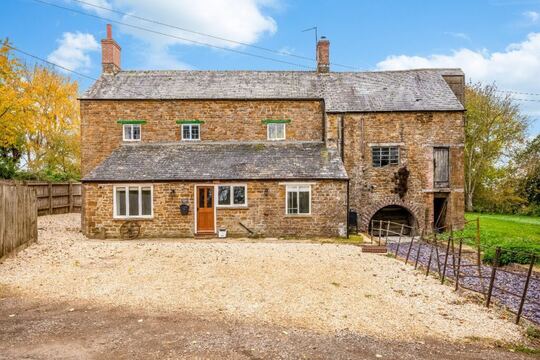
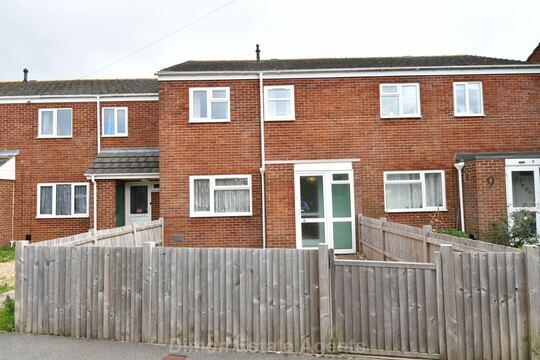

Time to Sell in NG3
How long properties take from listing to completion
Selling times for homes in NG3 based on properties that reached a sold status in the last 90 days. This is distinct from time on market as only completed sales are included.
Properties Sold
37
Average Selling Time
226 days
Median Selling Time
185 days
By Price Band
Average days to sell by asking price
By Property Type
Average days to sell by type
By Bedrooms
Average days to sell by bedroom count
Selling Times by Price Band
| Price Range | Properties | Avg. Days | Median |
|---|---|---|---|
| Under £100k | 1 | 441 days | 441 days |
| £100k – £200k | 13 | 233 days | 185 days |
| £200k – £300k | 9 | 205 days | 190 days |
| £300k – £400k | 8 | 254 days | 224 days |
| £400k – £500k | 5 | 150 days | 158 days |
| £500k – £1M | 1 | 176 days | 176 days |
Selling Times by Property Type
| Type | Properties | Avg. Days | Median |
|---|---|---|---|
| Flat | 8 | 252 days | 180 days |
| Semi-Detached | 7 | 222 days | 212 days |
| Detached | 9 | 207 days | 169 days |
Selling Times by Bedrooms
| Bedrooms | Properties | Avg. Days | Median |
|---|---|---|---|
| 1 Bed | 1 | 441 days | 441 days |
| 2 Bed | 13 | 229 days | 180 days |
| 3 Bed | 13 | 172 days | 166 days |
| 4 Bed | 10 | 272 days | 226 days |
Based on properties marked as sold in the last 90 days within the NG3 area.