

























Home Asking Price Index, March 2026: spring optimism lifts prices
England and Wales asking prices rose 0.6% in February, though annual growth stayed weak while unsold stock and marketing times both eased slightly.
This is the March 2026 edition of the Home Asking Price Index, released on 15 March 2026, under the headline:
Spring Optimism Lifts Prices
The headlines and summary below are the report's own words, with the key figures as it published them, followed by the report's charts and regional tables as printed.
Headlines
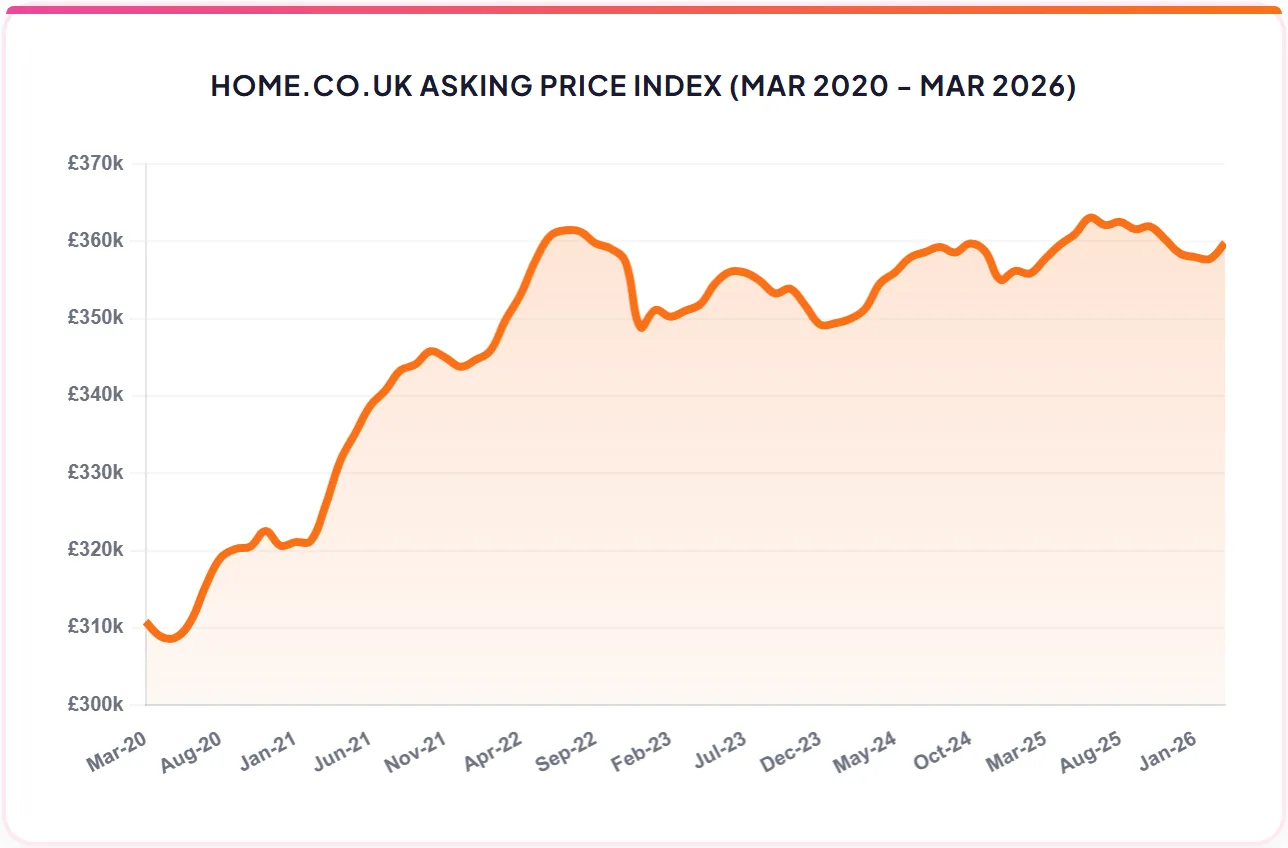
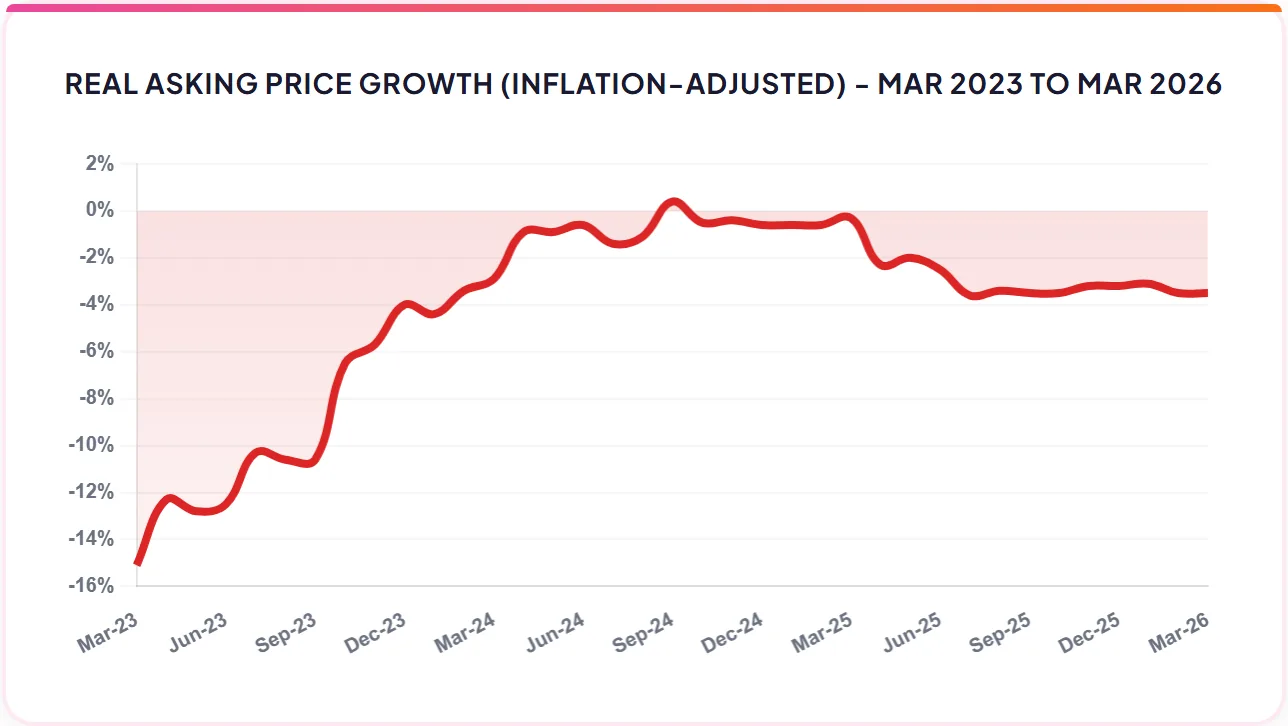
- The mix-adjusted average home price for England and Wales jumped 0.6% during February. Annualised growth, however, remains poor at a mere 0.6% higher than in March 2025.
- Typical Time on Market (TToM) for unsold properties in England and Wales reduced last month but remains six days higher than in March 2025. Marketing times for unsold property are at a 5-year high. The worst increases year-on-year continue to be found in London and the South West.
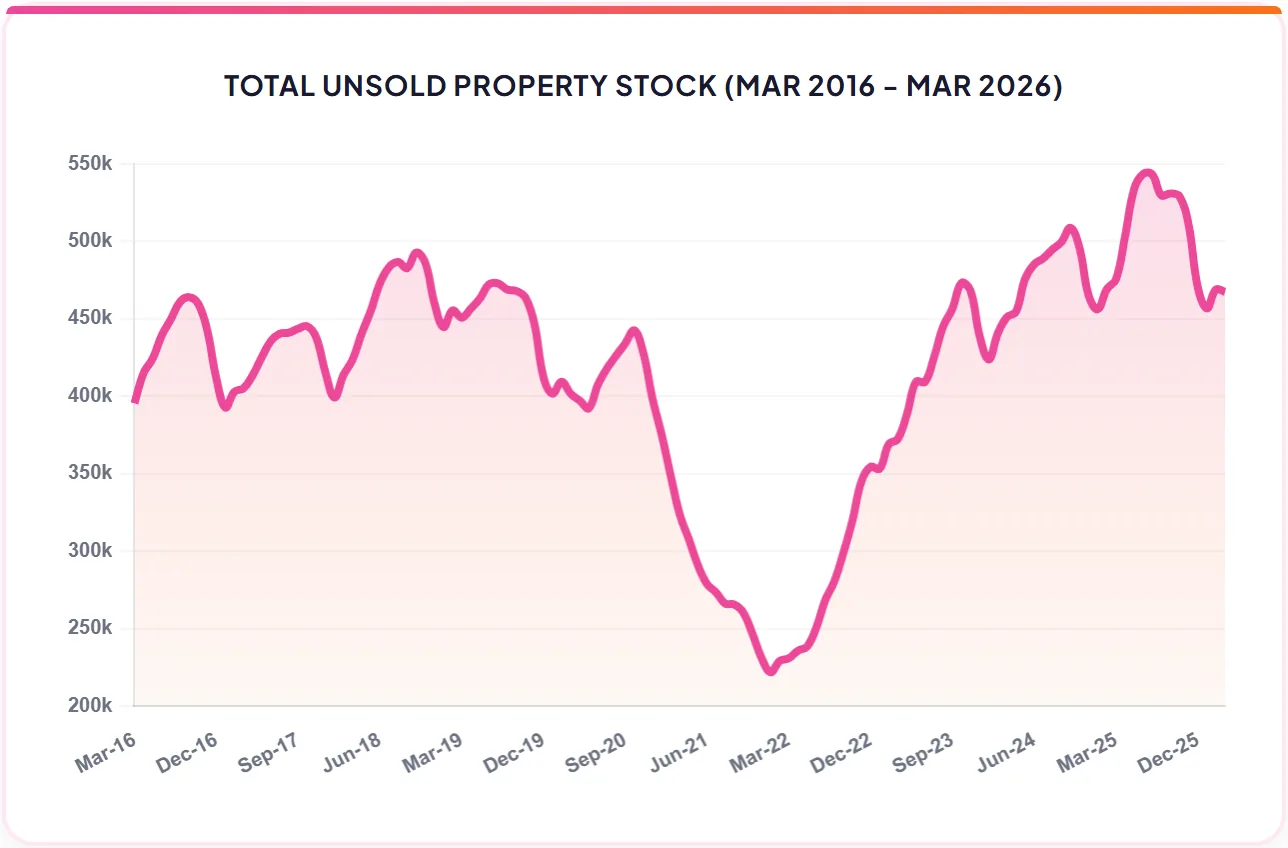
- An unexpected drop in stock levels occurred during February. Counter to seasonal expectations, the total unsold stock on the market nudged down by 0.3%. The current sum of agents' portfolios now sits 1.7% lower than in March 2025. This positive development partly justifies some of the upward price action.
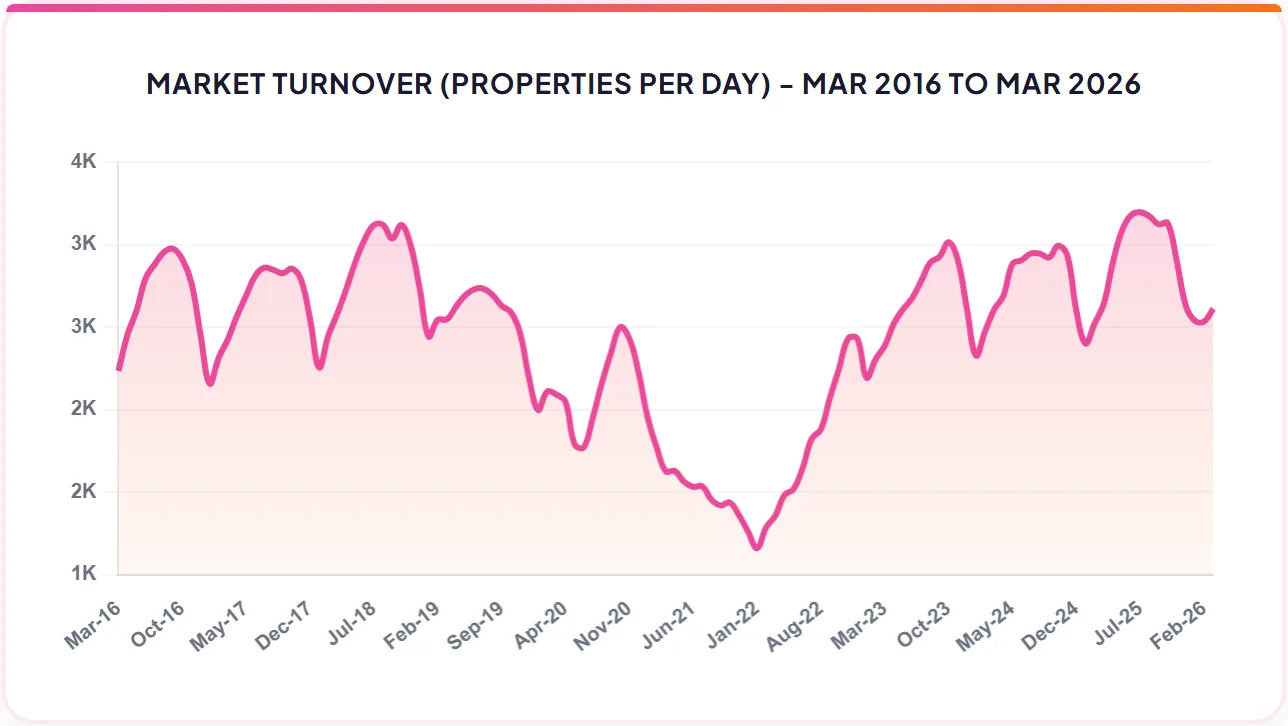
- The total number of new instructions in February came in at 1% less than in February 2025. The most significant year-on-year reductions of new sales listings were in the North West and Wales (5% and 6% respectively).
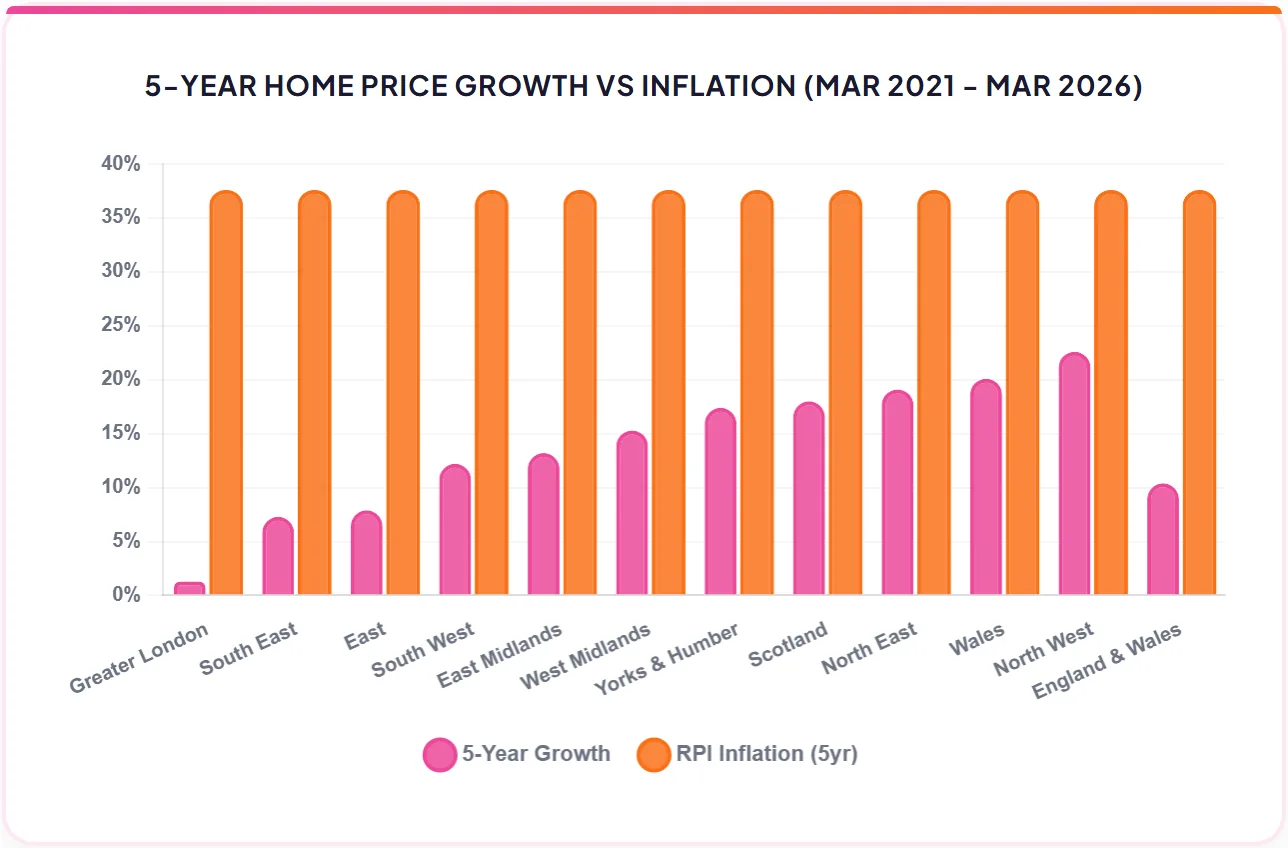
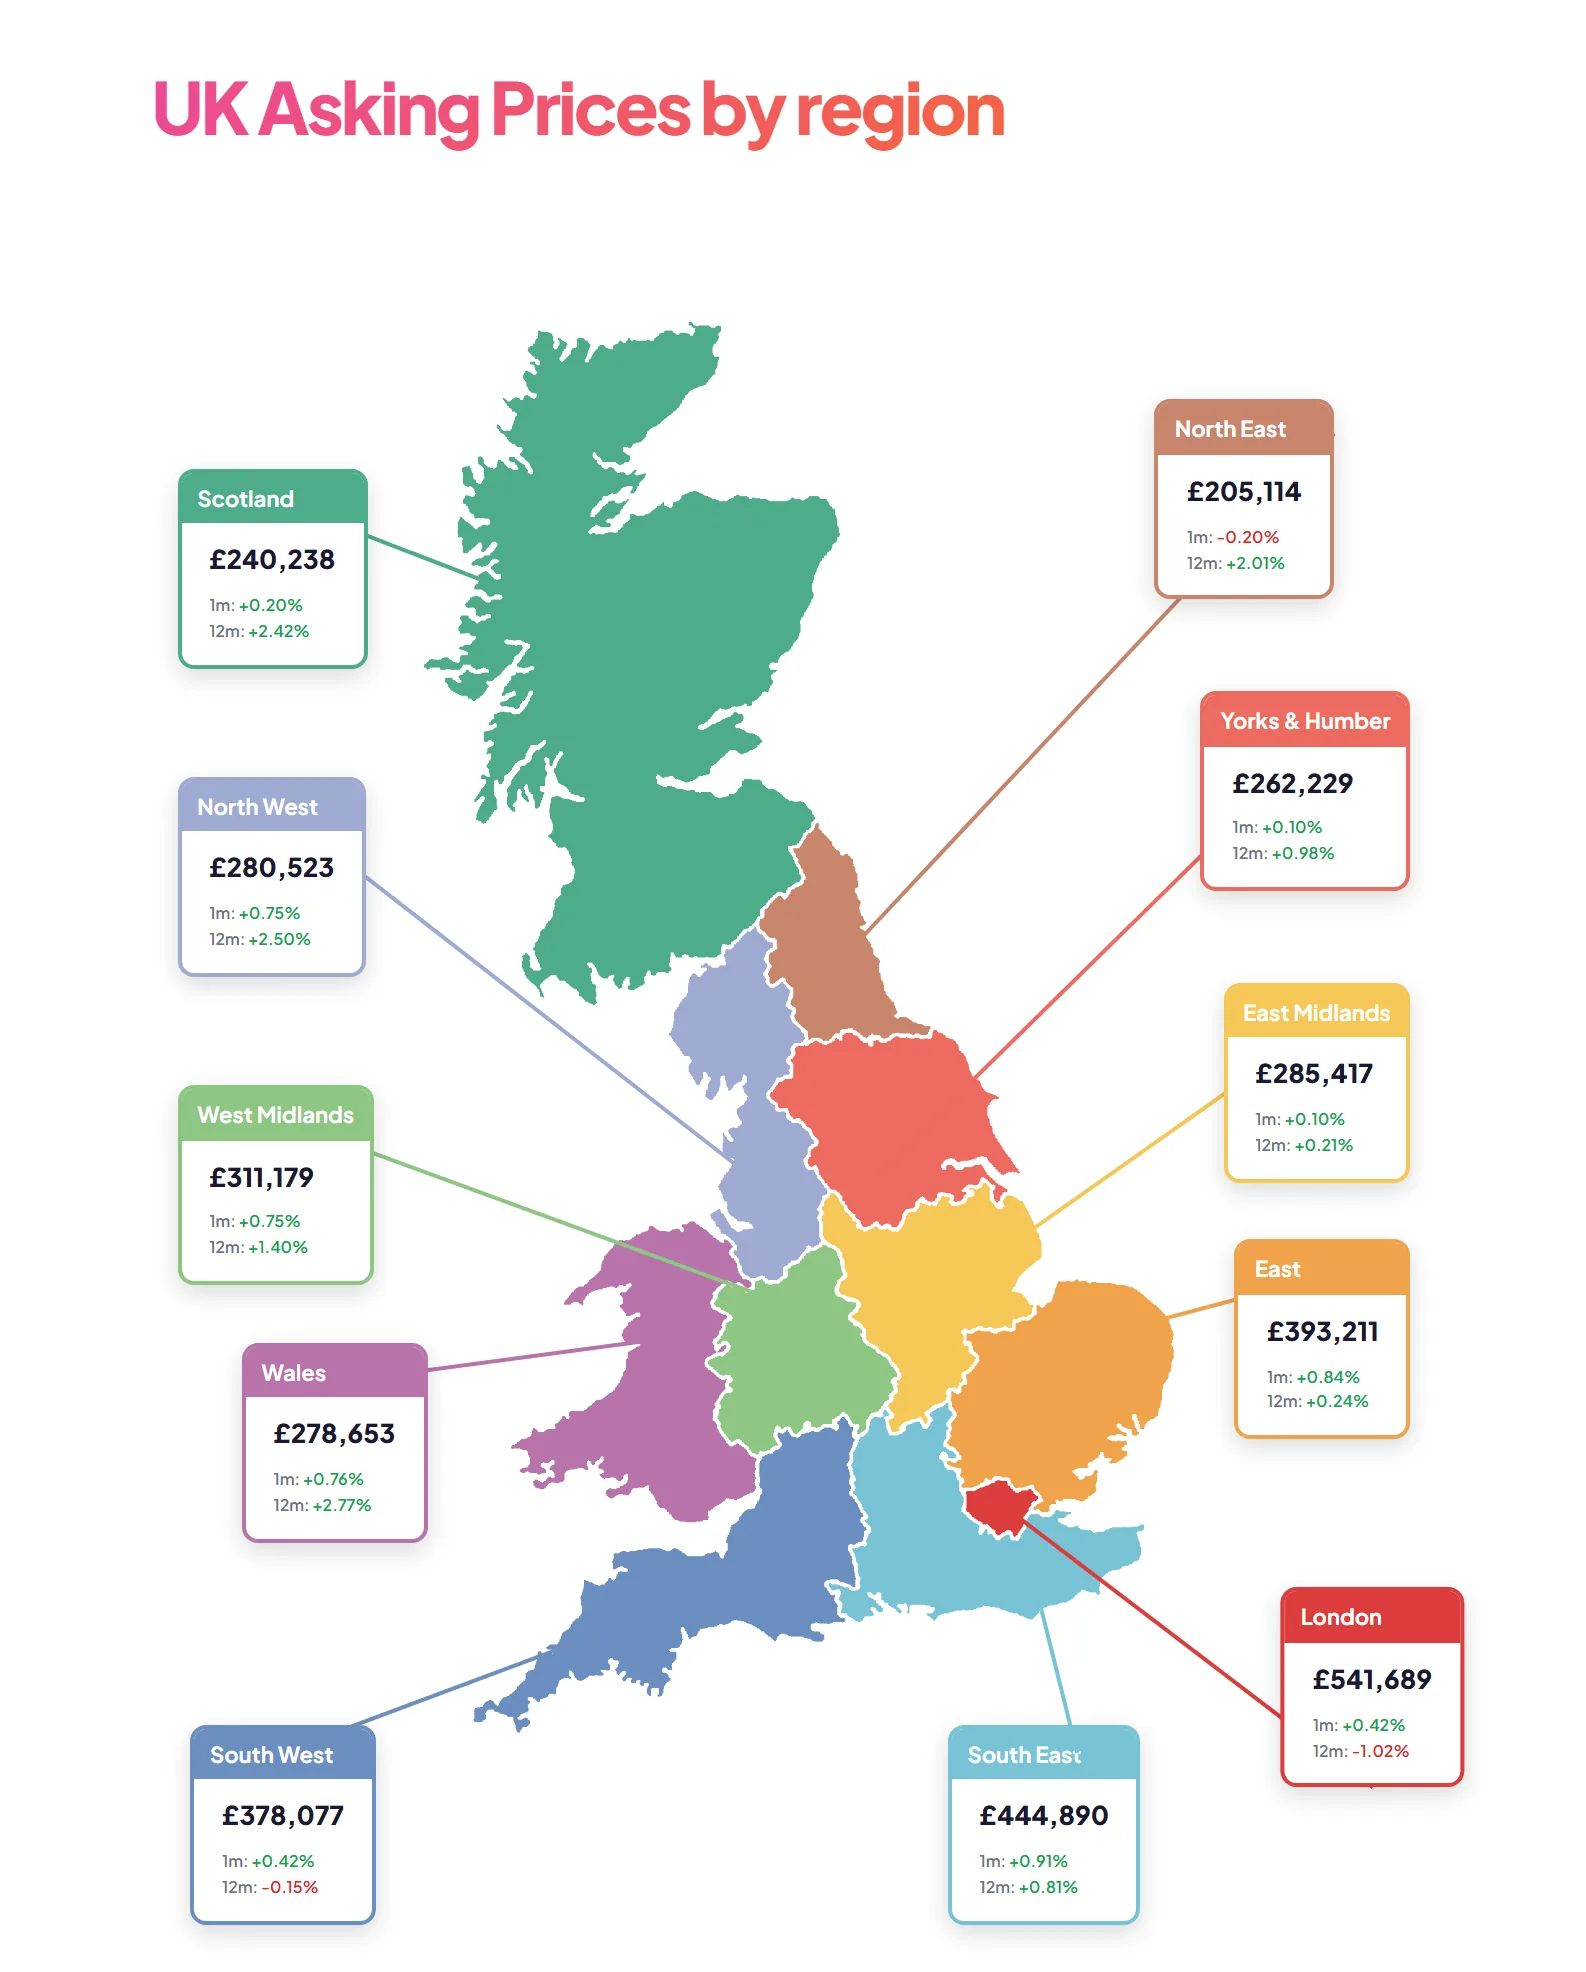
- The mix-adjusted average home price rose in Scotland, Wales and all English regions last month, with the exception of the North East where the average slipped by 0.2%. The largest regional rise was in the South East (0.9%) which looks overly optimistic given the increase in marketing times since last year. Wales is now the top regional property market growth leader with a year-on-year gain of 2.8%, followed by the North West with an annualised rise of 2.5%. Meanwhile, London remains the weakest regional performer with a worsening annualised decline of 1.0%.
Summary
Spring optimism is clearly evident given the positive price signals and, pivotally, the reduction of on-market stock levels. As expected for the time of year, marketing times are falling as the market picks up pace.
Of course, these market dynamics were shaped by expectations of further rate cuts by the Bank of England later in the year. However, the misadventure taking place in the Persian Gulf and the subsequent catastrophic global economic consequences cast a long shadow. A period of stagflation is guaranteed with the only question being: For how long?
With energy prices already soaring, inflation will once again be at the front and centre of the Monetary Policy Committee's concerns, thereby cancelling the previous course of incremental base rate cuts. Moreover, the sudden spike in the 2-year swap rate, a proxy for mortgage rates, indicates that rate hikes are now to be expected. The rapidly increasing likelihood of higher mortgage rates comes as a severe blow to market sentiment, the consequences of which we will see play out over the coming months.
Key figures
| Measure | Figure |
|---|---|
| England & Wales average price | £359,782 |
| Monthly change in asking prices | +0.57% |
| Annual change in asking prices | +0.58% |
| Typical Time on Market | 110 days |
| Total unsold stock | 467,514 |
| New instructions change (YoY) | -1% |
| London annual decline | -1.0% |
| Time on Market YoY | +5.8% |
Figures are for England and Wales unless the report states otherwise, as published in the edition.
Charts from the report
Source: Home.co.uk Property Search Index
Source: Home.co.uk HAPI Index
Source: Home.co.uk and Office for National Statistics
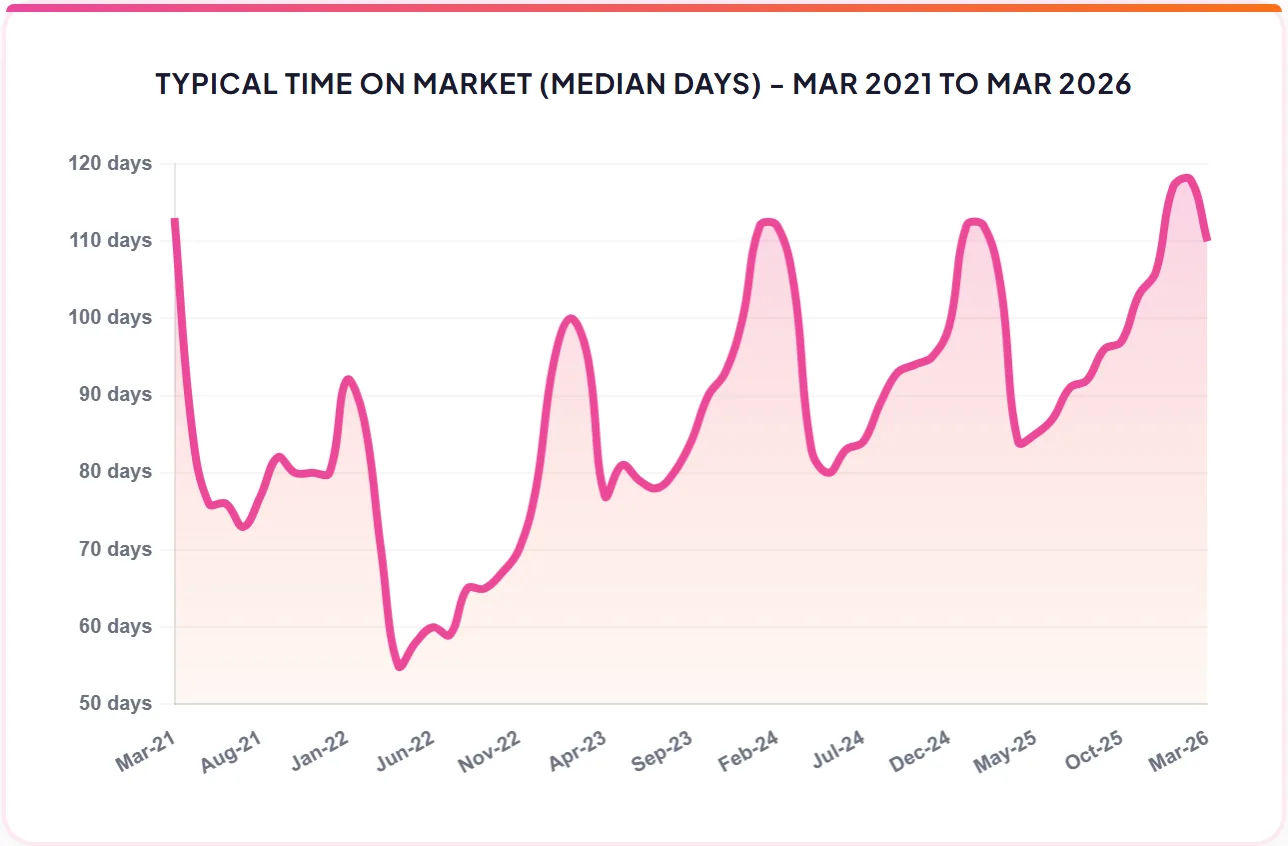
Source: Home.co.uk | Note: Average = Mean, Typical = Median days on market of unsold property
Regional tables
UK Asking Prices by region
| Region | Average asking price | 1 month | 12 months |
|---|---|---|---|
| Scotland | £240,238 | +0.20% | +2.42% |
| North East | £205,114 | -0.20% | +2.01% |
| North West | £280,523 | +0.75% | +2.50% |
| Yorks & Humber | £262,229 | +0.10% | +0.98% |
| Wales | £278,653 | +0.76% | +2.77% |
| West Midlands | £311,179 | +0.75% | +1.40% |
| East Midlands | £285,417 | +0.10% | +0.21% |
| East | £393,211 | +0.84% | +0.24% |
| London | £541,689 | +0.42% | -1.02% |
| South East | £444,890 | +0.91% | +0.81% |
| South West | £378,077 | +0.42% | -0.15% |
Regional Time on Market - March 2026
| Region | Average days | Typical days | Annual supply change |
|---|---|---|---|
| East | 162 | 93 | +2.5% |
| East Midlands | 162 | 91 | -0.3% |
| Greater London | 187 | 108 | -1.4% |
| North East | 166 | 103 | -1.9% |
| North West | 171 | 93 | -4.9% |
| South East | 170 | 102 | +1.2% |
| South West | 184 | 119 | -2.7% |
| Wales | 201 | 132 | -6.5% |
| West Midlands | 168 | 104 | -3.8% |
| Yorks & Humber | 165 | 108 | -1.4% |
From the director's commentary
"The geo-economic reverberations of war in West Asia are having a devastating effect on financial markets around the world. The effective closure of the Strait of Hormuz means vital energy and fertilizer supplies have ceased."
Read the full March 2026 edition
About the Home Asking Price Index
The Home Asking Price Index measures the change in the prices sellers ask for residential property across England, Wales and Scotland. Today it is computed every month from around half a million advertised homes and is mix-adjusted, so a change in what happens to be on the market does not move the figure; earlier editions state the sample they were built from. Because an asking price is set months before a sale completes, the index runs around five months ahead of completed-sale measures such as the UK House Price Index.
Every edition in the archive, back to October 2006, is listed on the index page. How we measure the UK property market explains the listing data behind it, and today's figures by area are on house prices and rental prices.
Text and figures above are quoted from the March 2026 edition as published, with punctuation normalised for the web, and are not revised. Later editions may restate them.
More in What is happening to house prices: the Home guide
Thinking about your next move?
See what your home's worth in seconds, with the UK's longest-running property data behind it.
Get an instant valuation