

























Home Asking Price Index, June 2026: regional gains broaden as London steadies
England and Wales asking prices rose 0.4% over the month to £366,398, with all eleven regions posting gains and London's annual rate flattening to 0.0%.

This is the June 2026 edition of the Home Asking Price Index, released on 15 June 2026, under the headline:
Regional Gains Broaden as London Steadies
The headlines and summary below are the report's own words, with the key figures as it published them, followed by the report's charts and regional tables as printed.
Headlines
- The mix-adjusted average asking price for England & Wales rose 0.4% over the month to £366,398. Annualised growth stands at 0.9%, up from around 0.5% at the start of the year, though it has eased back slightly from May's 1.1%.
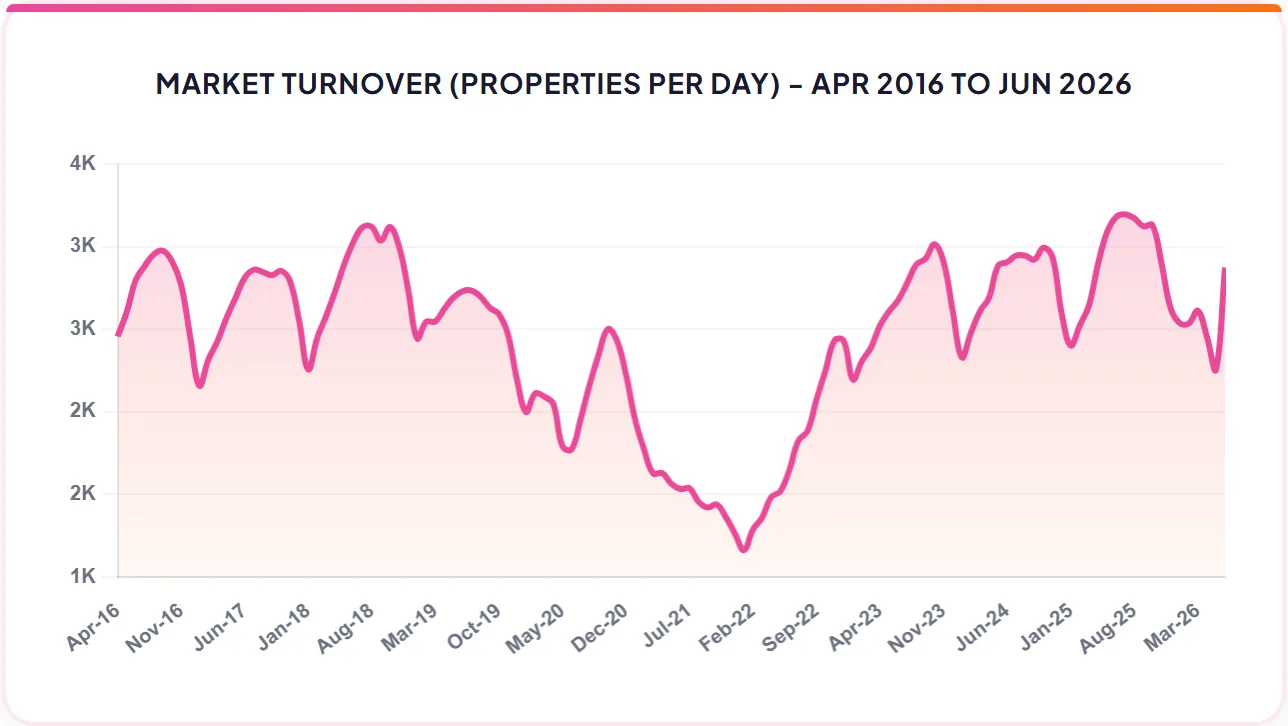
- Total unsold stock stands at 501,337, up over the month, but 7.8% below a year ago, while new instructions are down around 17% year-on-year. Supply is tightening, helping to underpin prices.
- Asking prices rose month-on-month in every English region, Wales and Scotland. The more affordable markets continue to lead, consistent with stretched affordability steering demand northward.
- Greater London has halted its slide, with the annual rate now flat (0.0%) after a prolonged decline. The capital remains the laggard but is no longer dragging the national figure lower.
- The typical (median) time to sell holds at around 86 days. With stock elevated, a meaningful tail of over-ambitiously priced properties continues to linger well beyond the average.
- Annual growth is strongest in Wales (+3.3%), Scotland (+3.1%) and the North West (+2.7%). Greater London (0.0%) and the South East (+0.1%) bring up the rear.
- Average asking rents are broadly flat for England & Wales year-on-year (+0.2%) but with marked regional strength, the North East (+10.5%) and Wales (+11.9%) lead, while Yorkshire & the Humber (-1.3%) is the sole faller.
- With the Bank of England base rate at 3.75% and average fixed mortgage rates around 5.6 to 5.7%, borrowing costs have stabilised. Markets expect another hold at the 18 June MPC meeting, easing the rate anxiety that clouded the spring.
Summary
Stock levels edged higher over the month, with agents' portfolios reaching 501,337 unsold properties. That total is, however, 7.8% lower than a year ago, and new instructions are down sharply too. Supply is gradually tightening from last year's highs which, alongside resilient demand, helps explain why prices have continued to firm.
The UK property market enters the summer on a steadier footing than many had feared. The interest-rate anxiety that clouded the spring has receded: the Bank of England has held its base rate at 3.75% since December, and money markets expect another hold at the 18 June meeting. With borrowing costs no longer climbing, buyer demand has proved more durable than the more pessimistic forecasts allowed for.
Average fixed mortgage rates have edged down to around 5.6% to 5.7%, with an unusually narrow gap between two- and five-year deals. With CPI at 2.8%, still above the Bank's 2% target, affordability remains stretched, and the Bank has signalled caution over energy-driven inflation later in the year, leaving the door open to a rise from the summer onwards. For now, the absence of fresh rate shocks has been enough to coax cautious buyers back and underpin modest price growth.
Key figures
| Measure | Figure |
|---|---|
| E&W Average Price | £366,398 |
| Monthly change | +0.4% |
| Annual change | +0.9% |
| Total Unsold Stock | 501,337 |
| Typical Time on Market | 86 days |
| New Supply (12-month change) | -16.7% |
| Average asking rent (E&W) | £1,749 |
| Average asking rent annual change | +0.2% |
Figures are for England and Wales unless the report states otherwise, as published in the edition.
Charts from the report
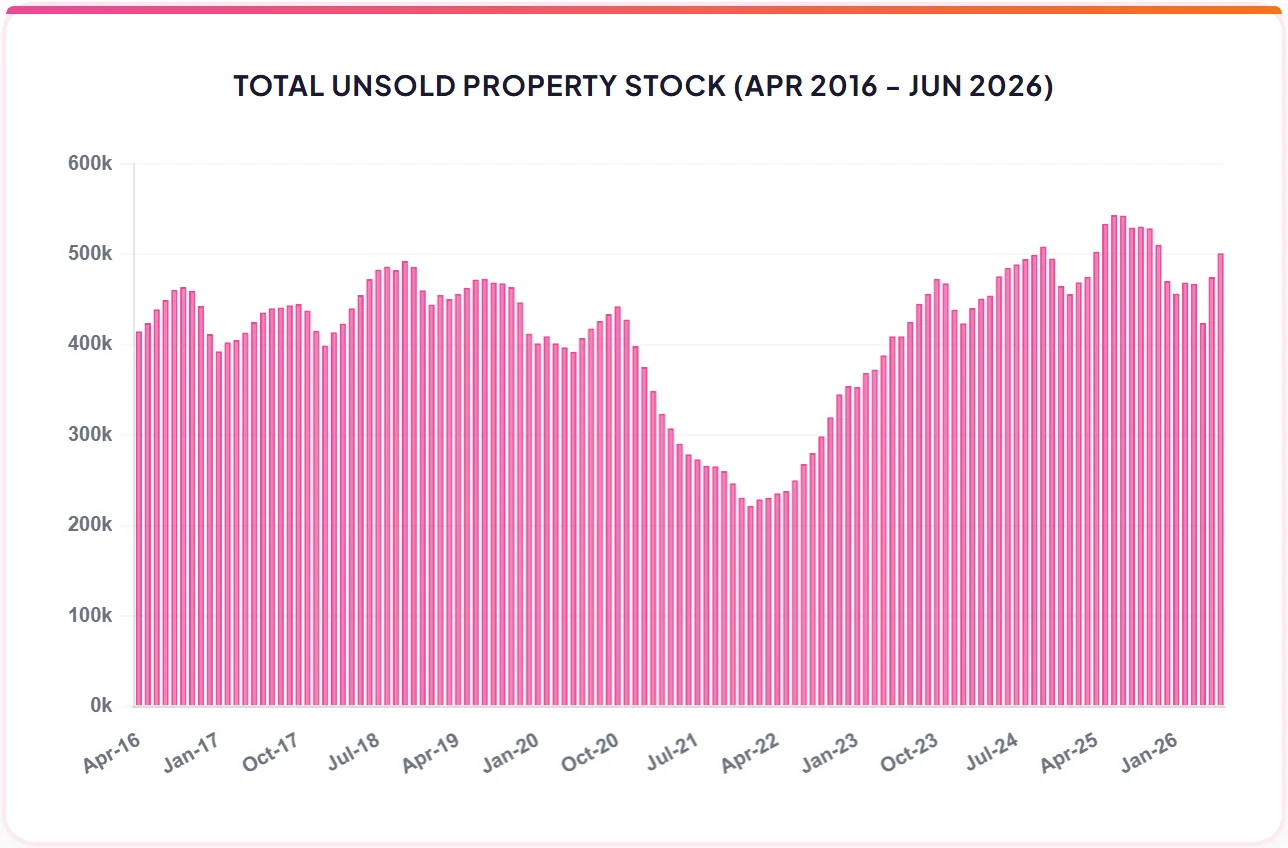
Source: Home.co.uk Property Search Index
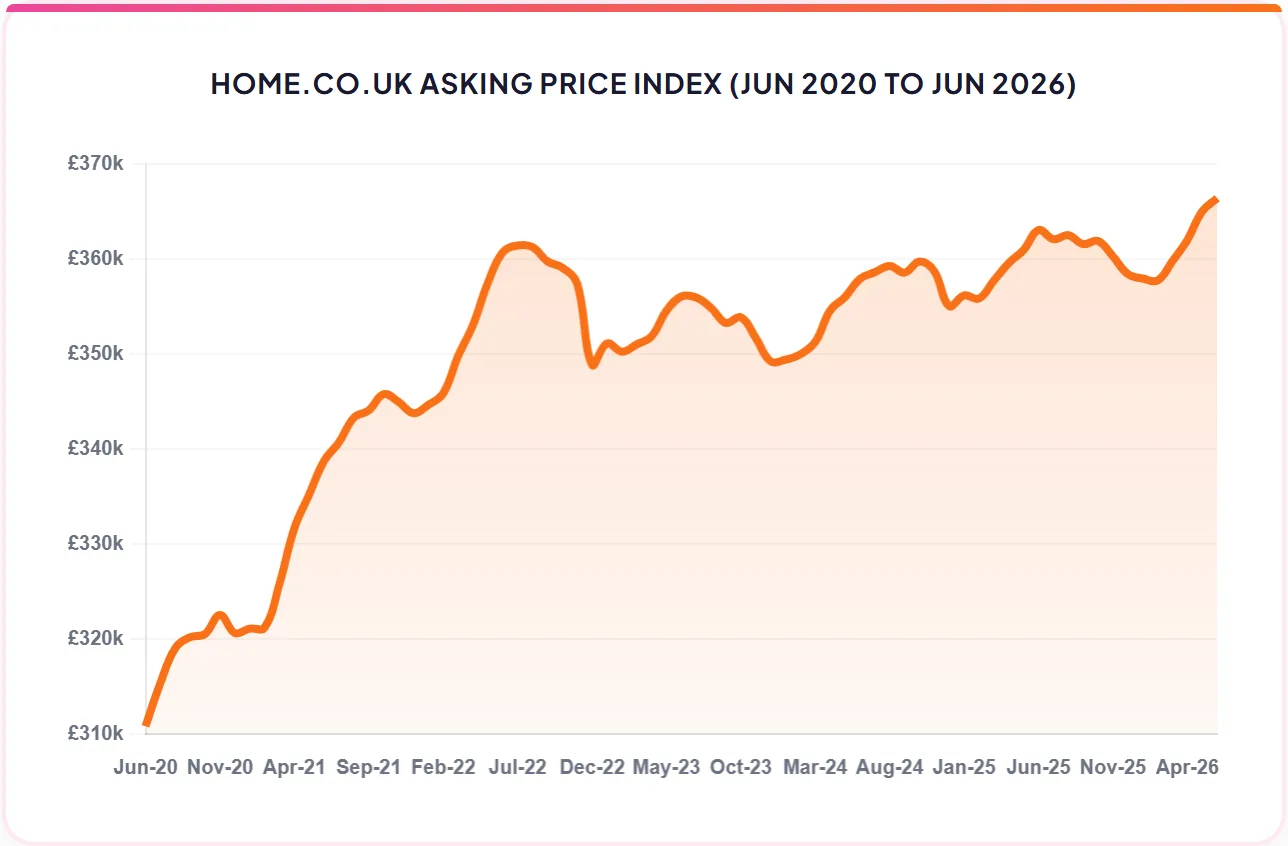
Source: Home.co.uk HAPI Index
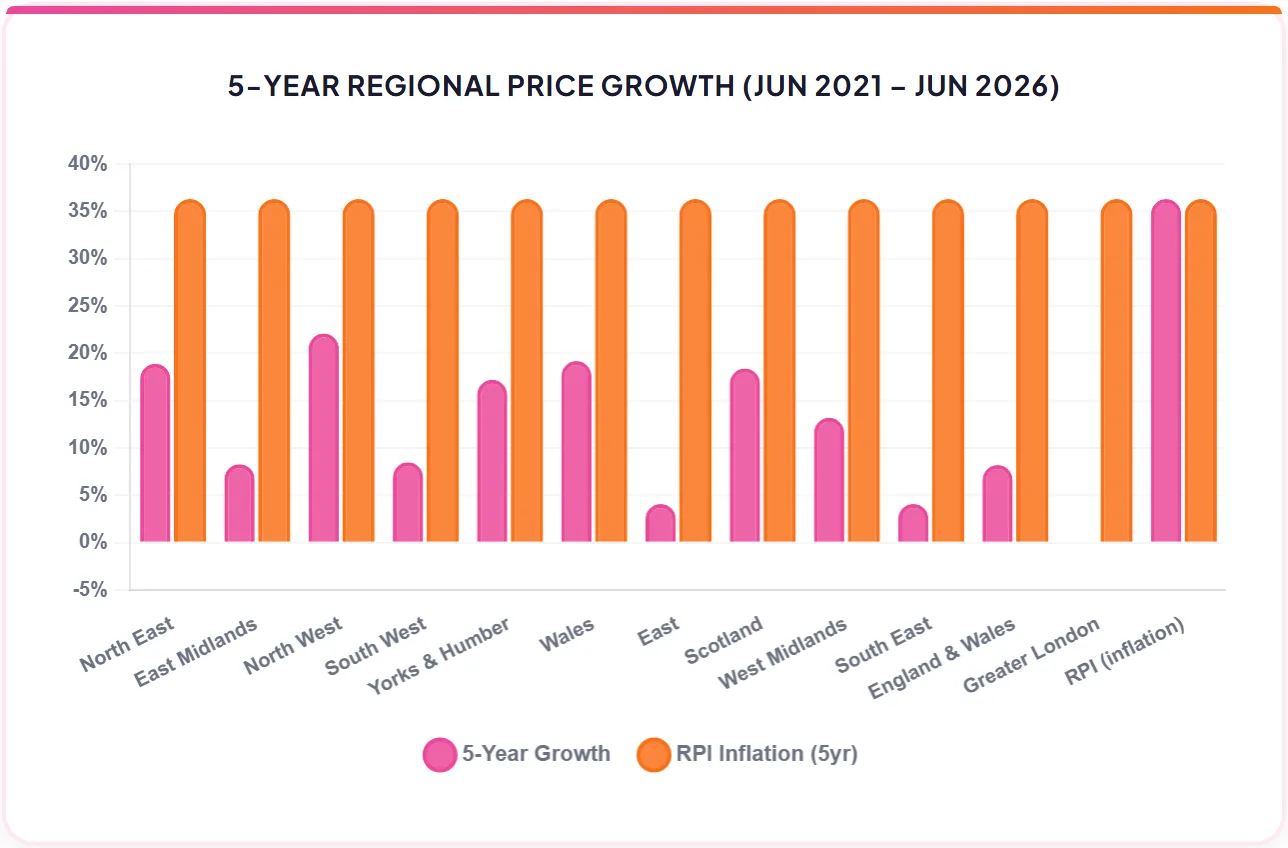
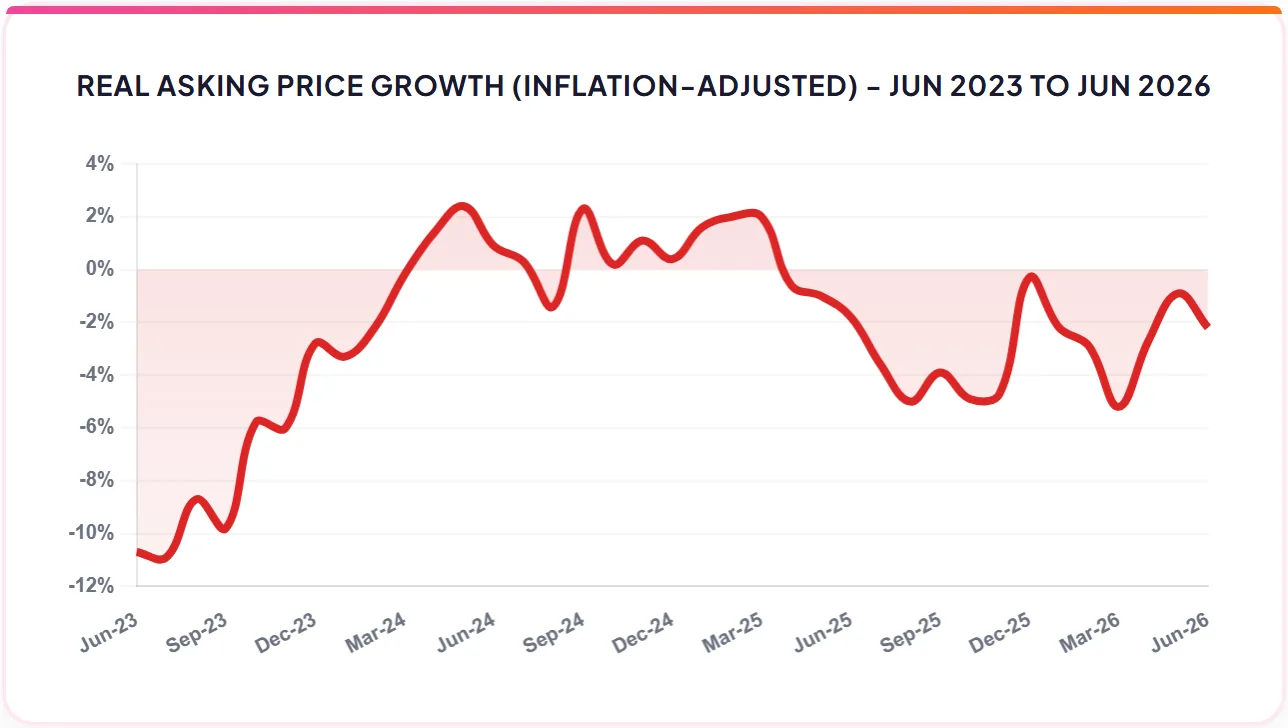
Source: Home.co.uk and Office for National Statistics
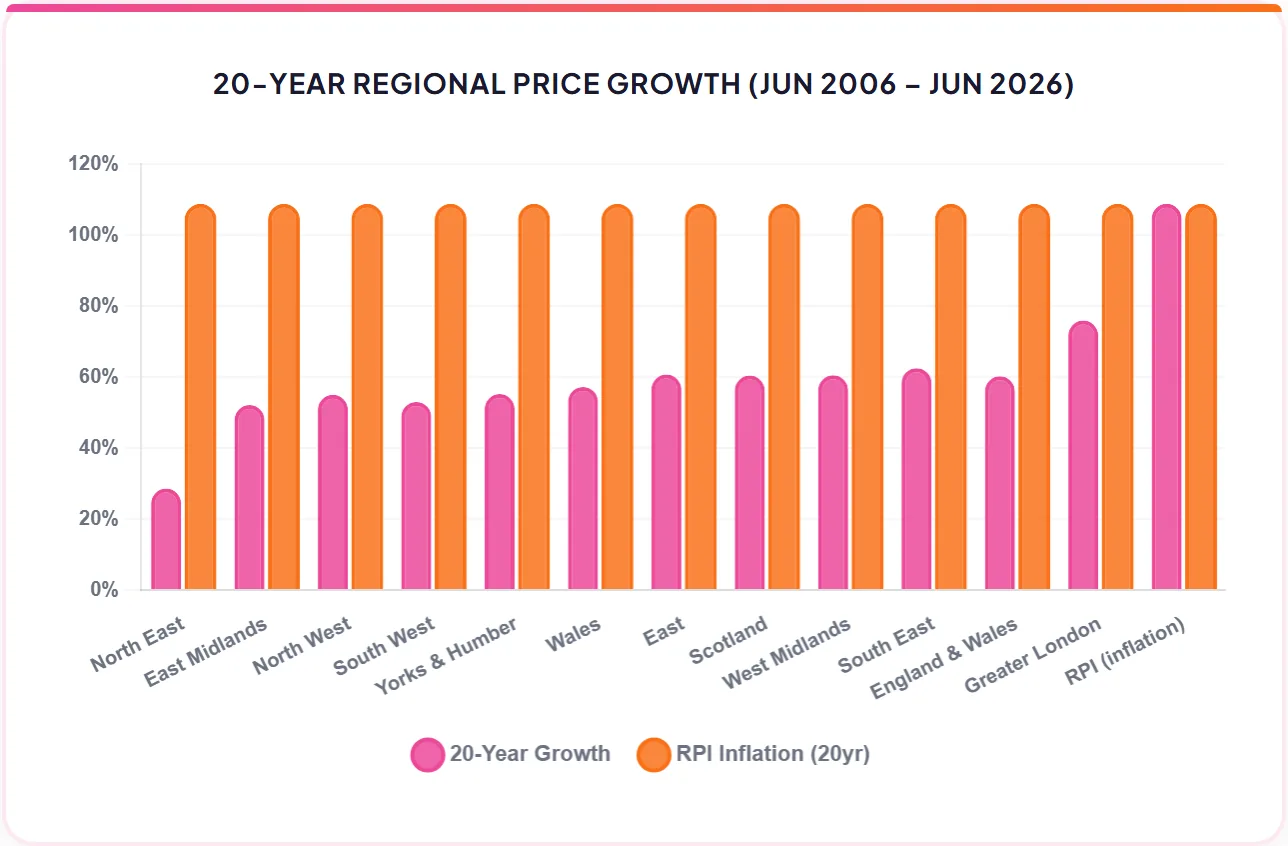
Source: Home.co.uk and Office for National Statistics
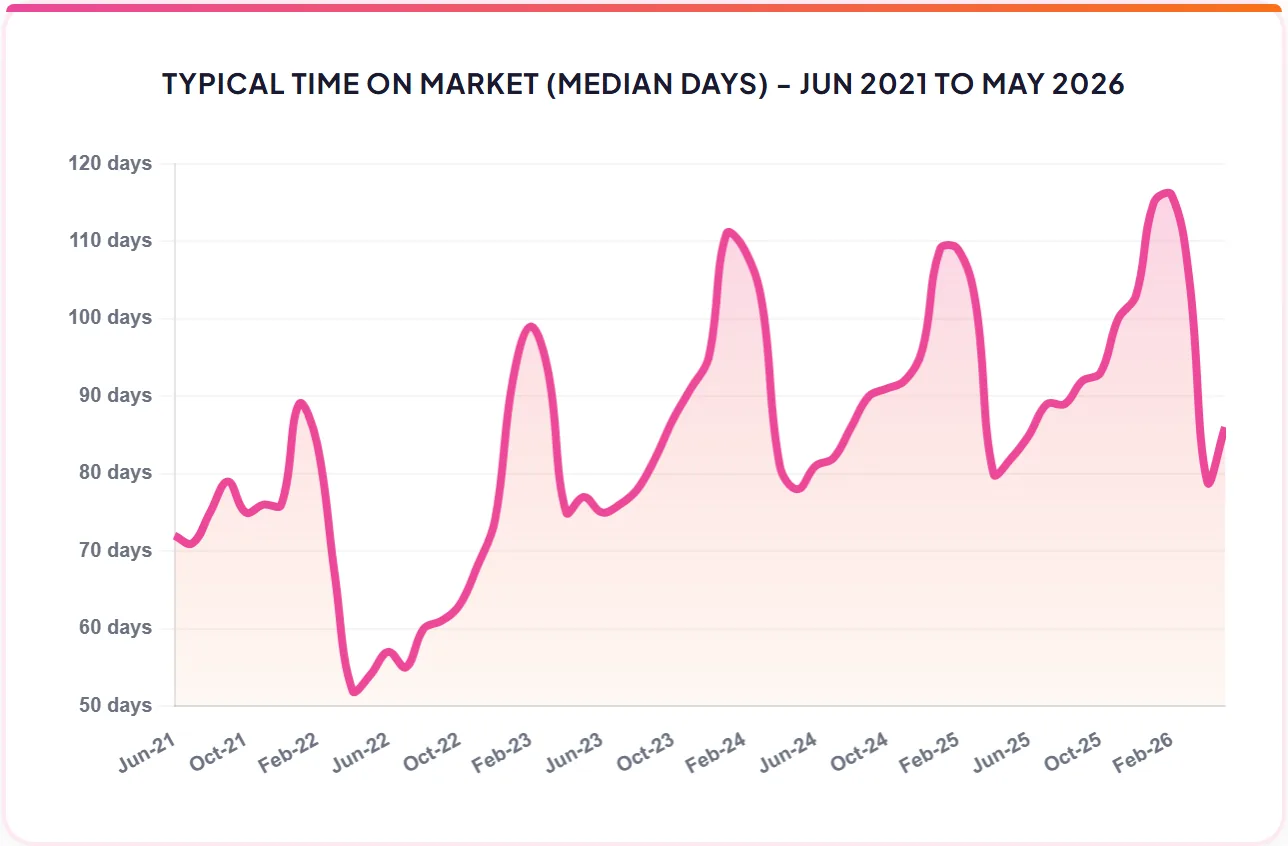
Source: Home.co.uk | Note: Average = Mean, Typical = Median days on market of unsold property
Regional tables
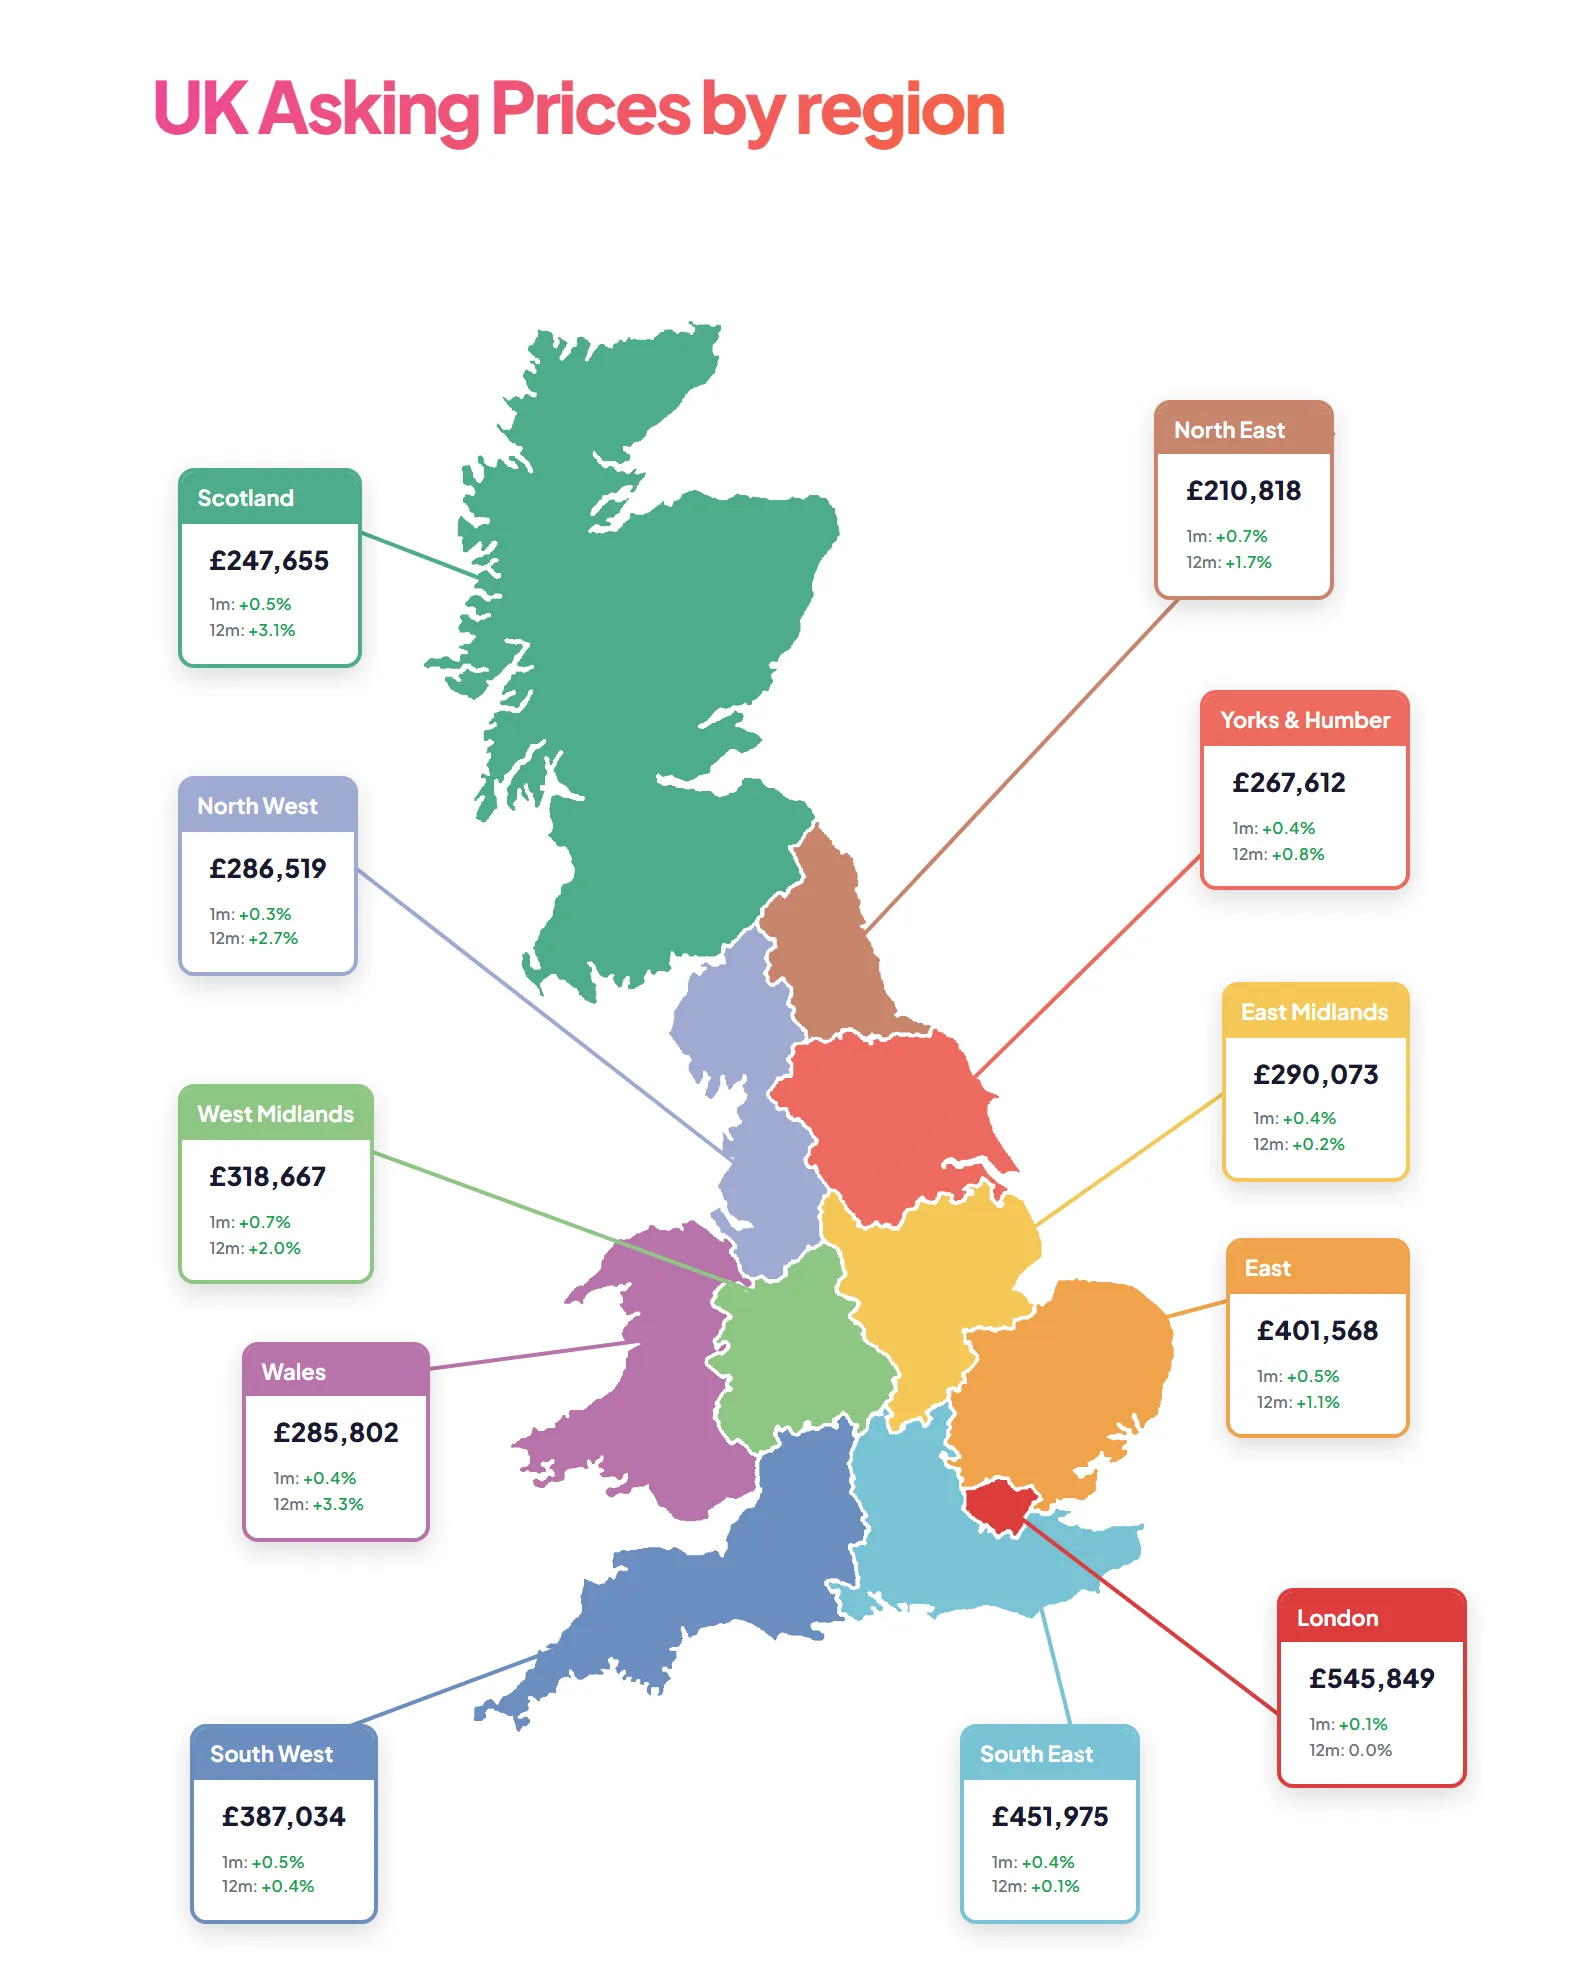
UK Asking Prices by region
| Region | Average asking price | 1 month | 12 months |
|---|---|---|---|
| Scotland | £247,655 | +0.5% | +3.1% |
| North East | £210,818 | +0.7% | +1.7% |
| North West | £286,519 | +0.3% | +2.7% |
| Yorks & Humber | £267,612 | +0.4% | +0.8% |
| Wales | £285,802 | +0.4% | +3.3% |
| West Midlands | £318,667 | +0.7% | +2.0% |
| East Midlands | £290,073 | +0.4% | +0.2% |
| East | £401,568 | +0.5% | +1.1% |
| London | £545,849 | +0.1% | 0.0% |
| South East | £451,975 | +0.4% | +0.1% |
| South West | £387,034 | +0.5% | +0.4% |
Regional Supply Change (12-Month), June 2026
| Region | 12-mo supply change |
|---|---|
| North East | -13.4% |
| North West | -18.0% |
| Yorks & Humber | -14.5% |
| East Midlands | -10.1% |
| West Midlands | -19.4% |
| East | -13.9% |
| Greater London | -23.5% |
| South East | -14.2% |
| South West | -18.9% |
| Wales | -18.1% |
| Scotland | -18.2% |
| England & Wales | -16.7% |
REGIONAL RENTS, MEAN & MEDIAN MONTHLY (PCM), JUNE 2026
| Region | Listings | Mean PCM | Median PCM | 12-mo | 1-mo |
|---|---|---|---|---|---|
| East | 4,108 | £1,413 | £1,300 | +1.2% | +1.2% |
| East Midlands | 3,299 | £1,032 | £950 | +7.4% | -3.2% |
| Greater London | 13,660 | £2,915 | £2,400 | +5.3% | +0.7% |
| North East | 1,565 | £1,002 | £815 | +10.5% | +3.4% |
| North West | 4,707 | £1,200 | £1,100 | +3.9% | -0.5% |
| Scotland | 1,594 | £1,276 | £1,100 | +7.6% | -4.9% |
| South East | 7,362 | £1,667 | £1,425 | +1.3% | +1.5% |
| South West | 3,763 | £1,423 | £1,250 | +6.2% | +5.6% |
| Wales | 1,236 | £1,177 | £1,000 | +11.9% | +21.4% |
| West Midlands | 4,159 | £1,107 | £1,050 | +4.2% | +1.2% |
| Yorks & The Humber | 3,422 | £1,022 | £910 | -1.3% | +1.1% |
| England & Wales | 48,875 | £1,749 | £1,501 | +0.2% | +1.3% |
TOP LONDON POSTCODE DISTRICTS BY MEAN RENT
| Postcode district | Listings | Mean PCM | Median PCM |
|---|---|---|---|
| W8 | 110 | £6,641 | £4,319 |
| NW8 | 202 | £5,523 | £4,058 |
| NW3 | 141 | £5,043 | £3,500 |
| SW7 | 120 | £4,877 | £3,950 |
| SW3 | 140 | £4,797 | £3,012 |
| W2 | 247 | £4,151 | £3,250 |
| SW8 | 166 | £4,052 | £3,448 |
| NW1 | 277 | £3,884 | £3,250 |
| SW11 | 334 | £3,854 | £3,424 |
| SW6 | 196 | £3,692 | £3,110 |
| W4 | 105 | £3,488 | £2,600 |
| SE1 | 332 | £3,457 | £3,000 |
| SW18 | 123 | £3,430 | £2,750 |
| N1 | 171 | £3,254 | £3,100 |
| SW19 | 152 | £3,239 | £2,472 |
From the director's commentary
"Crucially, the recovery in pricing is broad rather than narrow. Every region recorded a monthly gain, and annual growth is now positive almost everywhere, led by the more affordable markets of Wales, Scotland and the North."
Read the full June 2026 edition
About the Home Asking Price Index
The Home Asking Price Index measures the change in the prices sellers ask for residential property across England, Wales and Scotland. Today it is computed every month from around half a million advertised homes and is mix-adjusted, so a change in what happens to be on the market does not move the figure; earlier editions state the sample they were built from. Because an asking price is set months before a sale completes, the index runs around five months ahead of completed-sale measures such as the UK House Price Index.
Every edition in the archive, back to October 2006, is listed on the index page. How we measure the UK property market explains the listing data behind it, and today's figures by area are on house prices and rental prices.
Text and figures above are quoted from the June 2026 edition as published, with punctuation normalised for the web, and are not revised. Later editions may restate them.
More in What is happening to house prices: the Home guide
Thinking about your next move?
See what your home's worth in seconds, with the UK's longest-running property data behind it.
Get an instant valuation