

























Home Asking Price Index, July 2026: prices hold their nerve, the market slows
Asking prices in England and Wales were flat over the year at £397,044 while turnover fell 30% and typical time to sell rose to 53 days.

This is the July 2026 edition of the Home Asking Price Index, released on 31 July 2026, under the headline:
Prices hold their nerve, the market slows
The headlines and summary below are the report's own words, with the key figures as it published them, followed by the report's charts and regional tables as printed.
Headlines
- The mix-adjusted average asking price is £397,044, up +0.37% over the month but +0.03% over twelve months. The index reads 206.6, 0.3% below its June 2025 peak.
- Adjusted for inflation, asking prices are -2.9% on the year and have been negative for 14 consecutive months. Cash-flat is a real-terms fall.
- Scotland is up +9.4% over the year while Greater London is down -2.5%. The cheaper markets are carrying the national figure.
- New instructions are -17.5% against the same 28 days last year, though still +31.5% on two years ago. Unsold stock is 544,670.
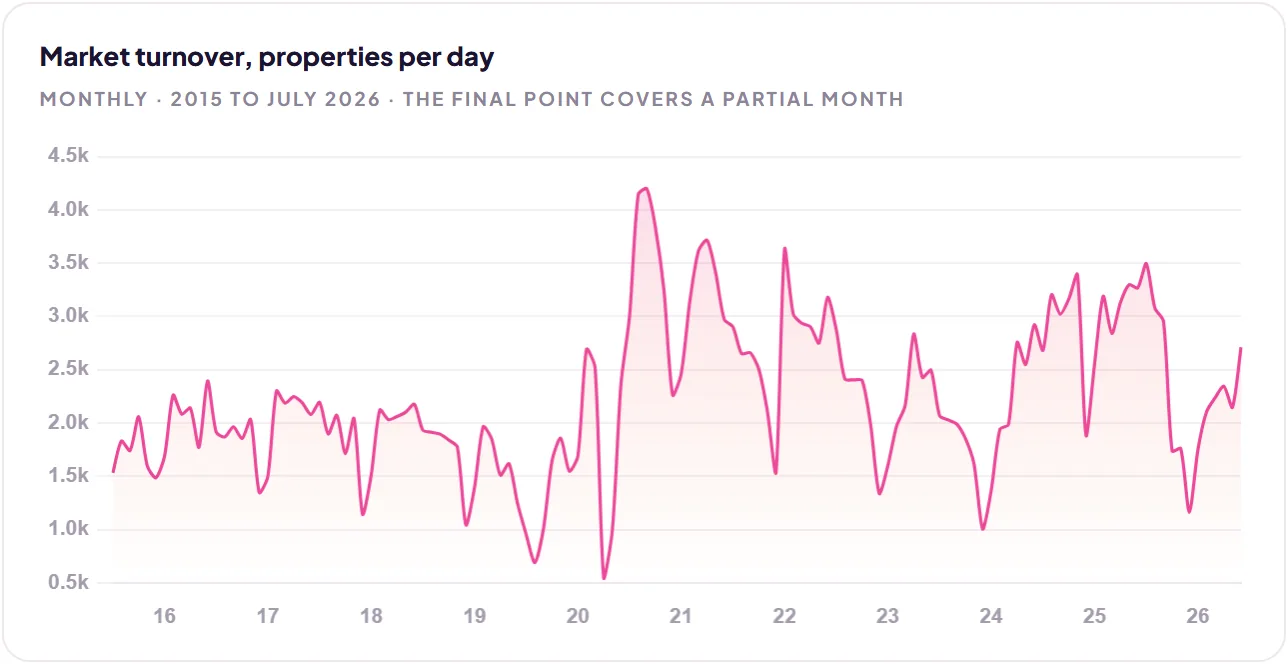
- The market turned over 2,117 properties a day across January to May, against 3,004 in the same months last year, -30%.
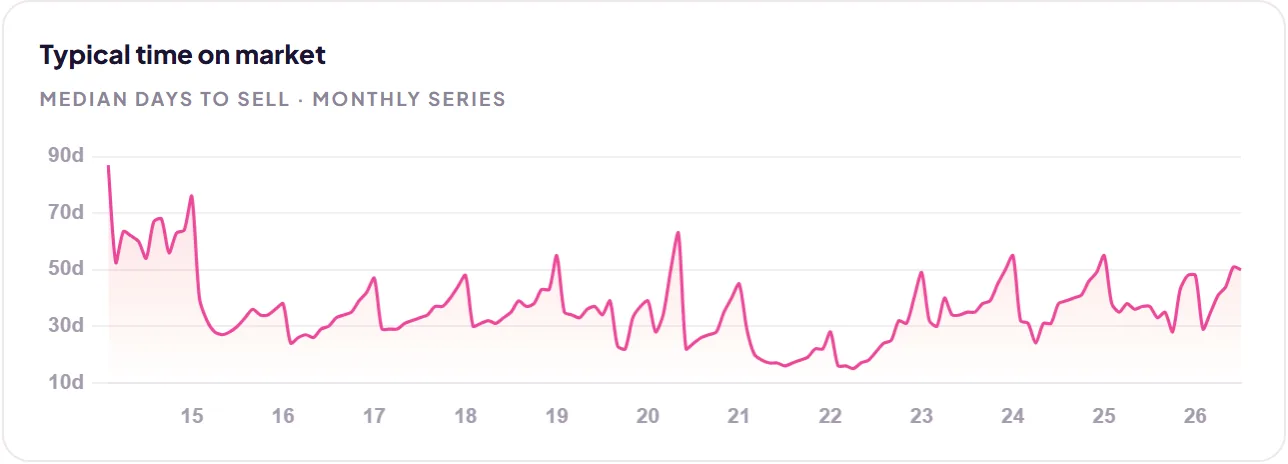
- The typical time on market is 53 days against 39 a year ago, +35%. Greater London has slowed most, at +68%.
Summary
The average asking price across England and Wales is £397,044, +0.37% over the month and +0.03% over the year. In cash terms the market has gone sideways for a year, close to its all-time high. Against inflation it has been losing ground steadily: real asking prices are -2.9% on the year, and have not been positive for 14 months.
Key figures
| Measure | Figure |
|---|---|
| Average asking price | £397,044 |
| Monthly change | +0.37% |
| Annual change | +0.03% |
| Real terms annual change | -2.9% |
| Unsold stock | 544,670 |
| New instructions change | -17.5% |
| Typical time to sell | 53 days |
| Turnover | 2,117 |
Figures are for England and Wales unless the report states otherwise, as published in the edition.
Charts from the report
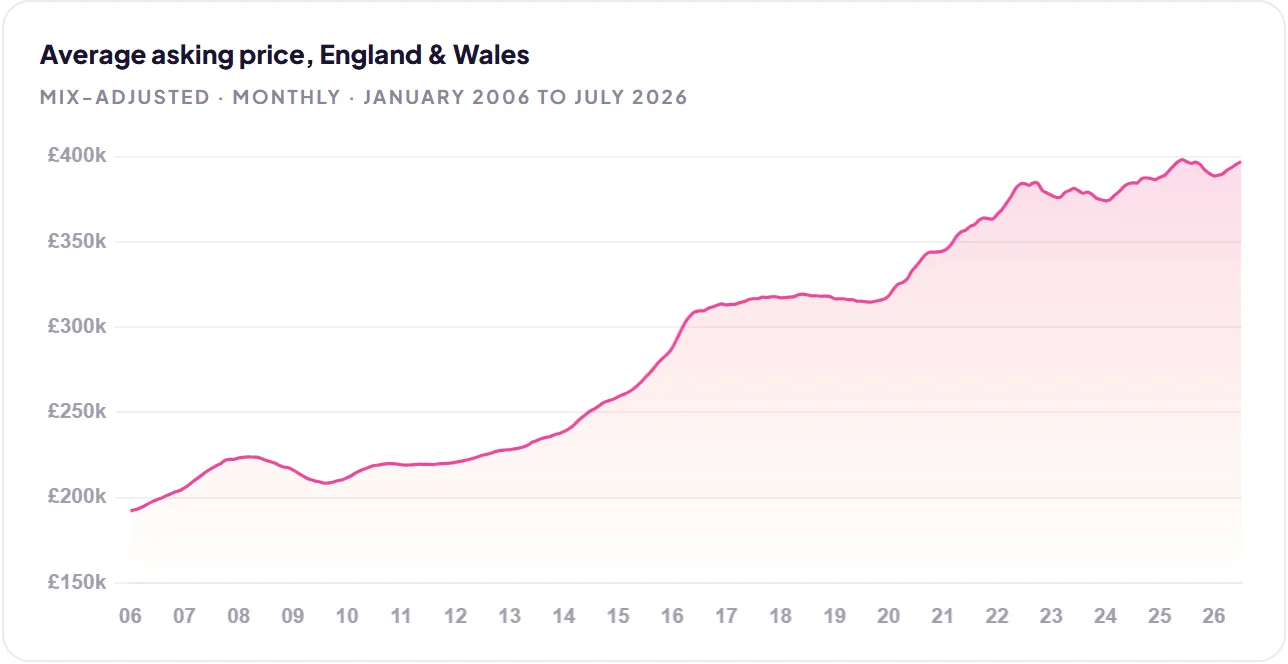
The index is mix-adjusted across region and property type and rebased to 100 in January 2006. Real growth uses the current RPI estimate. Source: home.co.uk asking price data.
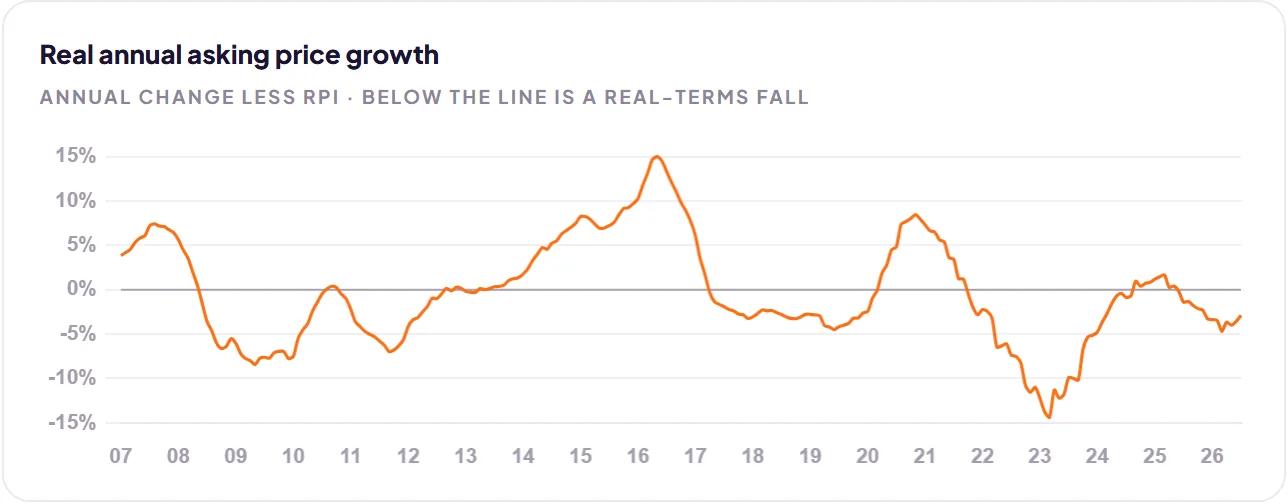
The index is mix-adjusted across region and property type and rebased to 100 in January 2006. Real growth uses the current RPI estimate. Source: home.co.uk asking price data.
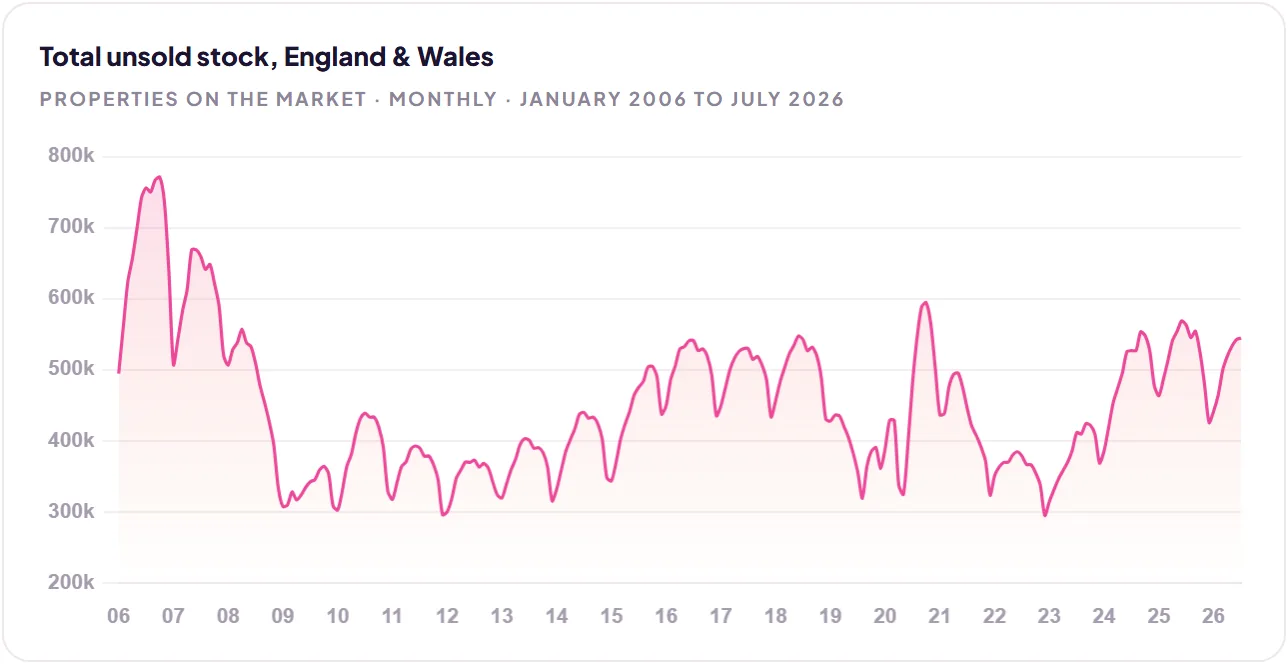
Stock is a mid-month snapshot. The instructions window is the 28 days to the data cut-off, compared with the identical dates a year earlier. Source: home.co.uk listings data.
Regional tables
Welcome to the new and improved HAPI report
| Element | Until now | In version 2 |
|---|---|---|
| Extreme prices | Everything above £1m excluded outright, as a stand-in for Winsorising | Each region-by-type cell clips its own extremes at the Tukey fences, recomputed monthly, so the threshold moves with the market |
| Stock weights | Survey of English Housing 2003/04, a survey long since replaced | 2021 Census dwelling stock, the basis the ONS uses, re-stated periodically. The fixed-weight method is unchanged |
| Market coverage | Unstated | Measured against HM Land Registry Price Paid Data and published by region: about 83% of completed England and Wales sales |
The month in numbers
| Measure | Now | Change | Comparison |
|---|---|---|---|
| Average asking price | £397,044 | +0.37% on the month | +0.03% on the year |
| Index, January 2006 = 100 | 206.6 | 0.3% below peak | Peak June 2025 |
| Real asking prices | -2.9% | 14 months negative | Against current RPI |
| Unsold stock | 544,670 | -3.2% on the year | Long-run average 449,966 |
| New instructions, 28 days | -17.5% | on the same dates last year | +31.5% on two years ago |
| Turnover, properties per day | 2,117 | -30% on the year | 3,004 in January to May 2025 |
| Typical time to sell | 53 days | +35% on the year | 39 days a year ago |
| Asking prices, five years | 10.6% | RPI 36.3% | Behind inflation |
| Asking prices, twenty years | 99.7% | RPI 109.8% | Broadly with inflation |
The north and Scotland carry the market
| Region | Average asking price | 1 month | 12 months |
|---|---|---|---|
| Scotland | £234,589 | +0.55% | +9.35% |
| North West | £287,907 | +0.62% | +3.47% |
| North East | £206,061 | +0.29% | +3.24% |
| Yorkshire & The Humber | £271,008 | +0.53% | +2.70% |
| Wales | £284,310 | +0.57% | +2.23% |
| West Midlands | £315,055 | +0.43% | +1.83% |
| South East | £499,878 | +0.57% | +0.31% |
| East of England | £421,872 | +0.19% | -0.09% |
| East Midlands | £290,621 | +0.24% | -0.17% |
| South West | £391,568 | +0.32% | -1.87% |
| Greater London | £685,654 | +0.17% | -2.47% |
| England & Wales | £397,044 | +0.37% | +0.03% |
The same house, three times the price
| Region | Average asking price | 12 months |
|---|---|---|
| Greater London | £685,654 | -2.5% |
| South East | £499,878 | +0.3% |
| East of England | £421,872 | -0.1% |
| South West | £391,568 | -1.9% |
| West Midlands | £315,055 | +1.8% |
| East Midlands | £290,621 | -0.2% |
| North West | £287,907 | +3.5% |
| Wales | £284,310 | +2.2% |
| Yorkshire & The Humber | £271,008 | +2.7% |
| Scotland | £234,589 | +9.4% |
| North East | £206,061 | +3.2% |
A typical sale now takes 53 days
| Region | Typical days | Average days | New instructions, 12m | Time to sell, 12m |
|---|---|---|---|---|
| Scotland | 20 | 49 | -18.7% | n/a |
| North East | 35 | 71 | -13.9% | +35% |
| Wales | 43 | 84 | -17.9% | +23% |
| North West | 47 | 83 | -22.8% | +42% |
| Yorkshire & The Humber | 47 | 84 | -15.0% | +52% |
| West Midlands | 48 | 84 | -19.8% | +50% |
| East Midlands | 52 | 86 | -10.2% | +41% |
| East of England | 56 | 90 | -14.5% | +60% |
| South East | 57 | 92 | -14.5% | +50% |
| South West | 60 | 97 | -18.8% | +62% |
| Greater London | 64 | 97 | -23.4% | +68% |
| England & Wales | 53 | 88 | -17.5% | +35% |
Against inflation, almost nowhere wins
| Region | Five years | vs RPI | Twenty years | vs RPI |
|---|---|---|---|---|
| Greater London | 4.8% | -31.5 pts | 166.8% | +57.0 pts |
| South East | 10.5% | -25.8 pts | 104.8% | -5.0 pts |
| East of England | 3.7% | -32.6 pts | 98.3% | -11.6 pts |
| Scotland | 21.7% | -14.7 pts | 93.0% | -16.8 pts |
| South West | 8.4% | -28.0 pts | 88.8% | -21.1 pts |
| West Midlands | 16.0% | -20.4 pts | 80.5% | -29.3 pts |
| East Midlands | 11.5% | -24.9 pts | 75.2% | -34.7 pts |
| North West | 23.5% | -12.8 pts | 73.2% | -36.7 pts |
| Yorkshire & The Humber | 18.7% | -17.6 pts | 72.4% | -37.4 pts |
| Wales | 18.1% | -18.2 pts | 72.2% | -37.6 pts |
| North East | 22.0% | -14.3 pts | 37.9% | -72.0 pts |
| England & Wales | 10.6% | -25.7 pts | 99.7% | -10.1 pts |
Rents: London pulls away again
| Region | Listings | Mean pcm | Median pcm | 12 months |
|---|---|---|---|---|
| East of England | 4,447 | £1,416 | £1,300 | +0.1% |
| East Midlands | 3,487 | £1,046 | £950 | +0.5% |
| Greater London | 14,817 | £2,923 | £2,450 | +5.8% |
| North East | 1,447 | £922 | £800 | +3.3% |
| North West | 5,103 | £1,210 | £1,100 | +2.1% |
| Scotland | 1,574 | £1,233 | £1,050 | +0.5% |
| South East | 7,899 | £1,659 | £1,450 | +1.8% |
| South West | 3,574 | £1,378 | £1,250 | +2.1% |
| Wales | 1,174 | £1,084 | £995 | +1.1% |
| West Midlands | 3,975 | £1,136 | £1,050 | +4.4% |
| Yorkshire & The Humber | 3,702 | £982 | £900 | -7.5% |
| England & Wales | 51,199 | £1,761 | £1,532 | -0.3% |
Where London rents highest
| District | Listings | Mean pcm | Median pcm |
|---|---|---|---|
| SW7 | 143 | £5,394 | £4,312 |
| W8 | 96 | £5,206 | £3,550 |
| NW8 | 160 | £4,731 | £3,498 |
| SW3 | 178 | £4,711 | £3,500 |
| NW3 | 146 | £4,574 | £3,148 |
| W2 | 311 | £4,415 | £3,500 |
| SW6 | 197 | £4,076 | £3,250 |
| NW1 | 312 | £3,956 | £3,400 |
The index at a glance
| Parameter | Definition |
|---|---|
| Measures | Asking prices of residential property advertised for sale |
| Frequency | Monthly, from a mid-month data cut-off |
| Sample | Over 500,000 advertised properties, de-duplicated to one record per property |
| Geography | Ten England and Wales Government Office Regions, plus Scotland |
| Stratification | Region by property type, combined on fixed housing stock weights |
| Base period | January 2006 = 100, Laspeyres-type index |
| Lead time | Roughly five months ahead of completed-sale prices |
| Market coverage | Measured against HM Land Registry Price Paid Data and published by region from version 2 onward |
| Rental series | Advertised asking rents by region and by London postcode district, published alongside |
Read the full July 2026 edition
About the Home Asking Price Index
The Home Asking Price Index measures the change in the prices sellers ask for residential property across England, Wales and Scotland. Today it is computed every month from around half a million advertised homes and is mix-adjusted, so a change in what happens to be on the market does not move the figure; earlier editions state the sample they were built from. Because an asking price is set months before a sale completes, the index runs around five months ahead of completed-sale measures such as the UK House Price Index.
Every edition in the archive, back to October 2006, is listed on the index page. How we measure the UK property market explains the listing data behind it, and today's figures by area are on house prices and rental prices.
Text and figures above are quoted from the July 2026 edition as published, with punctuation normalised for the web, and are not revised. Later editions may restate them.
Thinking about your next move?
See what your home's worth in seconds, with the UK's longest-running property data behind it.
Get an instant valuation