

























Home Asking Price Index, January 2026: supply rebound portends a buyer's market in 2026
New property listings rose twenty per cent year on year in December, and unsold stock hit its highest January level since 2015, with prices up just 0.5%.
This is the January 2026 edition of the Home Asking Price Index, released on 15 January 2026, under the headline:
Supply Rebound Portends a Buyer's Market in 2026
The headlines and summary below are the report's own words, with the key figures as it published them, followed by the report's charts and regional tables as printed.
Headlines
- Vendor numbers rebounded during December in the wake of November's hesitancy. Twenty per cent more properties were placed on the market than in December 2024. The largest surges in new sales listings were in Scotland, the North East, East Midlands and the North West.
- Pricing remains very subdued. Agents are clearly pricing to sell in an increasingly challenging market. Home prices in England and Wales are just 0.5% higher than in January 2025.
- The mix-adjusted average slipped in Wales, Scotland and all English regions except the North East (+0.7%), North West (+0.3%) and Greater London (+0.4%). The East of England indicated the largest month-on-month decline (-0.8%).
- While the total unsold stock on the market has decreased over recent months, the current total is the highest January figure since 2015. Moreover, seasonal expectations indicate a rapid rise over the next six months.
- The North East is now the top regional property market growth leader with a year-on-year gain of 2.7%, pushing the North West into second place. Meanwhile, London remains the worst regional performer with an annualised decline extending to 1.0%.
- Typical Time on Market (TTM) for unsold properties continues to move higher overall and is currently five days higher than in January last year. The worst increase in marketing times is to be found in the South West and prices are correcting accordingly.
- The annualised national growth in asking rents trends even further into the negative (now -4.1%) thus providing further downward pressure on home prices. All English regions, Scotland and Wales continue to indicate year-on-year declines in the mix-adjusted average asking rent. The worst performer is the East Midlands with an annualised decline of 12.5%.
- Eighteen of the 33 London boroughs indicate negative asking rent growth. Kensington and Chelsea is the slowest market (TTM: 49 days) and asking rents have fallen 6.9% over the last twelve months in this borough.
Summary
The UK property market lies at a critical juncture. With overall growth trending to zero and possibly below, confidence is on the ebb even for the most seasoned property bulls. Losses in capital values in real terms and falling rents are operating like a pincer movement on property investors. "Hold on and hope" stalwarts are gradually capitulating. For any prospective buyers, caveat emptor must be taken seriously as valuations slide.
Frankly, headlines like "House Prices Unexpectedly Fall" look somewhat ridiculous in the current economic environment. Unexpected? Perhaps try paying attention: supply has outpaced demand. Moreover, prices are soft and sliding because many investors are willing to take a hit if it allows them to cash out quickly and turn to other more profitable markets. The sense of urgency is palpable.
Key figures
| Measure | Figure |
|---|---|
| Annual price change (England & Wales) | +0.5% |
| Annual change in asking rents (national) | -4.1% |
| New listings vs December 2024 | +20% |
| North East annual price growth | +2.7% |
| London annual price decline | 1.0% |
| East Midlands annual rent decline | -12.5% |
Figures are for England and Wales unless the report states otherwise, as published in the edition.
Charts from the report
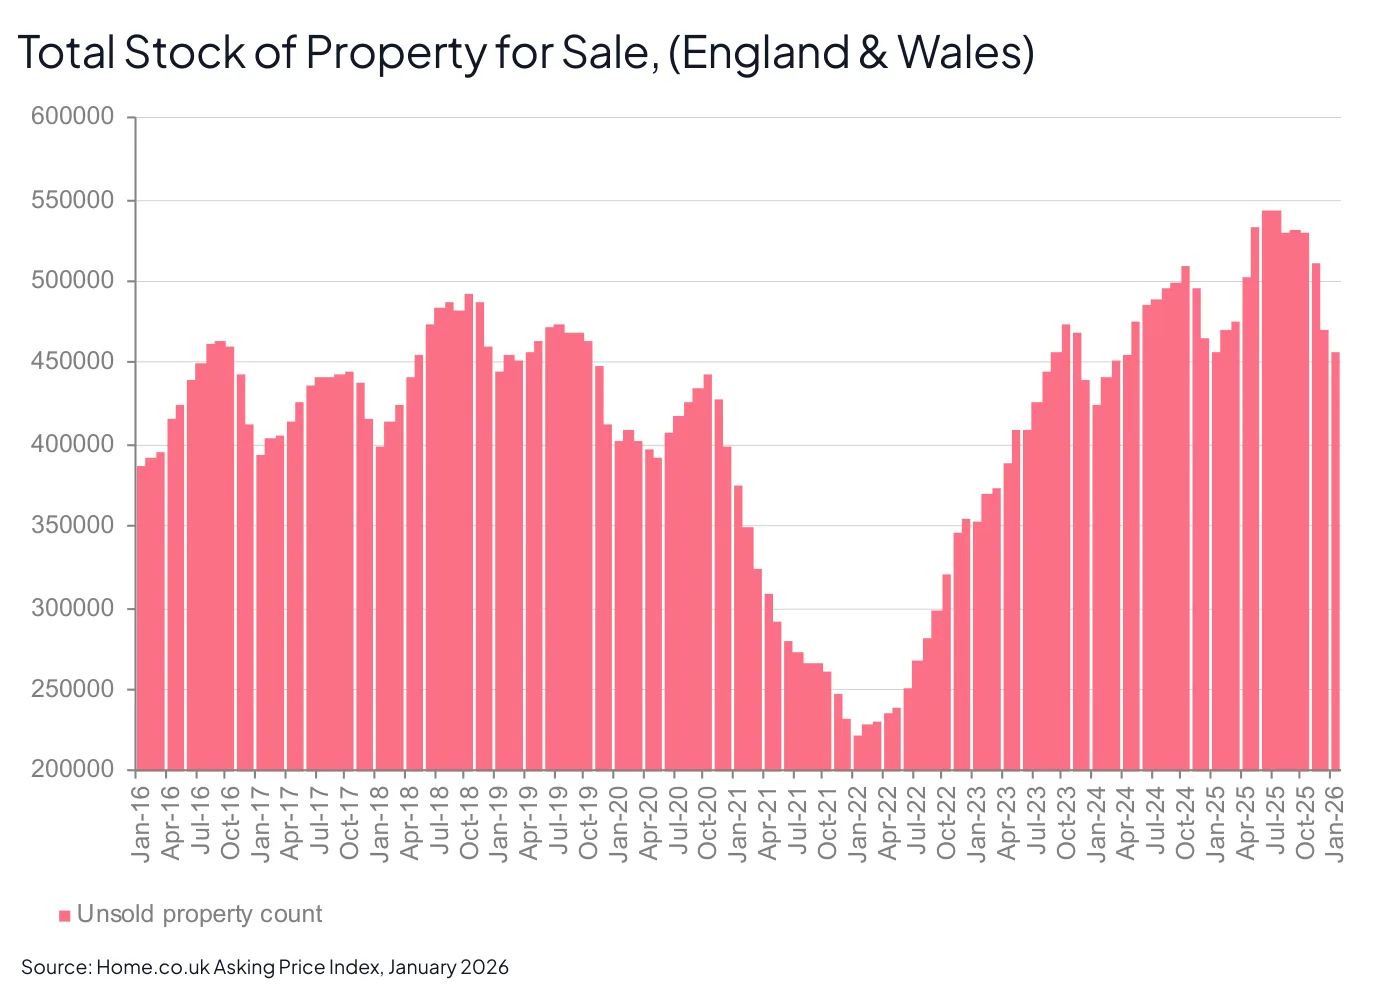
Source: Home.co.uk Asking Price Index, January 2026
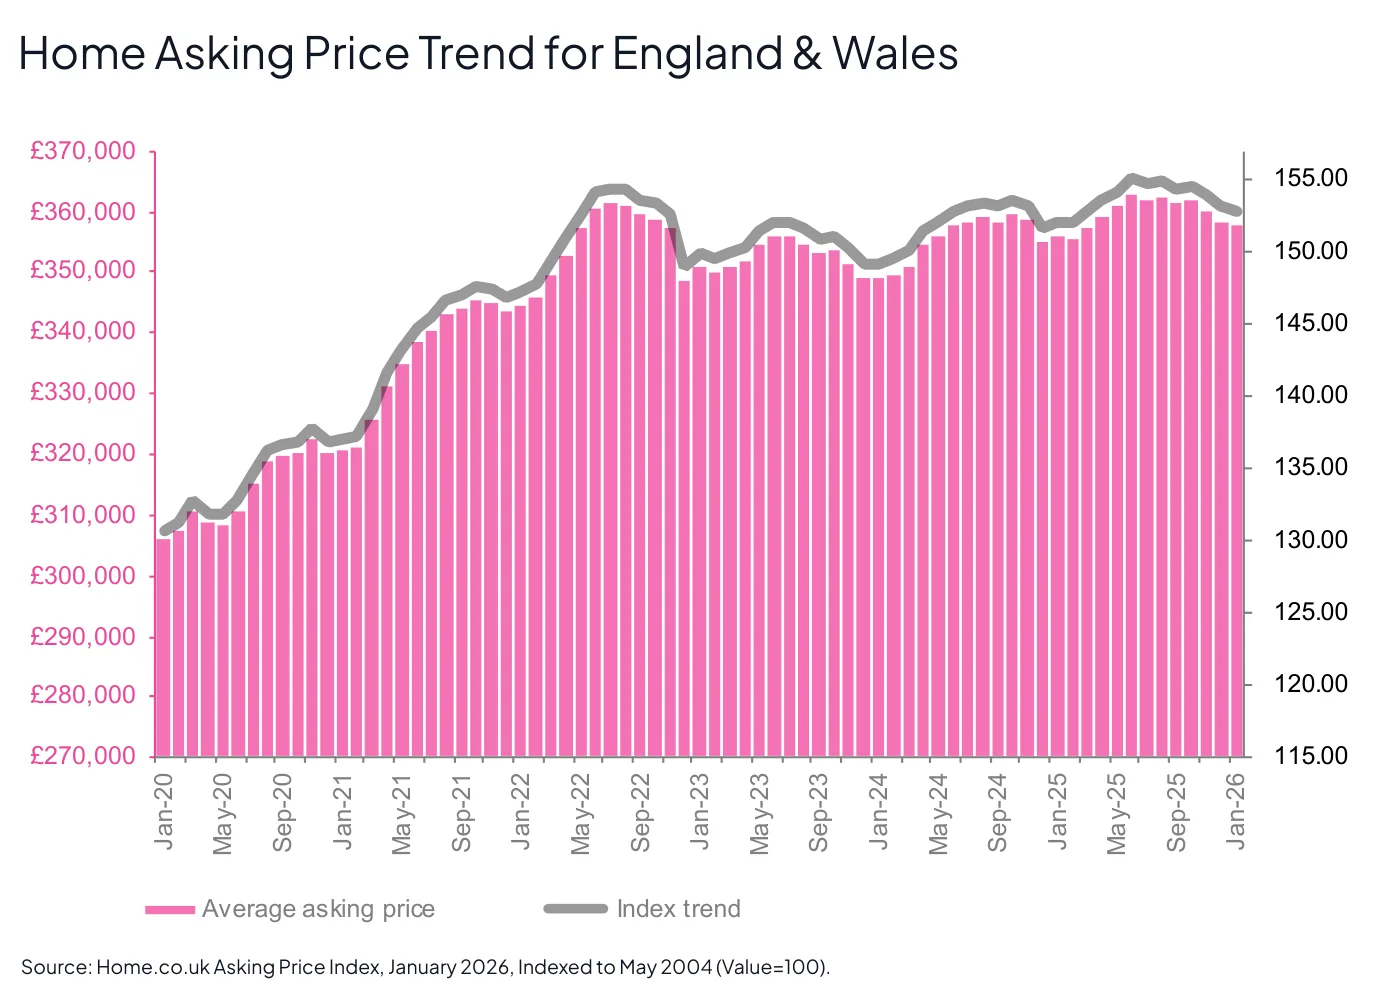
Source: Home.co.uk Asking Price Index, January 2026, Indexed to May 2004 (Value=100).
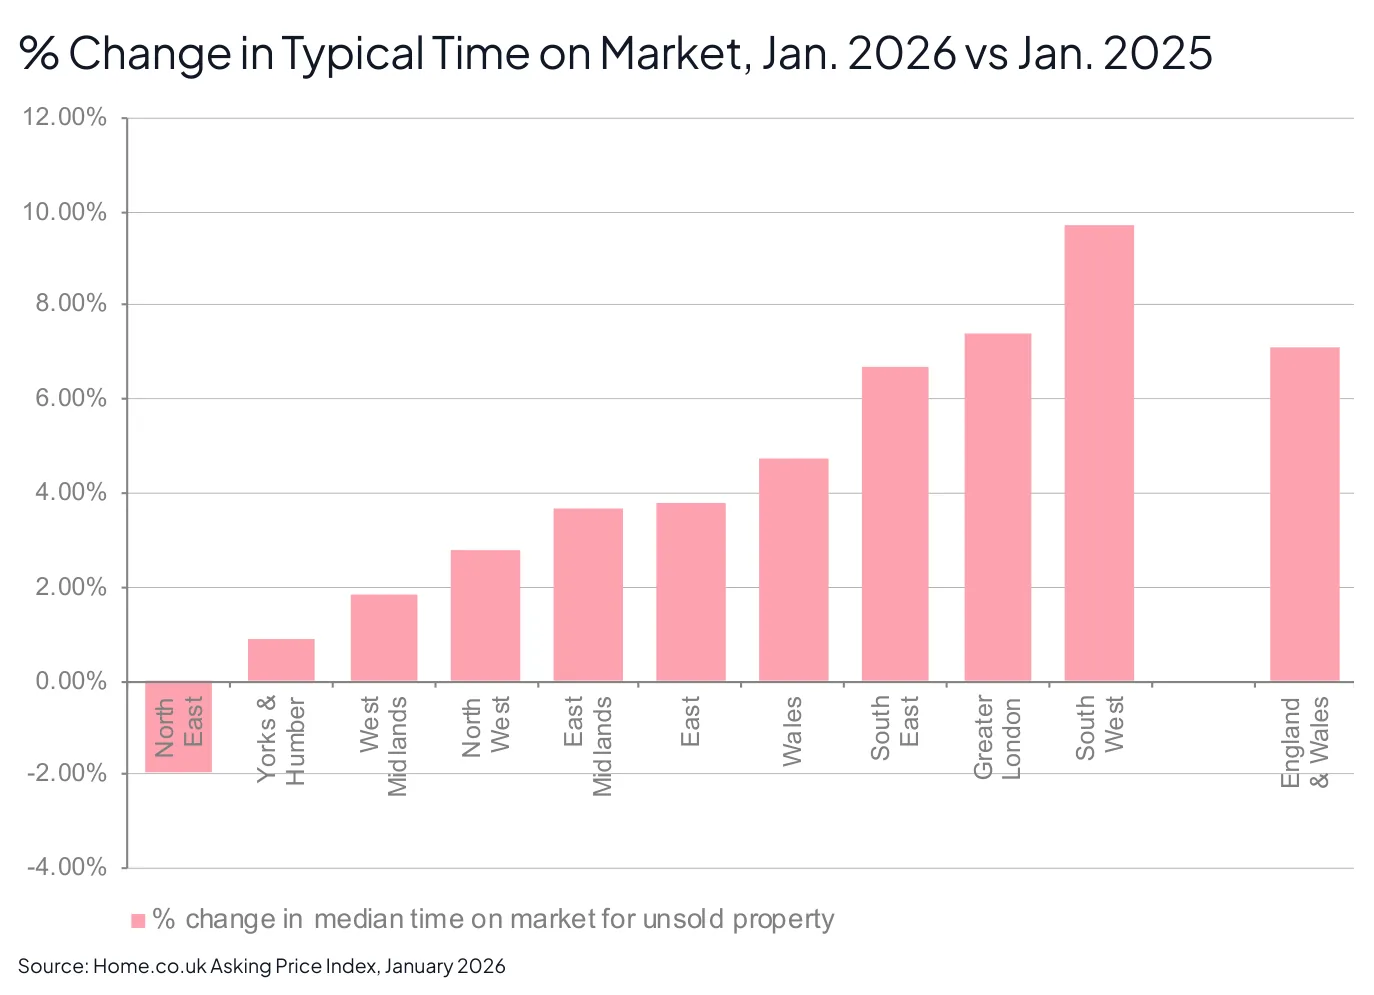
Source: Home.co.uk Asking Price Index, January 2026
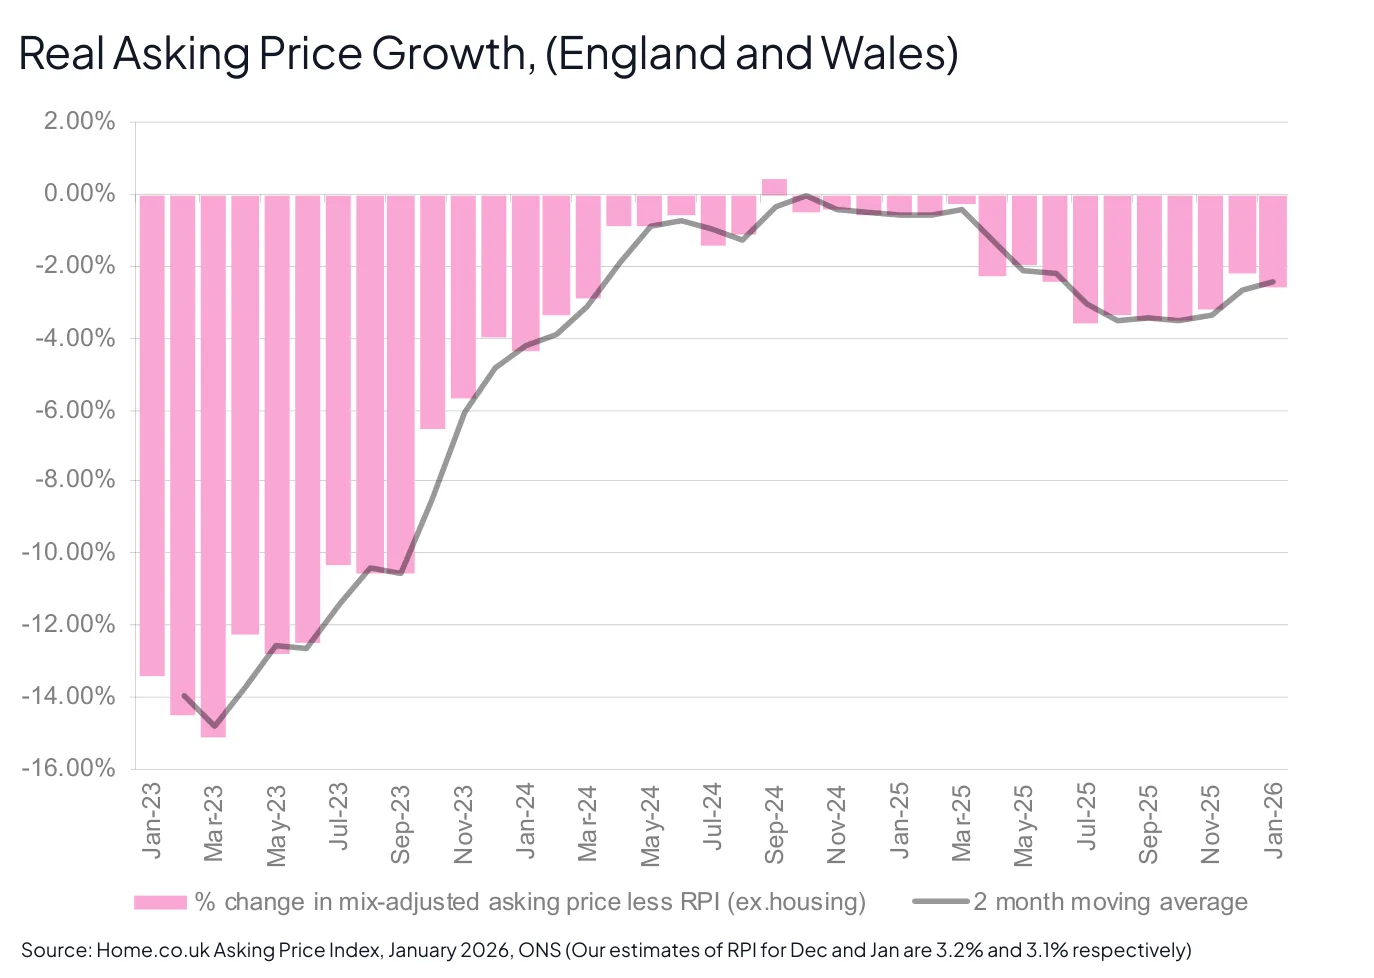
Source: Home.co.uk Asking Price Index, January 2026, ONS (Our estimates of RPI for Dec and Jan are 3.2% and 3.1% respectively)
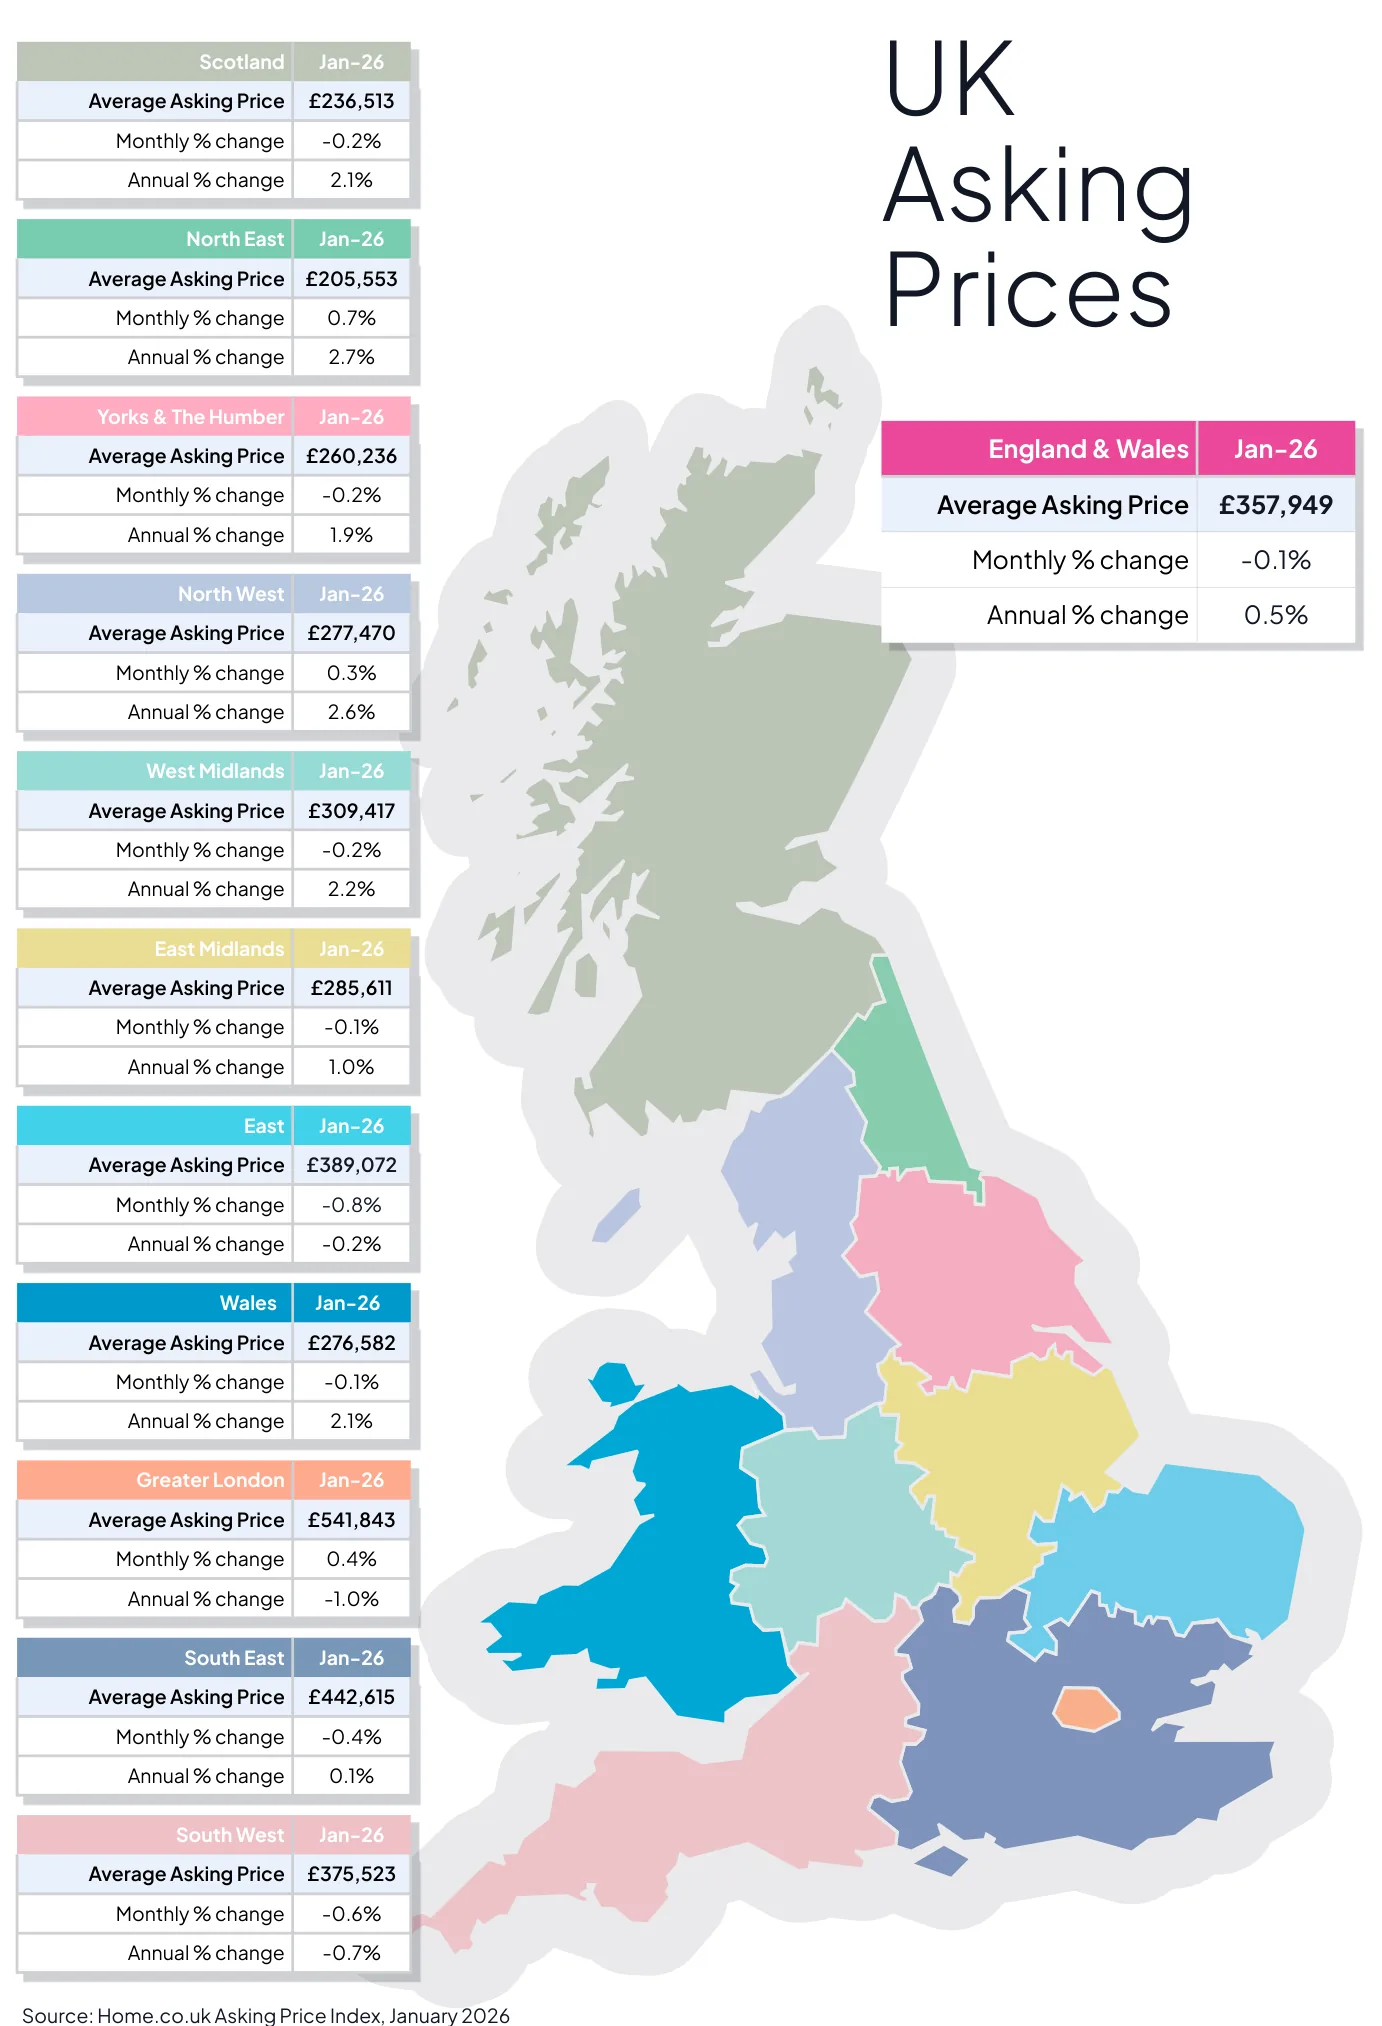
Source: Home.co.uk Asking Price Index, January 2026
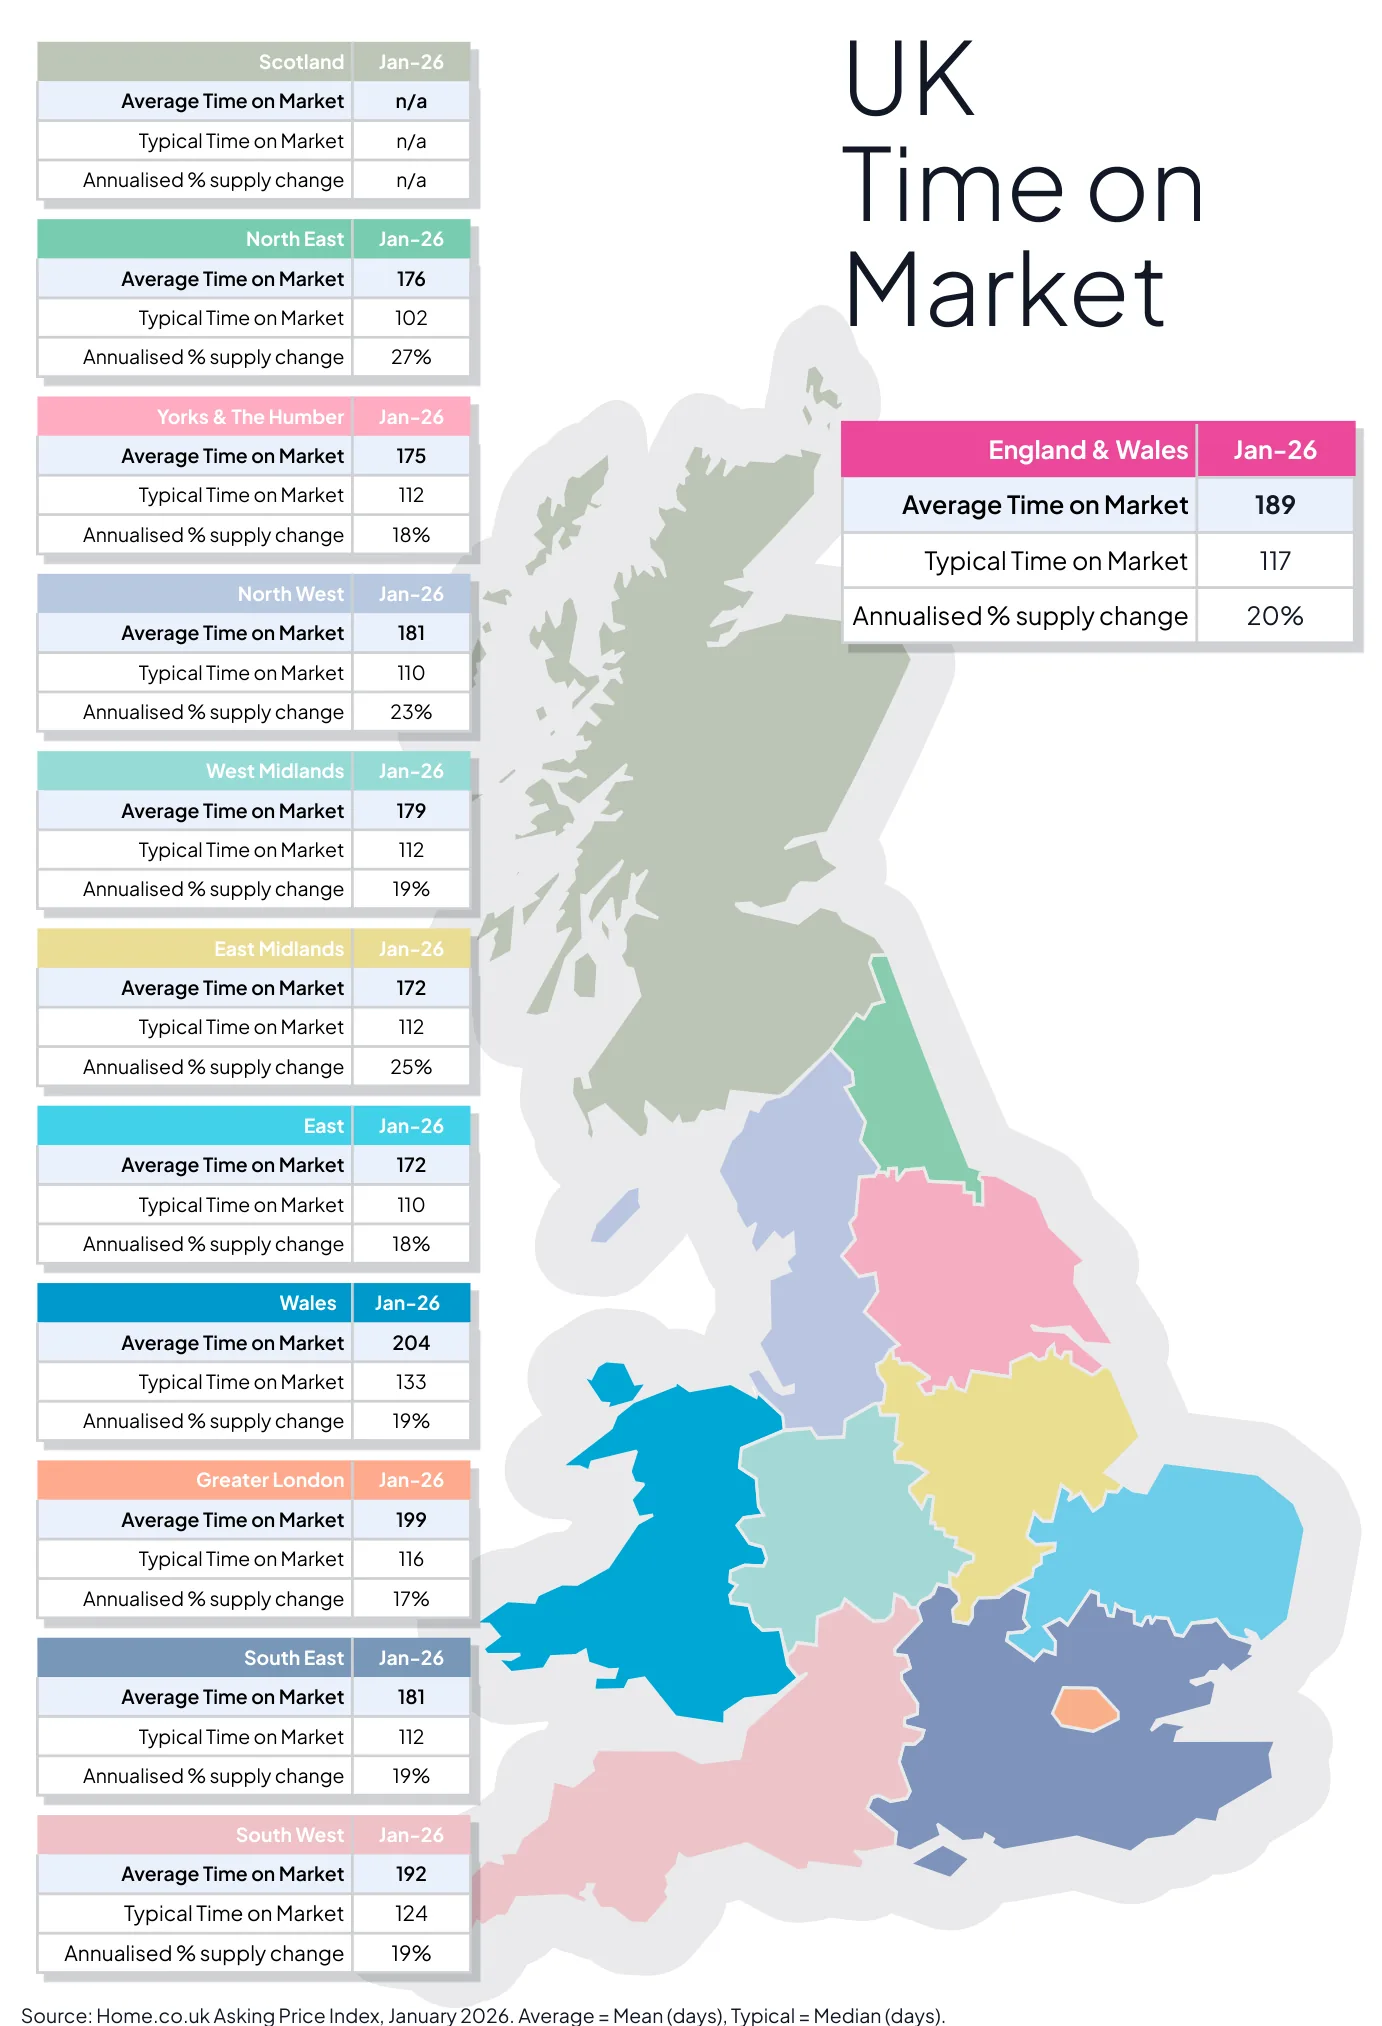
Source: Home.co.uk Asking Price Index, January 2026. Average = Mean (days), Typical = Median (days).
Regional tables
UK Asking Prices, Jan-26
| Region | Average Asking Price | Monthly % change | Annual % change |
|---|---|---|---|
| Scotland | £236,513 | -0.2% | 2.1% |
| North East | £205,553 | 0.7% | 2.7% |
| Yorks & The Humber | £260,236 | -0.2% | 1.9% |
| England & Wales | £357,949 | -0.1% | 0.5% |
| North West | £277,470 | 0.3% | 2.6% |
| West Midlands | £309,417 | -0.2% | 2.2% |
| East Midlands | £285,611 | -0.1% | 1.0% |
| East | £389,072 | -0.8% | -0.2% |
| Wales | £276,582 | -0.1% | 2.1% |
| Greater London | £541,843 | 0.4% | -1.0% |
| South East | £442,615 | -0.4% | 0.1% |
| South West | £375,523 | -0.6% | -0.7% |
UK Time on Market, Jan-26
| Region | Average Time on Market | Typical Time on Market | Annualised % supply change |
|---|---|---|---|
| Scotland | n/a | n/a | n/a |
| North East | 176 | 102 | 27% |
| Yorks & The Humber | 175 | 112 | 18% |
| England & Wales | 189 | 117 | 20% |
| North West | 181 | 110 | 23% |
| West Midlands | 179 | 112 | 19% |
| East Midlands | 172 | 112 | 25% |
| East | 172 | 110 | 18% |
| Wales | 204 | 133 | 19% |
| Greater London | 199 | 116 | 17% |
| South East | 181 | 112 | 19% |
| South West | 192 | 124 | 19% |
From the director's commentary
"This legislative restructuring of the rental market will no doubt have a negative impact on an already weakened sales market. Moreover, it could be 2027 or 2028 before the dust settles on what are the biggest changes to the way the property market functions in a generation."
Doug Shephard
Read the full January 2026 edition (PDF, 10 pages)
About the Home Asking Price Index
The Home Asking Price Index measures the change in the prices sellers ask for residential property across England, Wales and Scotland. Today it is computed every month from around half a million advertised homes and is mix-adjusted, so a change in what happens to be on the market does not move the figure; earlier editions state the sample they were built from. Because an asking price is set months before a sale completes, the index runs around five months ahead of completed-sale measures such as the UK House Price Index.
Every edition in the archive, back to October 2006, is listed on the index page. How we measure the UK property market explains the listing data behind it, and today's figures by area are on house prices and rental prices.
Text and figures above are quoted from the January 2026 edition as published, with punctuation normalised for the web, and are not revised. Later editions may restate them.
More in What is happening to house prices: the Home guide
Thinking about your next move?
See what your home's worth in seconds, with the UK's longest-running property data behind it.
Get an instant valuation