

























Home Asking Price Index, February 2026: high stock and weak demand make poor start to 2026
England and Wales asking prices rose just 0.5% year on year while unsold stock hit its highest February level since 2013.

This is the February 2026 edition of the Home Asking Price Index, released on 15 February 2026, under the headline:
High Stock and Weak Demand Make Poor Start to 2026
The headlines and summary below are the report's own words, with the key figures as it published them, followed by the report's charts and regional tables as printed.
Headlines
- Typical Time on Market for unsold properties in England and Wales moved even higher during last month and is currently six days more than in February 2025. Not since 2015 have properties spent so long on the market, including during the COVID lockdown years. The worst increases in marketing times continue to be found in London and the South West.
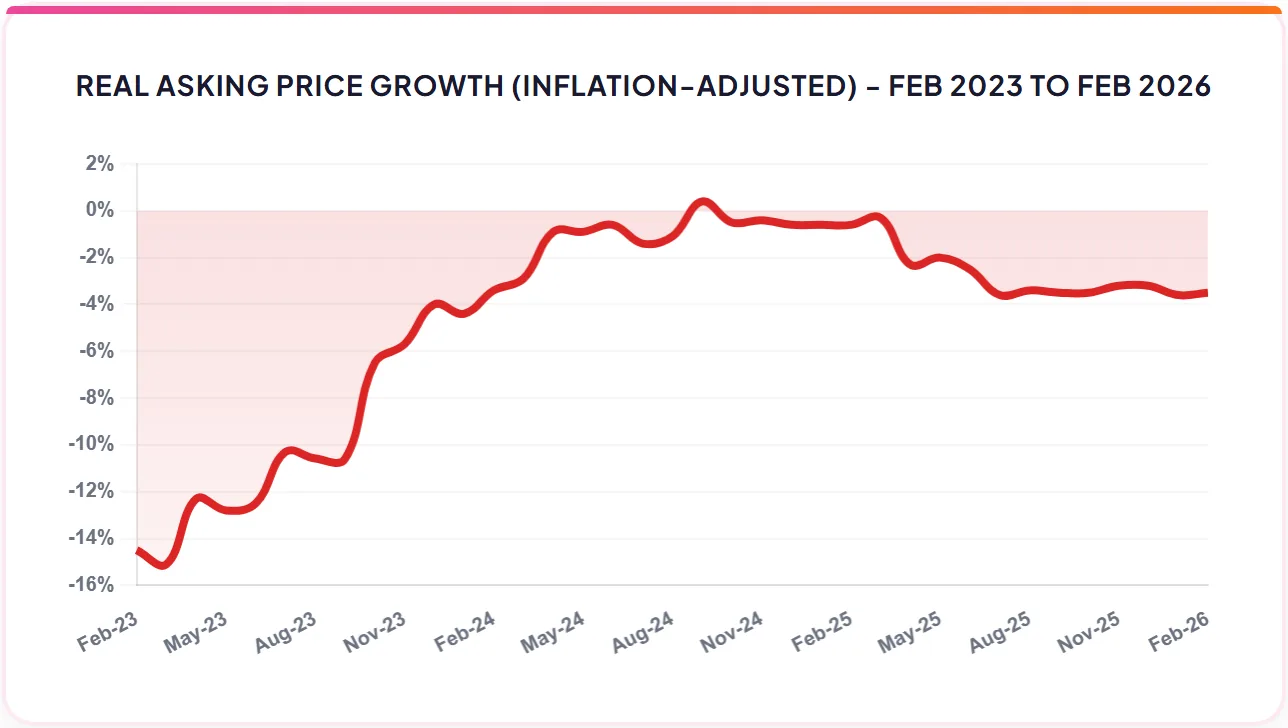
- Pricing remains very subdued for the time of year. In a vigorous market, prices normally take off and yet we observe a slide of 0.1% during January. Home prices in England and Wales are now just 0.5% higher than in February 2025.
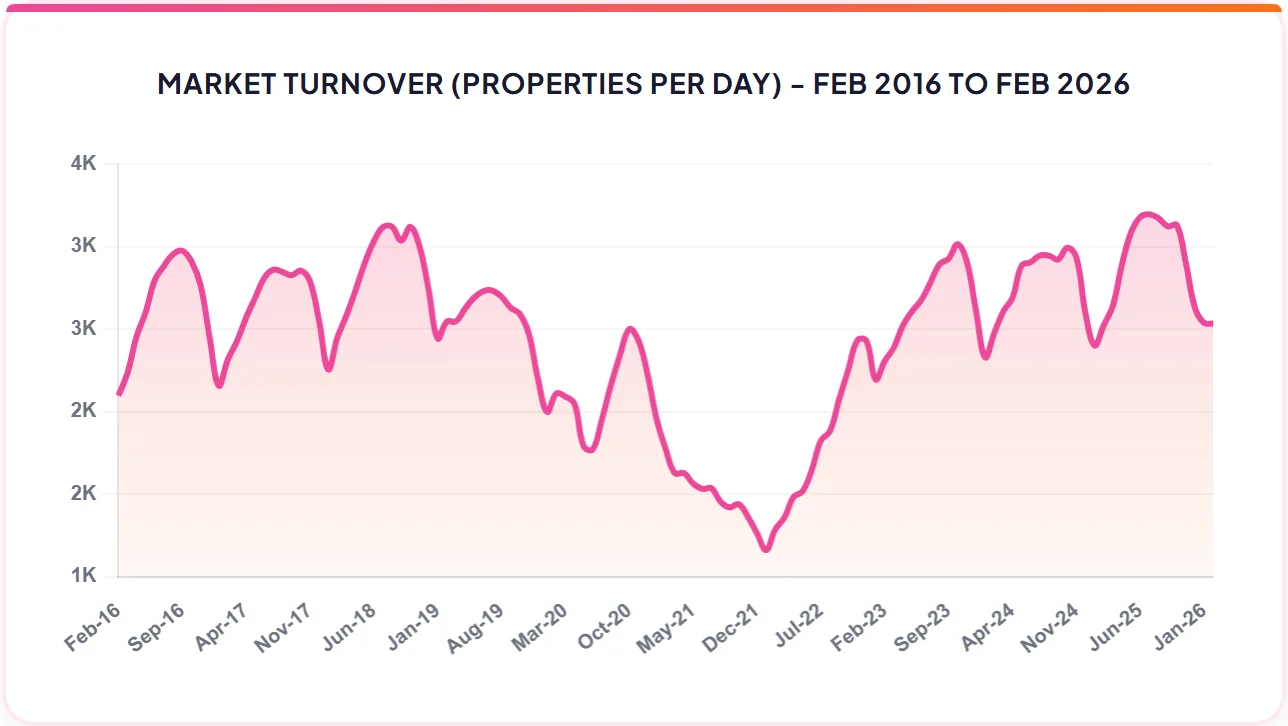
- The total number of new instructions in January came in at 13% less than in January 2025. However, the total of 101,079 is much higher than observed in Jan. 2022 and Jan. 2023, indicating that supply remains far from tight. The most significant year-on-year reductions of new sales listings were in London, the North West and Wales.
- As expected, the total unsold stock on the market has begun its rapid seasonal ascent. The current level is essentially the same as February 2025's total, although we would need to look back to 2013 to see a higher unsold property count for the month of February.
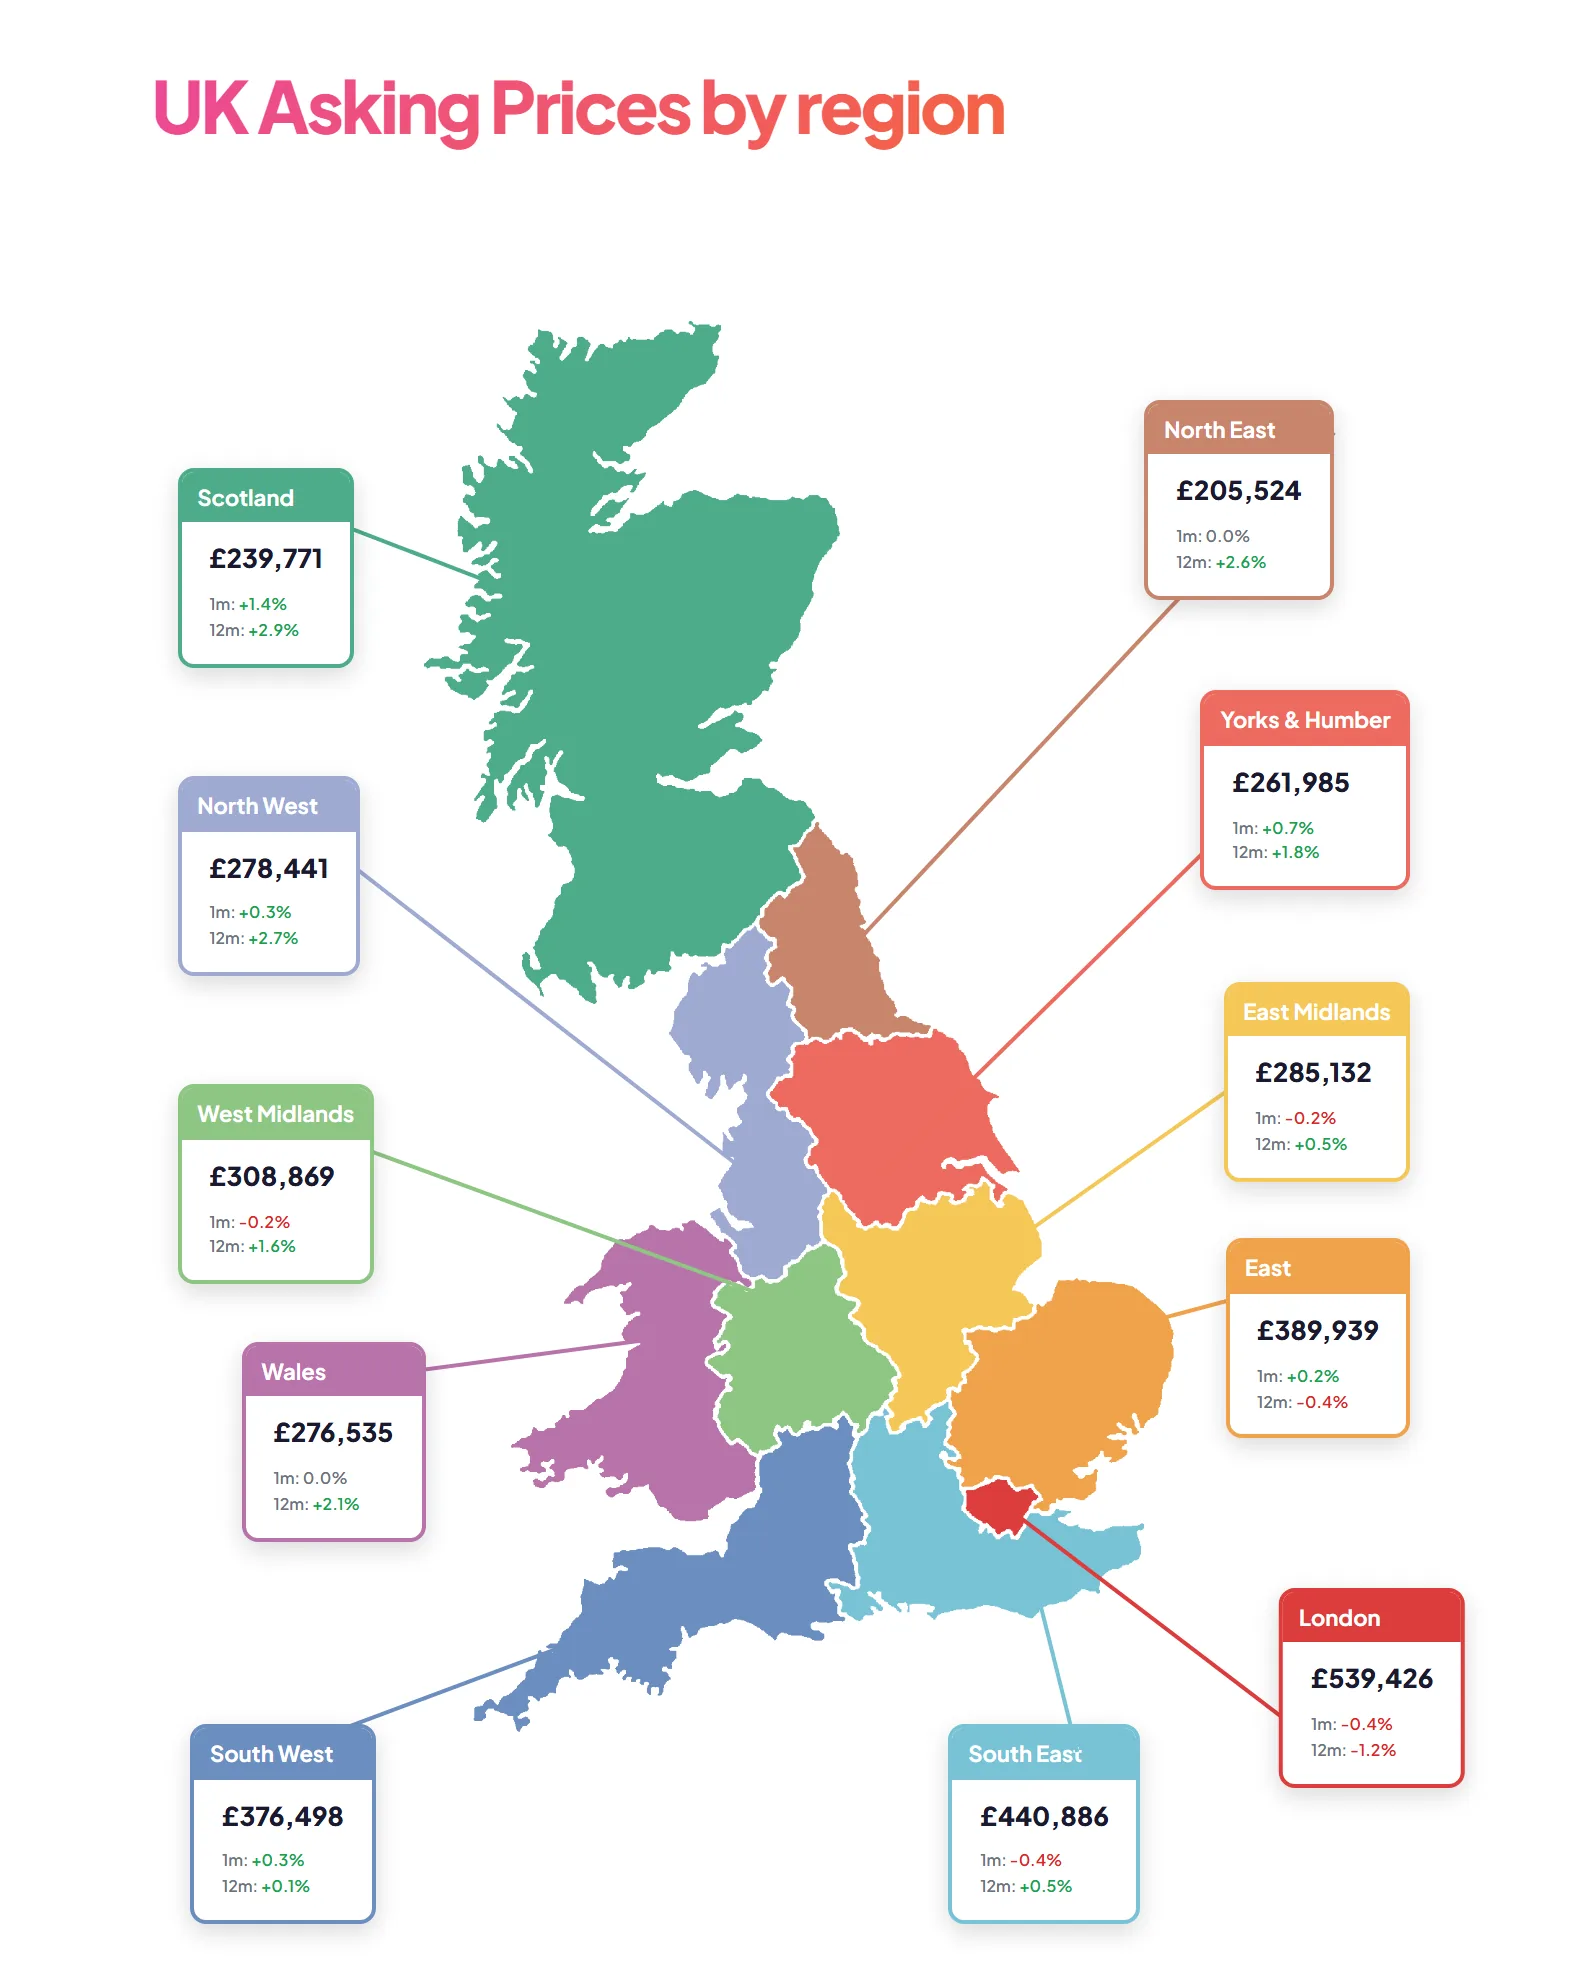
- The mix-adjusted average slipped in several English regions, with London and the South East losing the most ground. Yorkshire and Scotland indicated the largest rises of 0.7% and 1.4% respectively. Scotland is now the top regional property market growth leader with a year-on-year gain of 2.9%, followed by the North West with an annualised rise of 2.7%. Meanwhile, London remains the weakest regional performer with a worsening annualised decline of 1.2%.
- The annualised national growth in asking rents reads slightly better than last month at -3.7%, which is a marginal improvement on the January figure ( -4.1%). All English regions, Scotland and Wales continue to indicate year-on-year declines in the mix-adjusted average asking rent. The worst performers are the East Midlands and Yorkshire with annualised declines of 10.2% and 10.9% respectively.
Summary
The UK property market is lacking in vitality. Our February figures indicate soft pricing and a slightly slowing market, neither of which is expected at this time of year.
One seasonal expectation still bears out, however, and that is the ramping up of stock levels. Together, these factors signal a rather difficult start to the year.
Meanwhile, mortgage lenders are seemingly falling over each other to cut rates in order to retain market share during a time of reduced demand. Many of the new deals are in high loan-to-value (LTV) products which are commonly sought by first-time buyers. Of course, as is the norm nowadays, the fees will still be substantial.
Key figures
| Measure | Figure |
|---|---|
| Average asking price (England & Wales) | £357,740 |
| Monthly change in asking prices | -0.1% |
| Annual change in asking prices | +0.5% |
| Typical Time on Market | 118 days |
| New instructions (January) | 101,079 |
| Annual change in new instructions | -13% |
| Total unsold stock | 470K |
| Annual change in asking rents | -3.7% |
Figures are for England and Wales unless the report states otherwise, as published in the edition.
Charts from the report
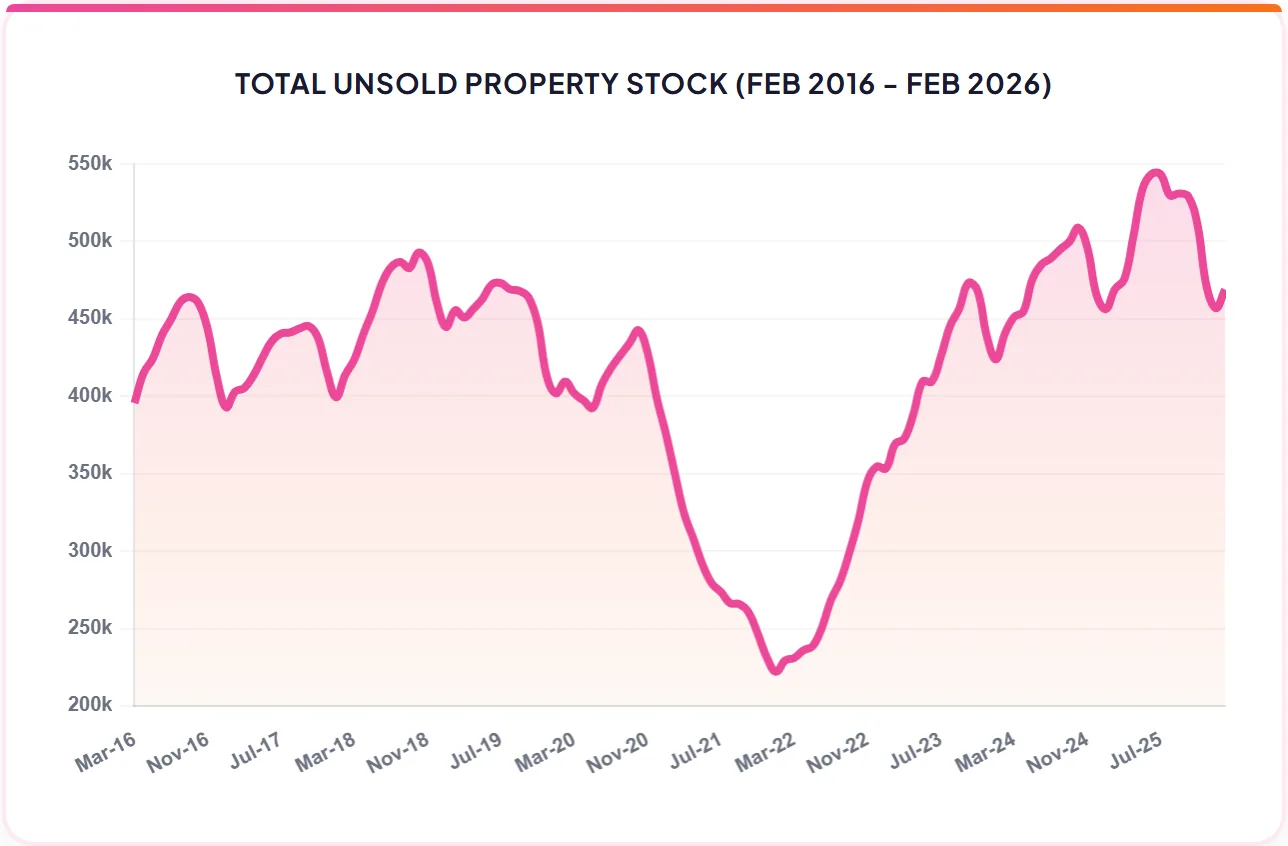
Source: Home.co.uk Property Search Index
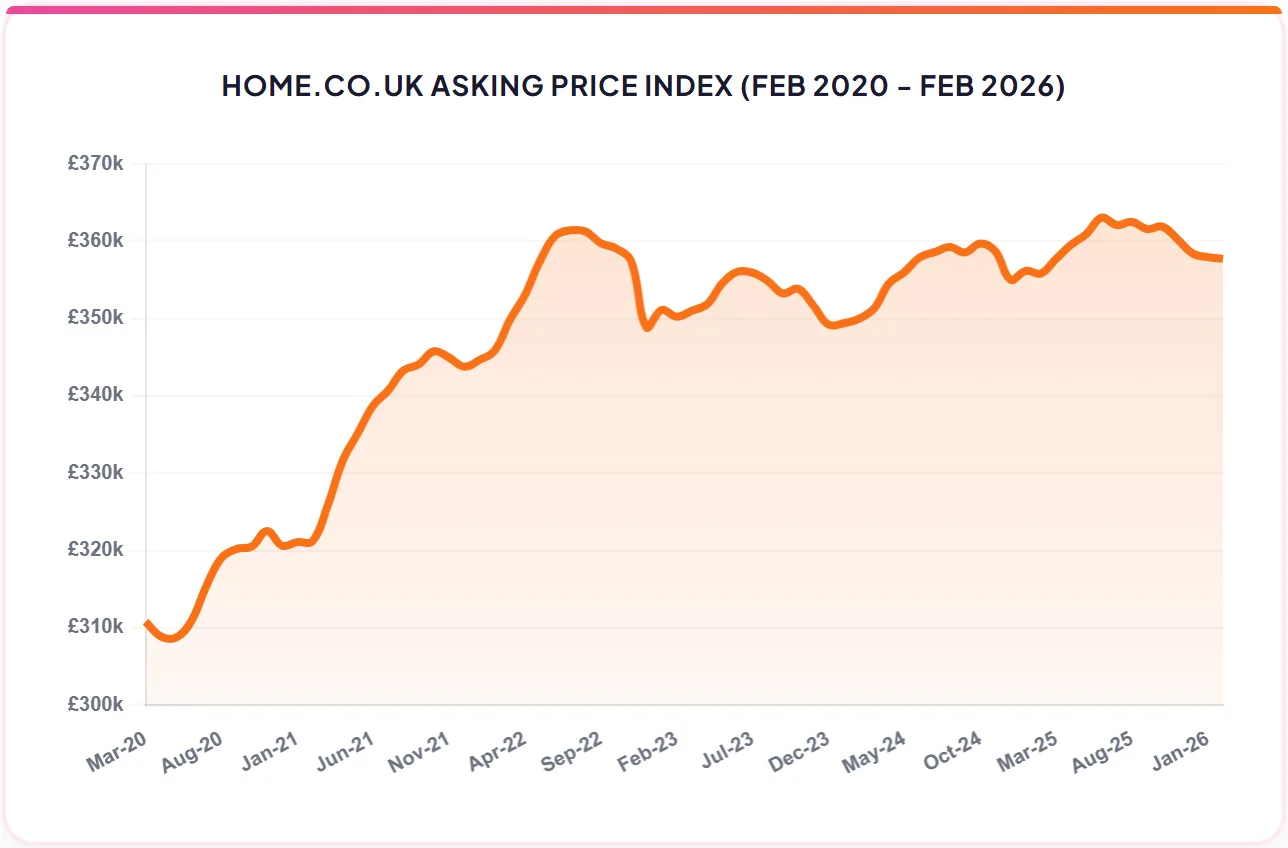
Source: Home.co.uk HAPI Index
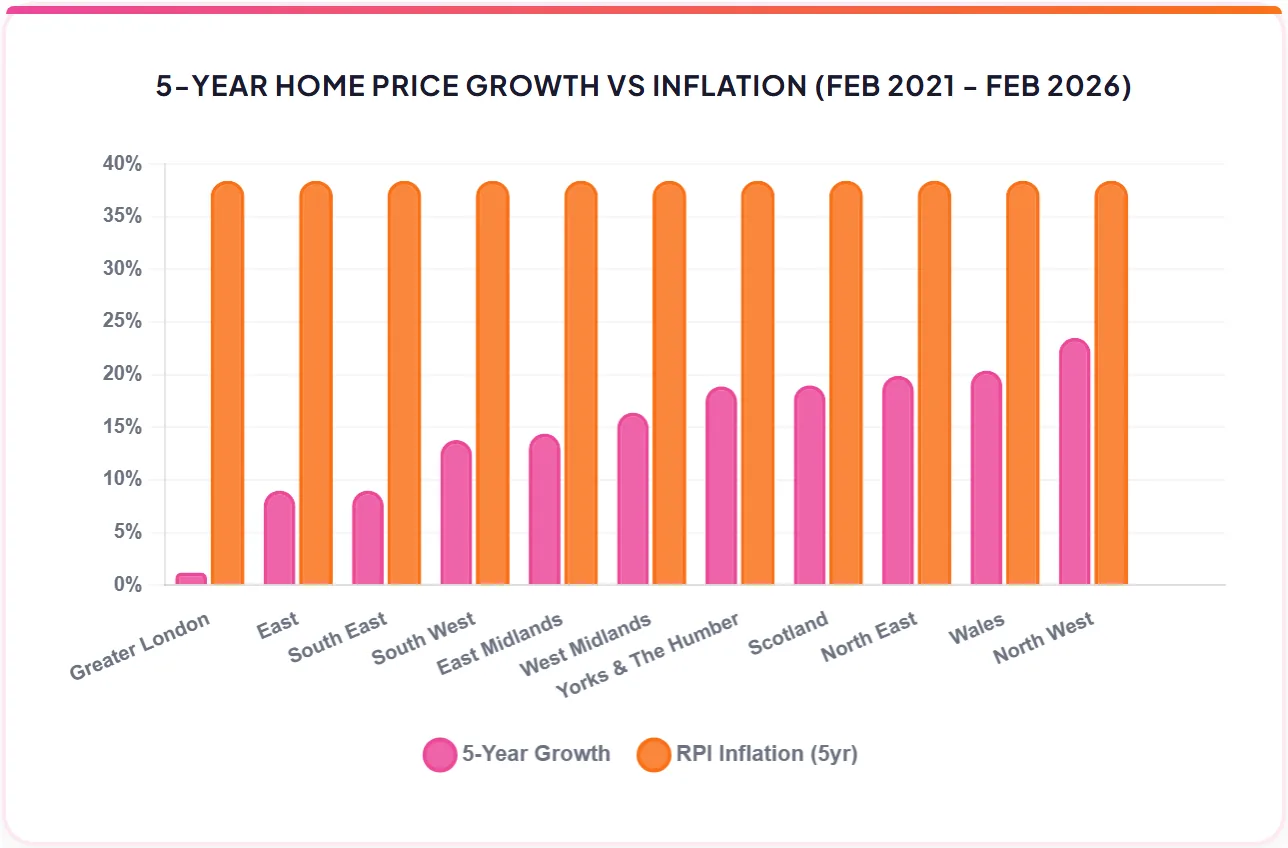
Source: Home.co.uk and Office for National Statistics
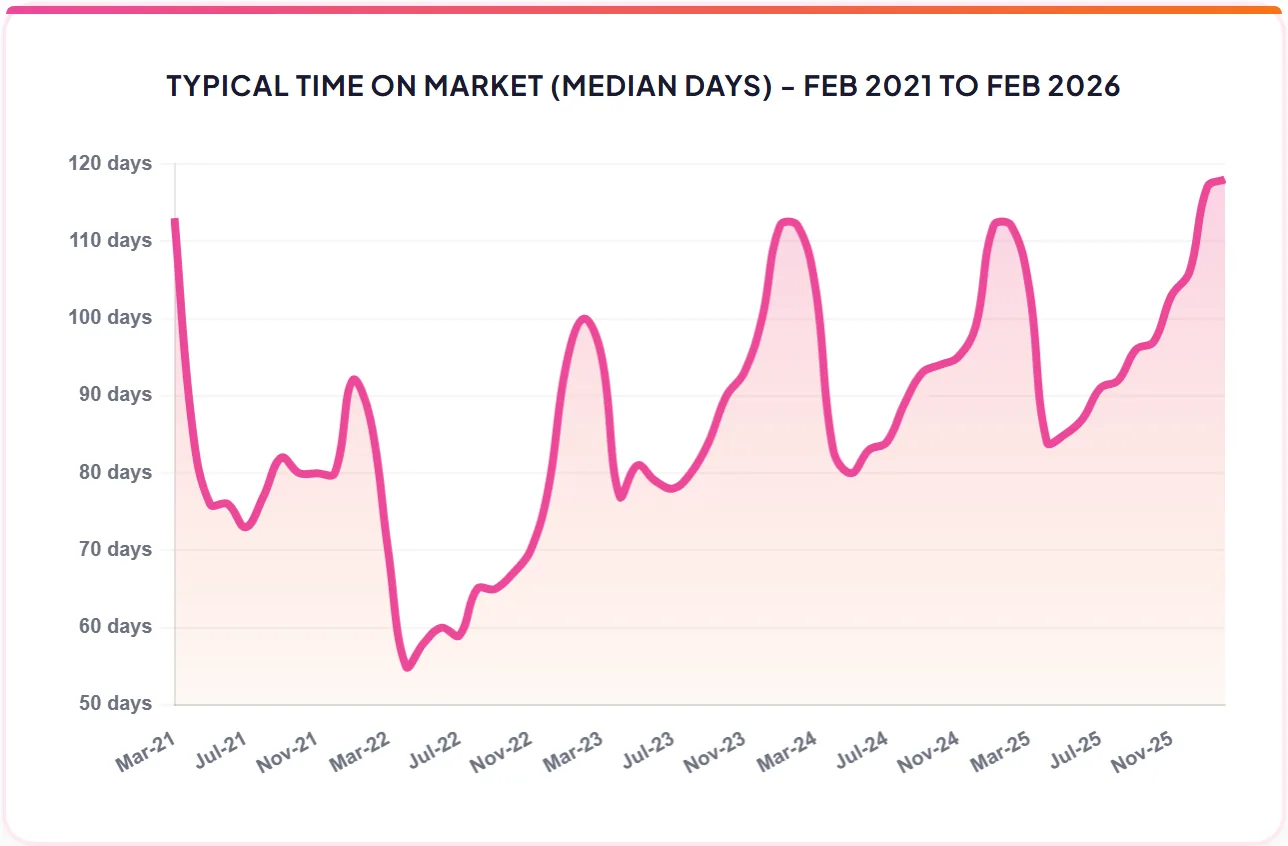
Source: Home.co.uk | Note: Average = Mean, Typical = Median days on market of unsold property
Regional tables
UK Asking Prices by region
| Region | Average asking price | 1 month | 12 months |
|---|---|---|---|
| Scotland | £239,771 | +1.4% | +2.9% |
| North East | £205,524 | 0.0% | +2.6% |
| North West | £278,441 | +0.3% | +2.7% |
| Yorks & Humber | £261,985 | +0.7% | +1.8% |
| Wales | £276,535 | 0.0% | +2.1% |
| West Midlands | £308,869 | -0.2% | +1.6% |
| East Midlands | £285,132 | -0.2% | +0.5% |
| East | £389,939 | +0.2% | -0.4% |
| London | £539,426 | -0.4% | -1.2% |
| South East | £440,886 | -0.4% | +0.5% |
| South West | £376,498 | +0.3% | +0.1% |
Regional Time on Market - February 2026
| Region | Average days | Typical days | Annual supply change |
|---|---|---|---|
| East Anglia | 167 | 109 | 18% |
| East Midlands | 169 | 113 | 25% |
| Greater London | 194 | 117 | 17% |
| North East | 172 | 103 | 27% |
| North West | 176 | 109 | 23% |
| South East | 173 | 111 | 19% |
| South West | 190 | 126 | 19% |
| Wales | 206 | 138 | 19% |
| West Midlands | 175 | 115 | 19% |
| Yorks & Humber | 173 | 117 | 18% |
From the director's commentary
"Should they all attempt to sell one property this year, that would mean around 900,000 additional properties entering the sales market. This would be a veritable tsunami of inventory which would dwarf the current total of stock for sale (around 470,000)."
Read the full February 2026 edition
About the Home Asking Price Index
The Home Asking Price Index measures the change in the prices sellers ask for residential property across England, Wales and Scotland. Today it is computed every month from around half a million advertised homes and is mix-adjusted, so a change in what happens to be on the market does not move the figure; earlier editions state the sample they were built from. Because an asking price is set months before a sale completes, the index runs around five months ahead of completed-sale measures such as the UK House Price Index.
Every edition in the archive, back to October 2006, is listed on the index page. How we measure the UK property market explains the listing data behind it, and today's figures by area are on house prices and rental prices.
Text and figures above are quoted from the February 2026 edition as published, with punctuation normalised for the web, and are not revised. Later editions may restate them.
More in What is happening to house prices: the Home guide
Thinking about your next move?
See what your home's worth in seconds, with the UK's longest-running property data behind it.
Get an instant valuation