

























Home Asking Price Index, December 2025: prices slide and supply plummets as vendors wait and see
Asking prices fell 0.5% in November while new instructions dropped 29% year-on-year, reflecting vendor hesitancy ahead of the budget and Bank of England rate decision.
This is the December 2025 edition of the Home Asking Price Index, released on 15 December 2025, under the headline:
Prices Slide and Supply Plummets as Vendors Wait and See
The headlines and summary below are the report's own words, with the key figures as it published them, followed by the report's charts and regional tables as printed.
Headlines
- Vendor numbers crashed during November. Following the October surge which showed the highest number of new instructions for that month in many years, supply has slumped to the lowest November figure since the dark days of post-crisis 2010. Such a huge drop (29% down vs. Nov 2024) indicates the level of vendor hesitancy brought about by the controversial budget from Rachel Reeves and the forthcoming Bank of England decision on interest rates. The largest falls were in the South West, North West and Greater London.
- Home prices continue their seasonal slide. The mix-adjusted average asking price for England and Wales dropped by 0.5% during November, making the annualised growth figure just 1.0%, woefully outpaced by monetary inflation. Yorkshire indicated the largest month-on-month decline.
- The notable glut of unsold stock on the market that formed over the summer months is now reducing rapidly. Thanks in part to vendor hesitancy, the total portfolio count for England and Wales is now just 1.2% more than in December 2024. Total stock dropped by 40K during November and this large reduction will help to support prices while it lasts.
- The North West is the top regional property market growth leader with a year-on-year gain of 2.6%, followed by the West Midlands. Meanwhile, London remains the worst regional performer with an annualised decline of 0.7%.
- Typical Time on Market (TTM) for unsold properties continues to trend higher and is currently seven days more than in December last year.
- The annualised national growth in asking rents trends further into the negative (now -3.8%). Scotland, Wales and all English regions (apart from the North West which shows no change) indicate year-on-year declines in the mix-adjusted average asking rent. The worst performer is the East Midlands with an annualised decline of 13.4%.
- Twenty of the 33 London boroughs indicate positive asking rent growth (up from 17 last month). Kensington and Chelsea is the slowest market (TTM: 39 days) while Barking and Dagenham is the fastest lettings borough (TTM: 15 days).
Summary
The normal sales market dynamic has been grossly distorted by a late autumn budget and the pending decision on interest rates by the Bank of England's Monetary Policy Committee. Many potential vendors, fearful of yet another tax-grabbing budget, sat on their hands rather than enter the market, preferring to wait until the dust settles. The result of all this unnecessary uncertainty before the announcement on the 26th was that 29% fewer properties than expected entered the market in November.
Buyer demand in the New Year will depend in part on the next Bank of England (BoE) interest rate decision on 18th December. A cut of 0.25% is currently priced in by the markets and this move to lower borrowing costs would be a welcome early Christmas present for UK property sales. On the other hand, should the BoE be hawkish about inflation risks and hold the base rate at 4%, this would create significant negative sentiment among hopeful buyers.
Key figures
| Measure | Figure |
|---|---|
| Monthly change in asking prices | -0.5% |
| Annualised price growth | 1.0% |
| New instructions vs Nov 2024 | -29% |
| Total portfolio count vs Dec 2024 | +1.2% |
| Total stock change in November | -40K |
| Annualised asking rent growth | -3.8% |
Figures are for England and Wales unless the report states otherwise, as published in the edition.
Charts from the report
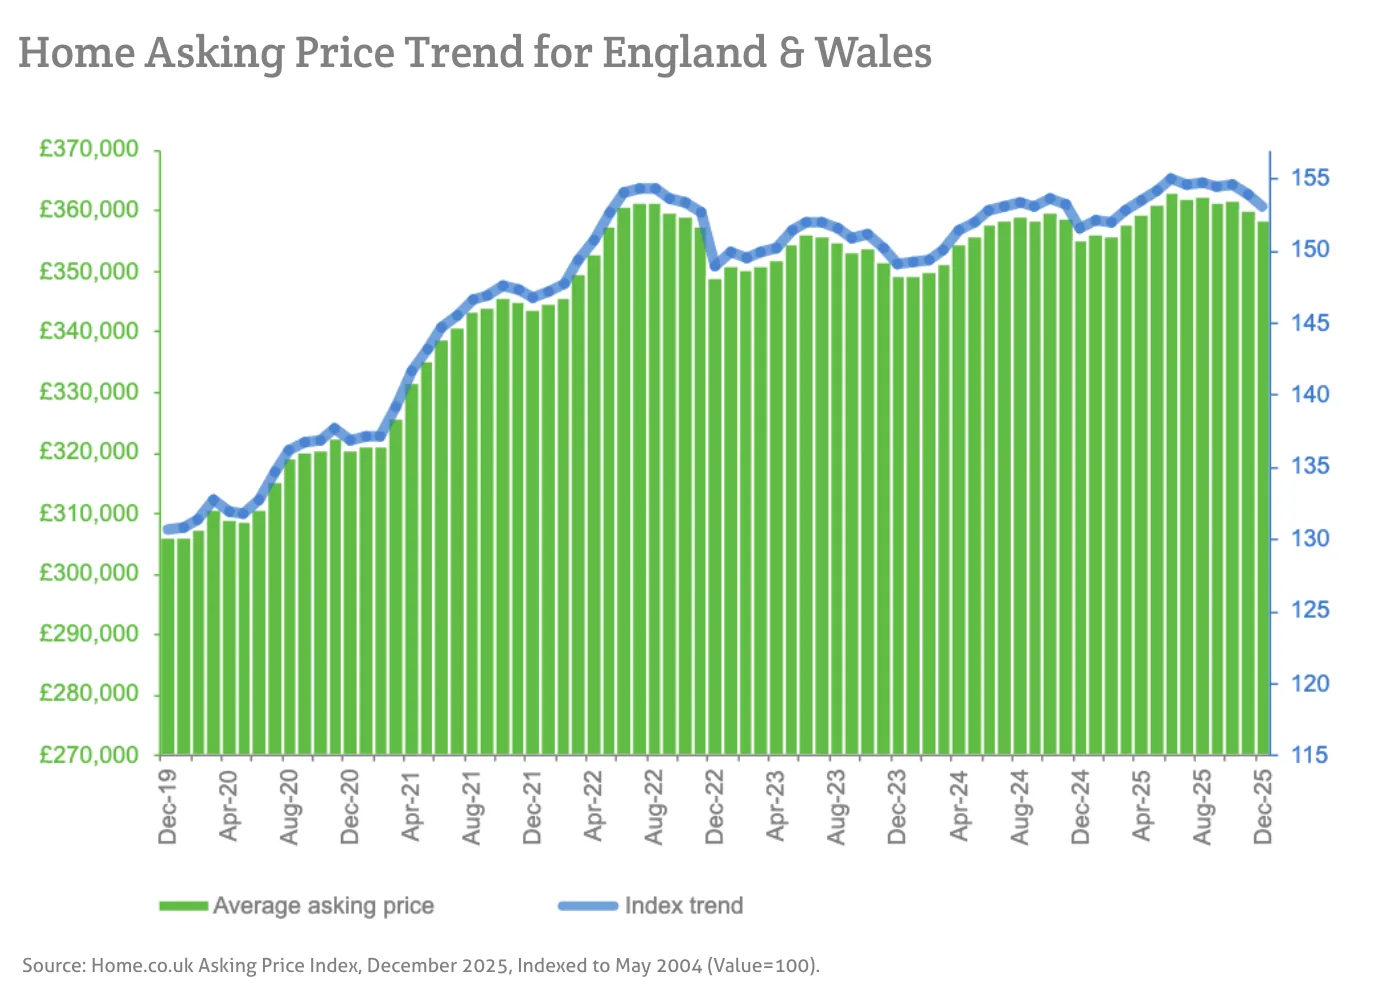
Source: Home.co.uk Asking Price Index, December 2025, Indexed to May 2004 (Value=100).
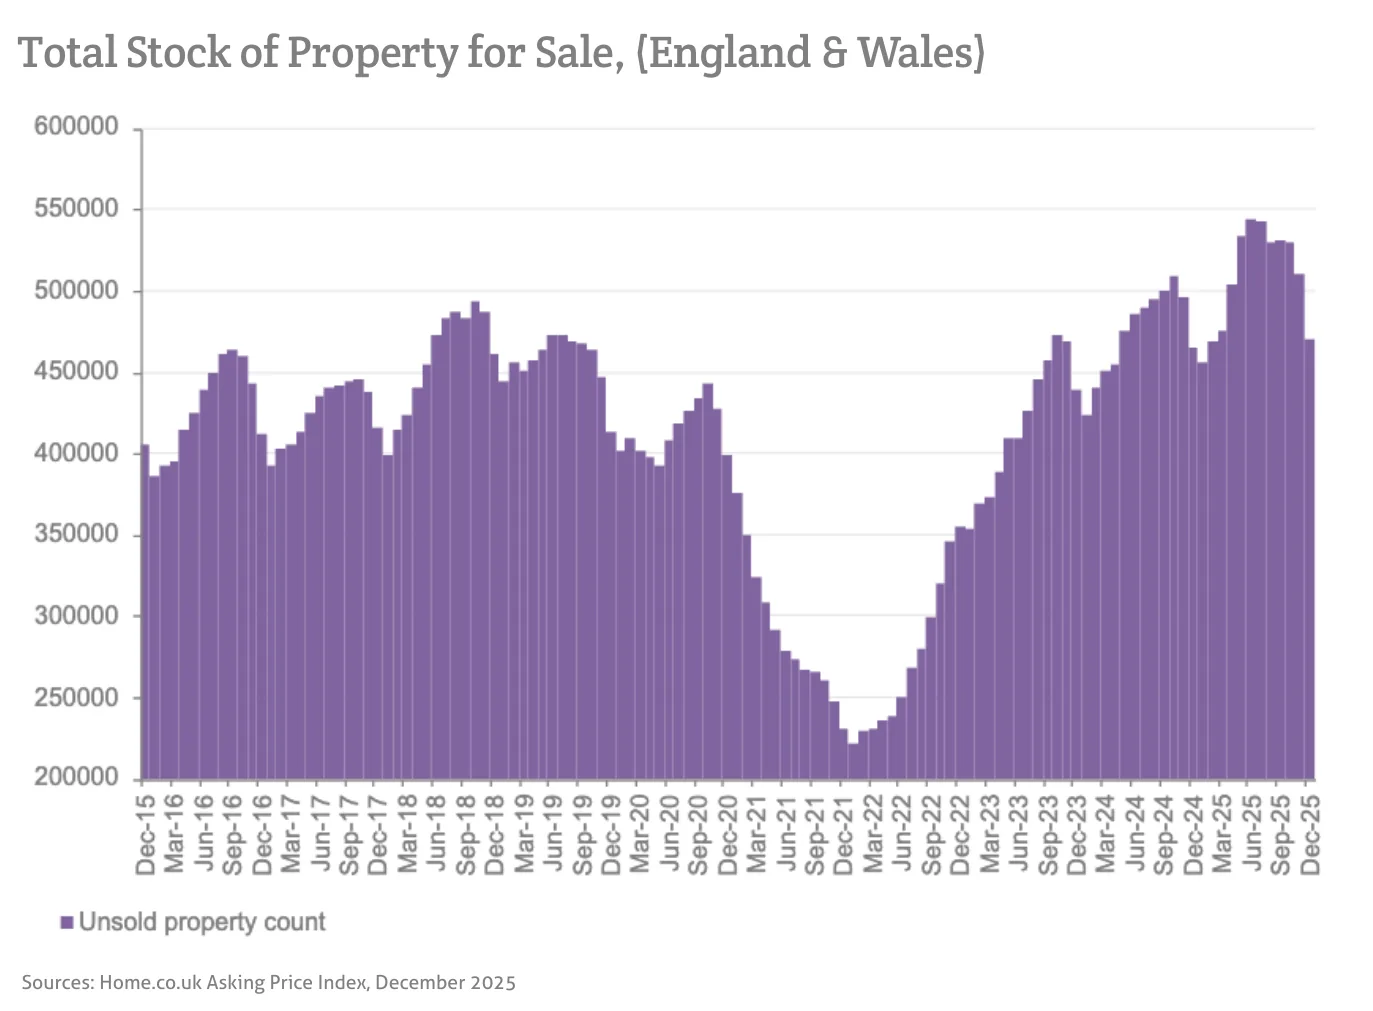
Sources: Home.co.uk Asking Price Index, December 2025
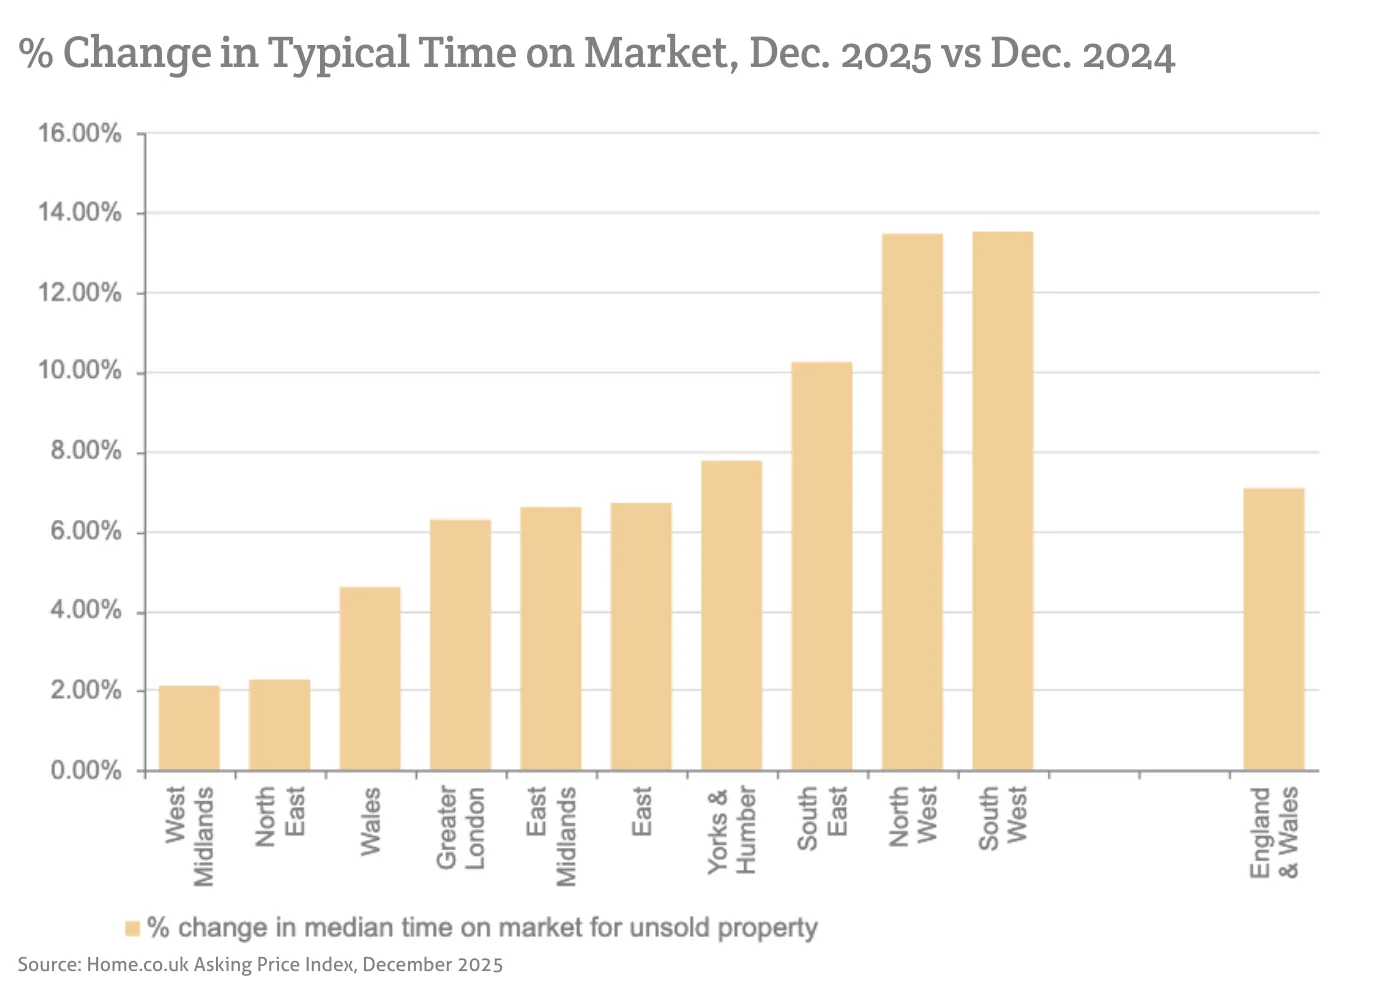
Source: Home.co.uk Asking Price Index, December 2025
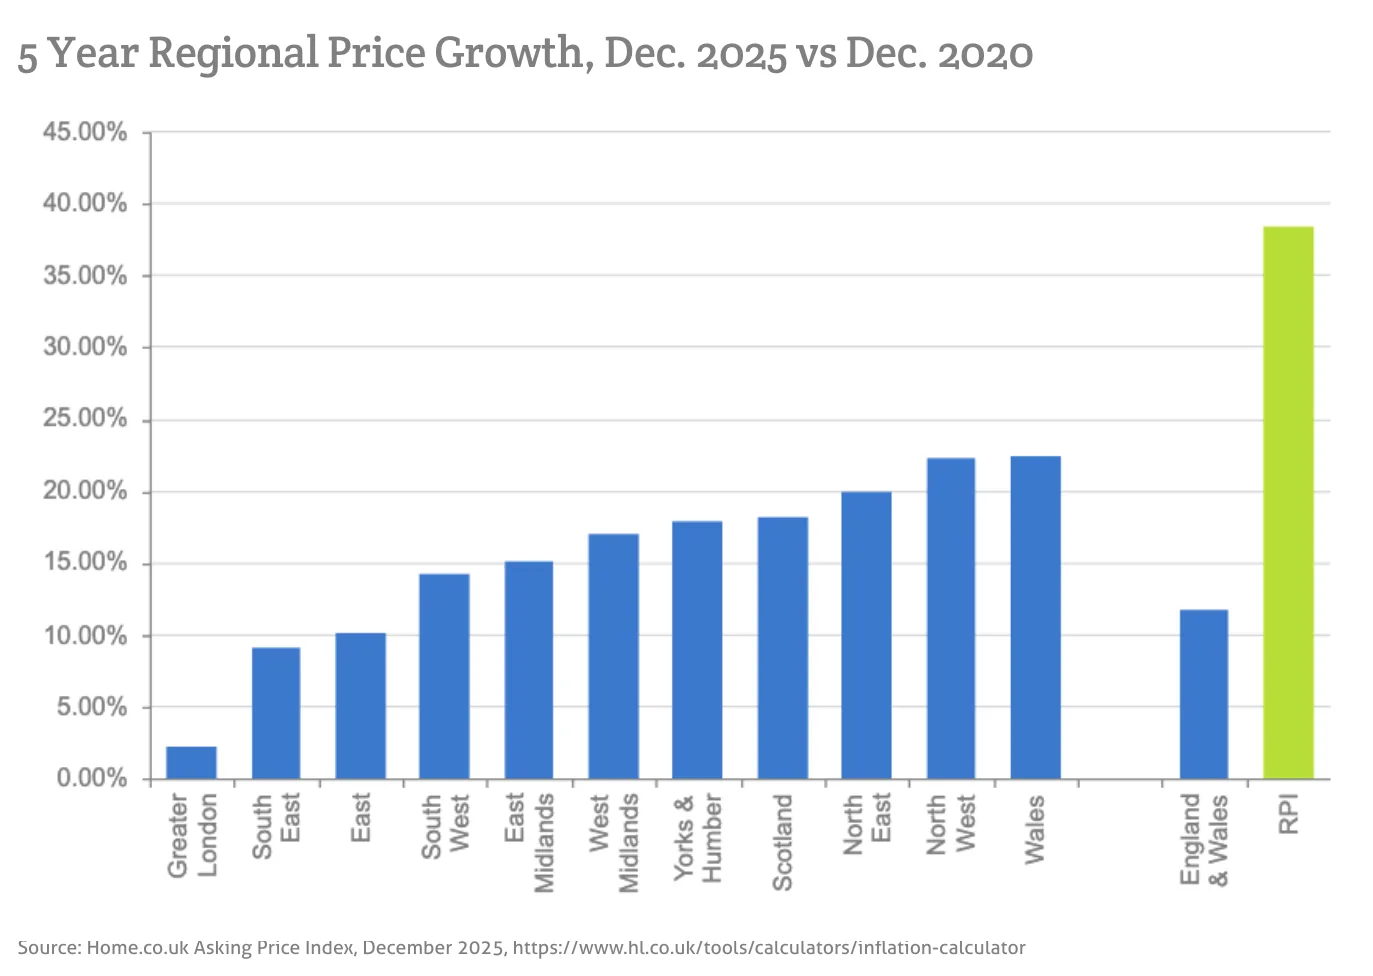
Source: Home.co.uk Asking Price Index, December 2025, https://www.hl.co.uk/tools/calculators/inflation-calculator
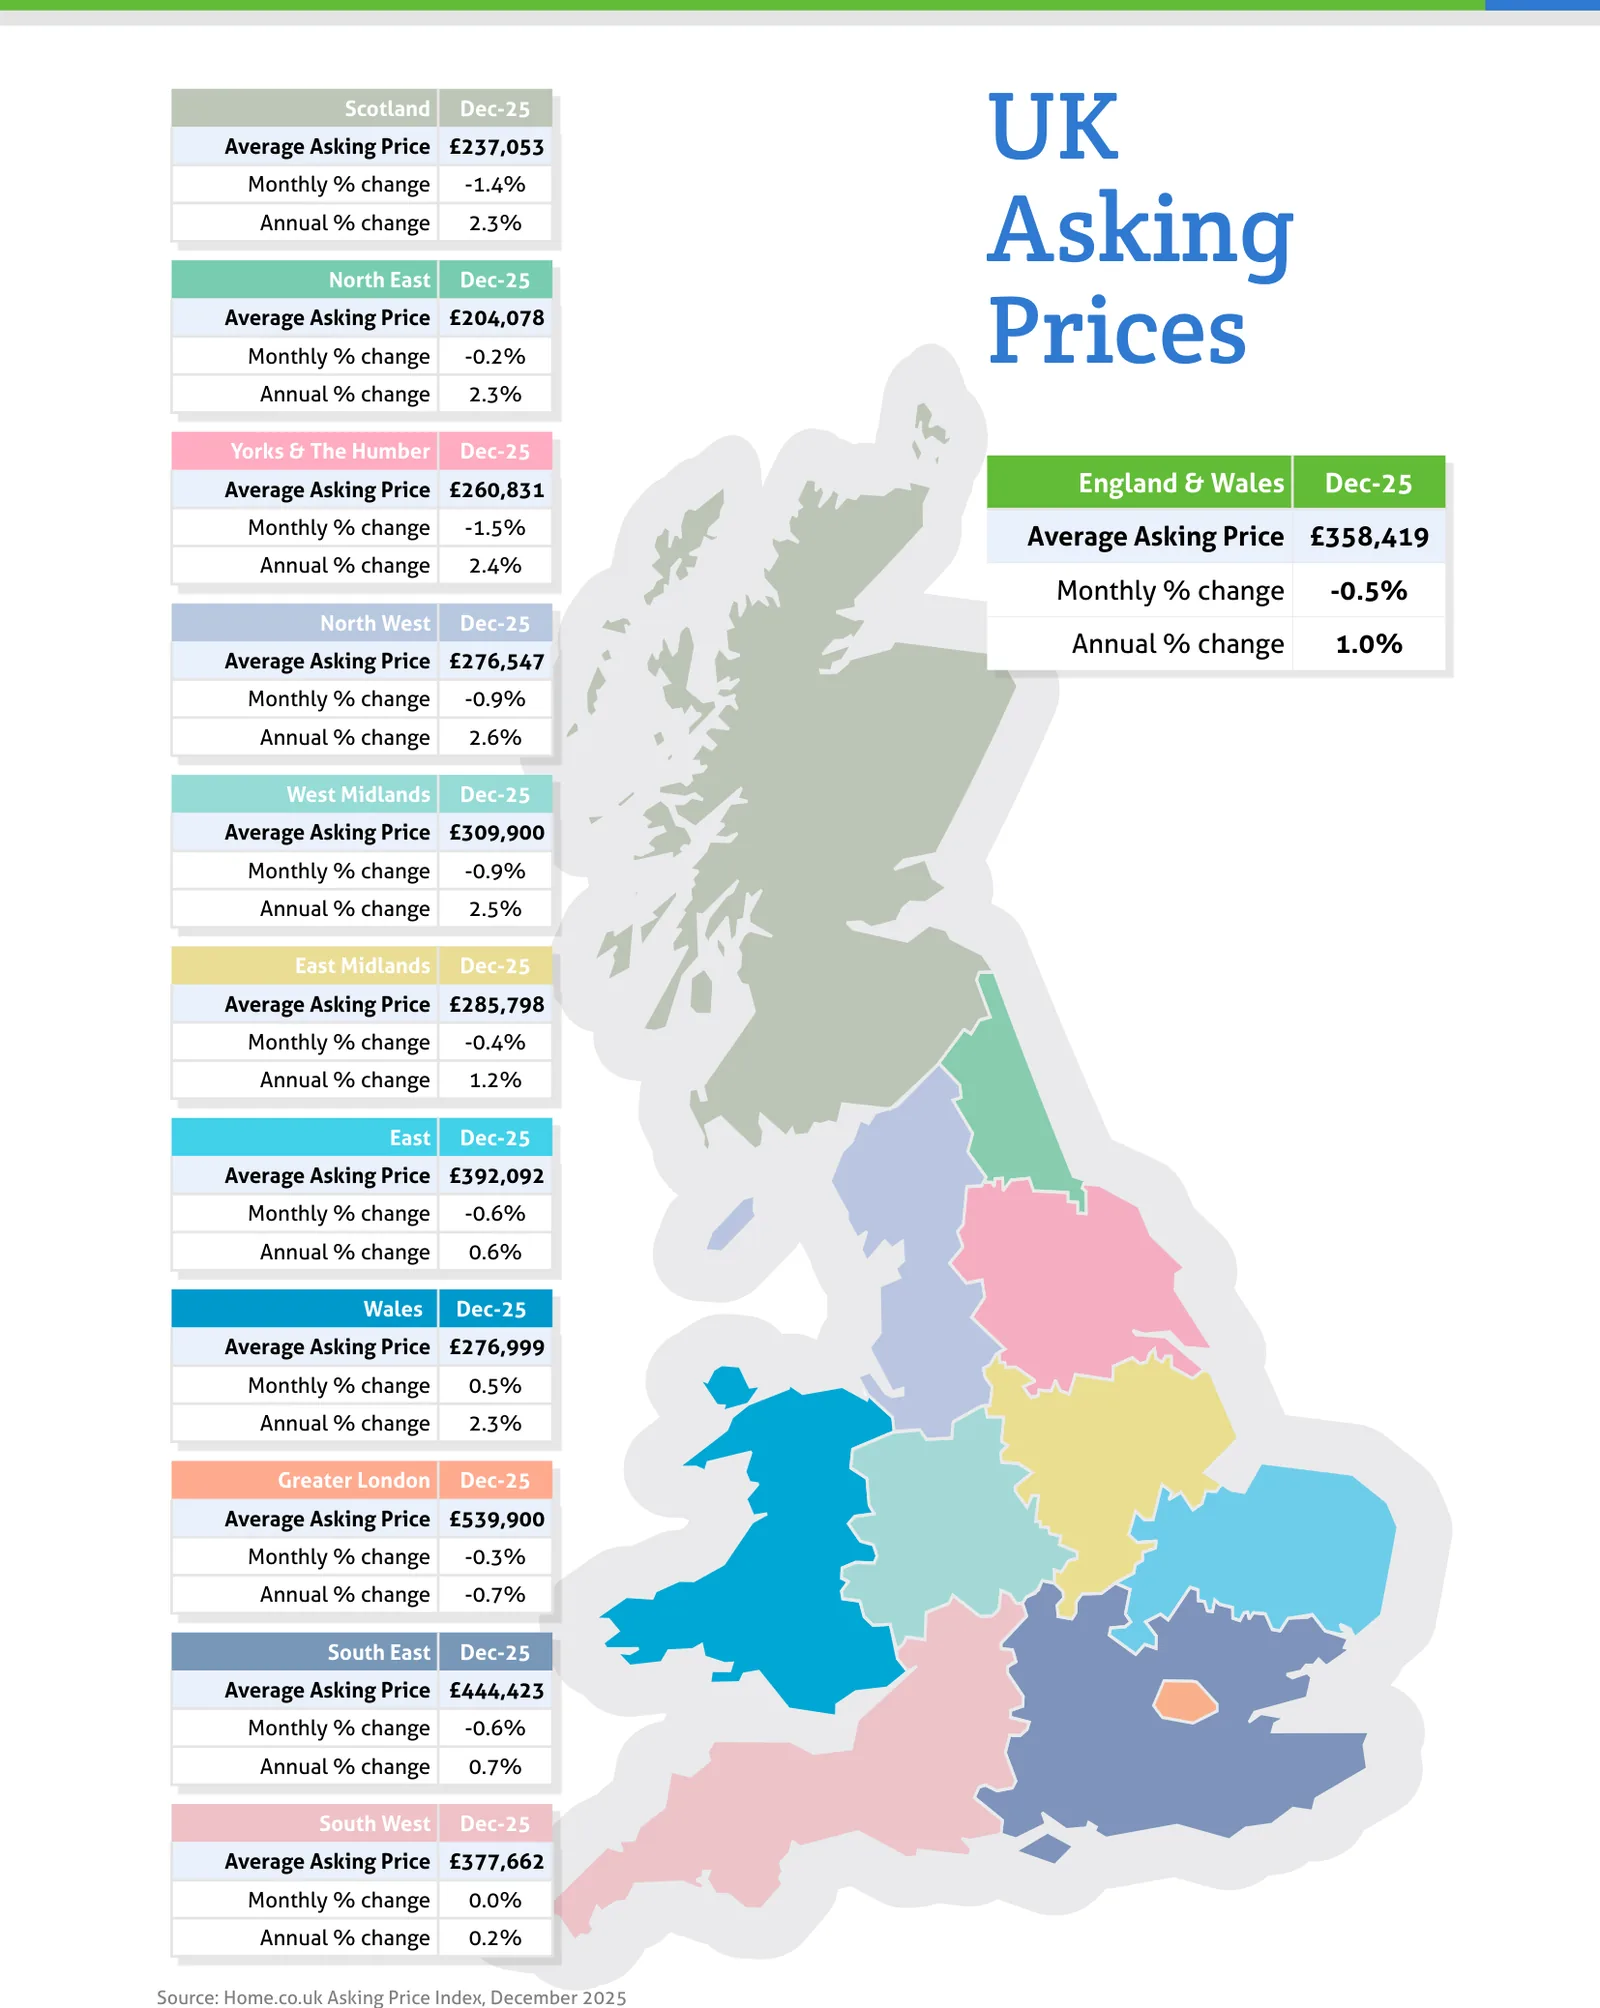
Source: Home.co.uk Asking Price Index, December 2025
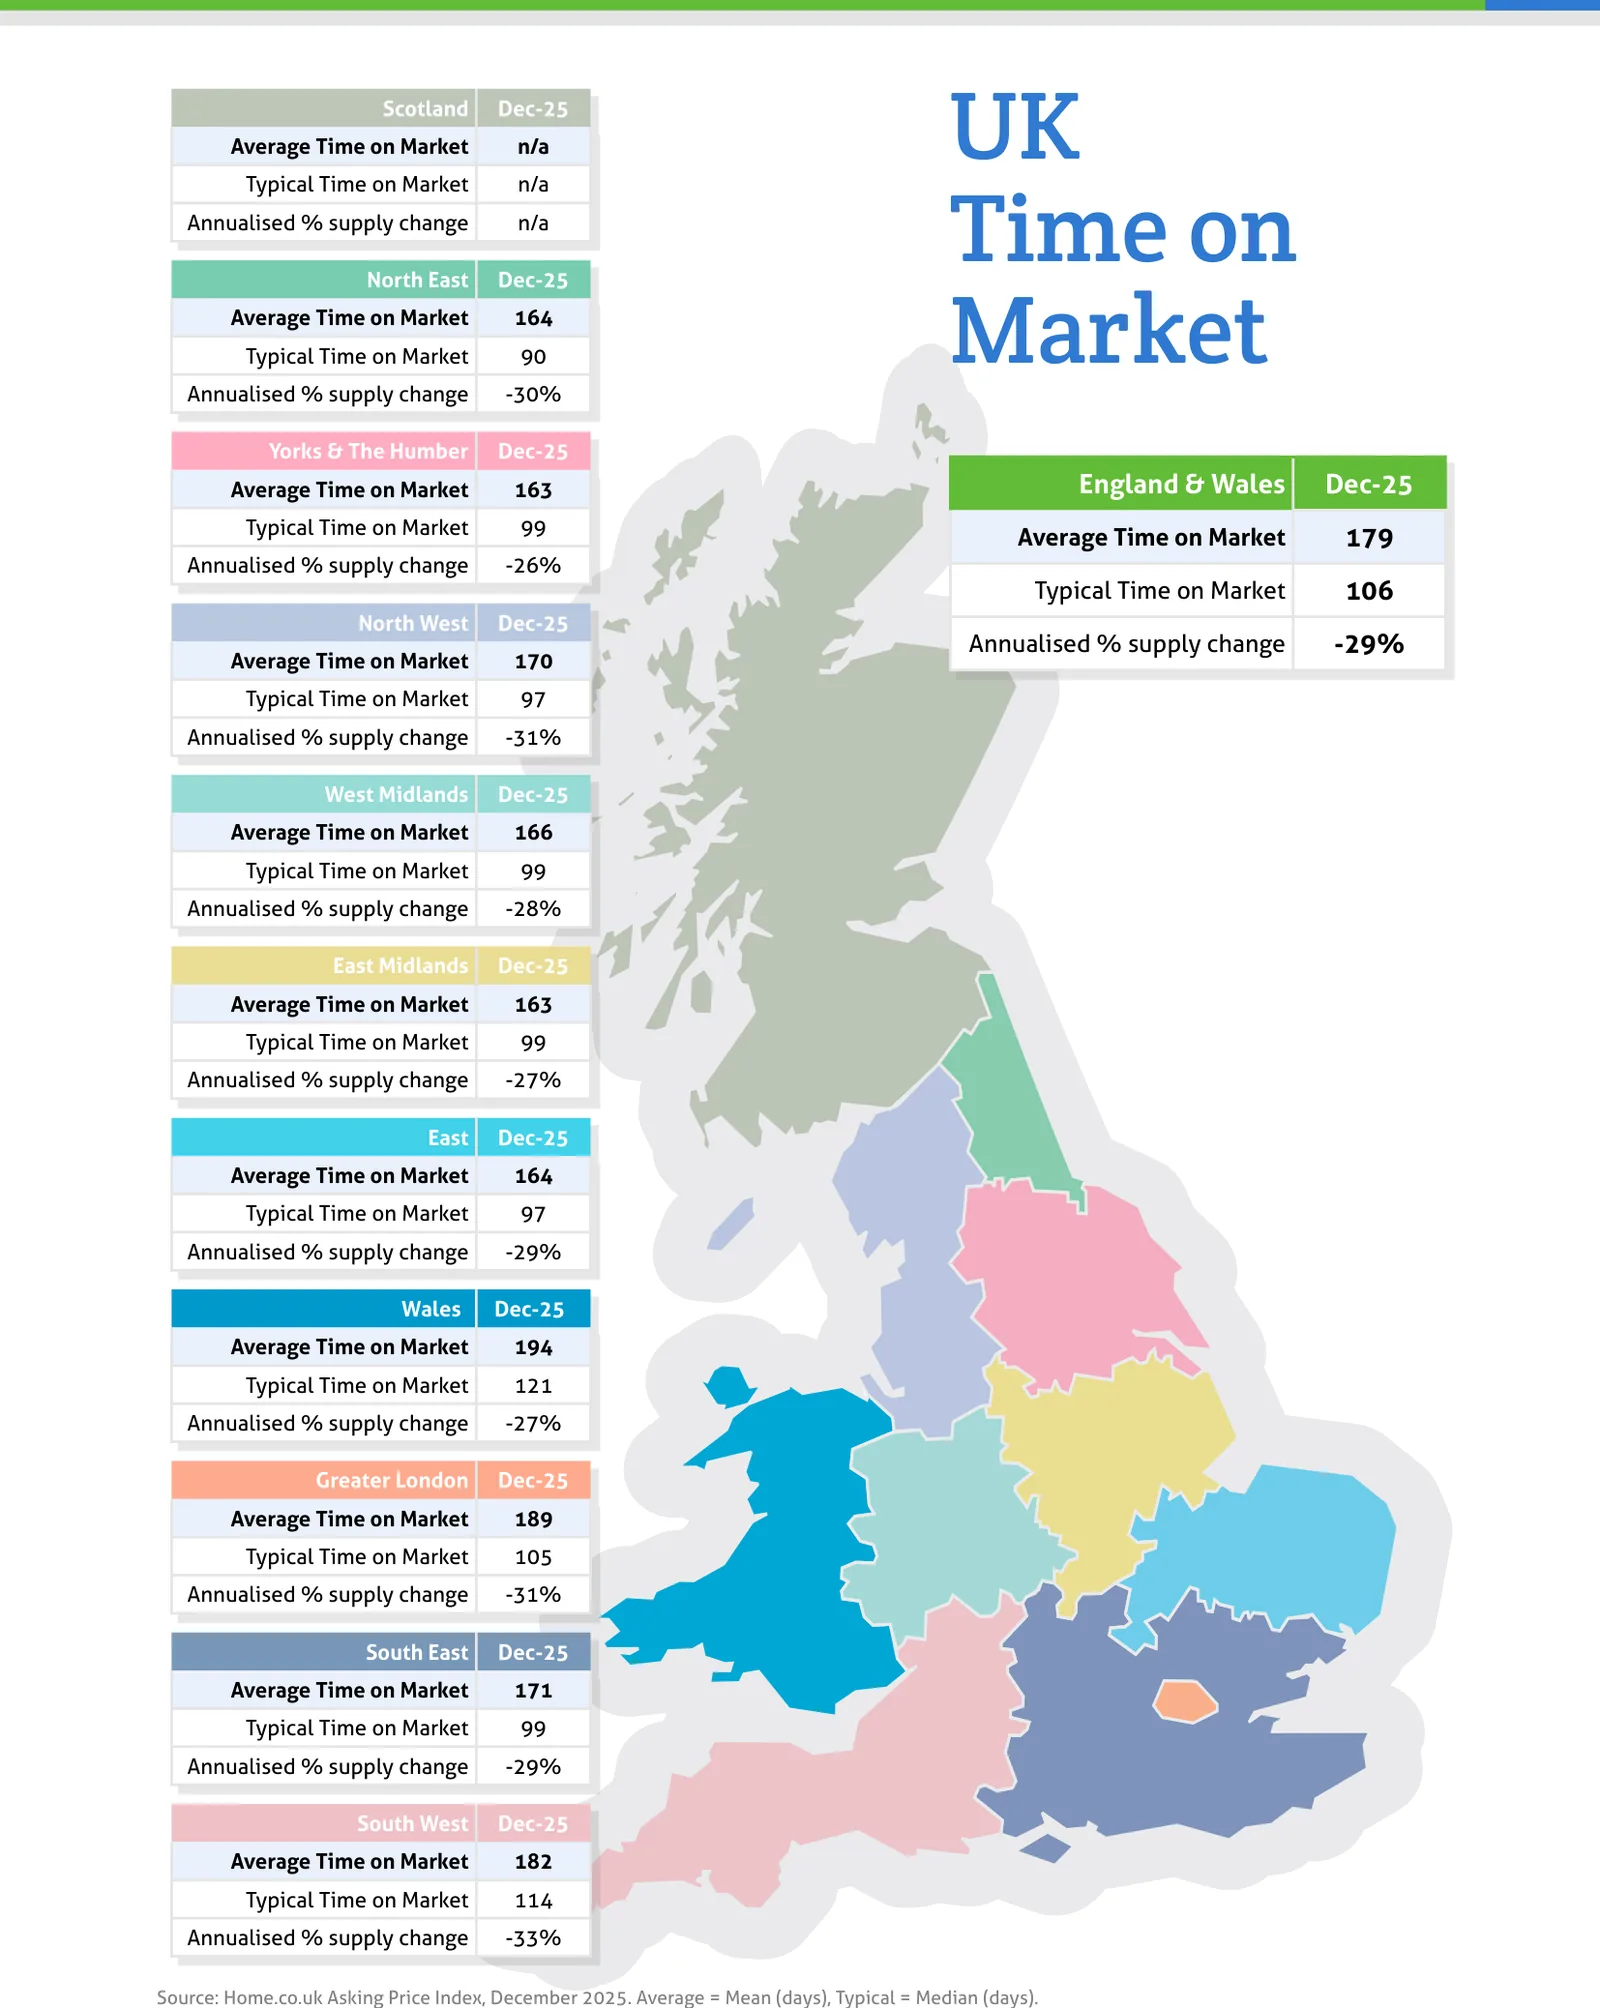
Source: Home.co.uk Asking Price Index, December 2025. Average = Mean (days), Typical = Median (days).
Regional tables
UK Asking Prices, Dec-25
| Region | Average Asking Price | Monthly % change | Annual % change |
|---|---|---|---|
| Scotland | £237,053 | -1.4% | 2.3% |
| North East | £204,078 | -0.2% | 2.3% |
| Yorks & The Humber | £260,831 | -1.5% | 2.4% |
| England & Wales | £358,419 | -0.5% | 1.0% |
| North West | £276,547 | -0.9% | 2.6% |
| West Midlands | £309,900 | -0.9% | 2.5% |
| East Midlands | £285,798 | -0.4% | 1.2% |
| East | £392,092 | -0.6% | 0.6% |
| Wales | £276,999 | 0.5% | 2.3% |
| Greater London | £539,900 | -0.3% | -0.7% |
| South East | £444,423 | -0.6% | 0.7% |
| South West | £377,662 | 0.0% | 0.2% |
UK Time on Market, Dec-25
| Region | Average Time on Market | Typical Time on Market | Annualised % supply change |
|---|---|---|---|
| Scotland | n/a | n/a | n/a |
| North East | 164 | 90 | -30% |
| Yorks & The Humber | 163 | 99 | -26% |
| England & Wales | 179 | 106 | -29% |
| North West | 170 | 97 | -31% |
| West Midlands | 166 | 99 | -28% |
| East Midlands | 163 | 99 | -27% |
| East | 164 | 97 | -29% |
| Wales | 194 | 121 | -27% |
| Greater London | 189 | 105 | -31% |
| South East | 171 | 99 | -29% |
| South West | 182 | 114 | -33% |
Read the full December 2025 edition (PDF, 8 pages)
About the Home Asking Price Index
The Home Asking Price Index measures the change in the prices sellers ask for residential property across England, Wales and Scotland. Today it is computed every month from around half a million advertised homes and is mix-adjusted, so a change in what happens to be on the market does not move the figure; earlier editions state the sample they were built from. Because an asking price is set months before a sale completes, the index runs around five months ahead of completed-sale measures such as the UK House Price Index.
Every edition in the archive, back to October 2006, is listed on the index page. How we measure the UK property market explains the listing data behind it, and today's figures by area are on house prices and rental prices.
Text and figures above are quoted from the December 2025 edition as published, with punctuation normalised for the web, and are not revised. Later editions may restate them.
More in What is happening to house prices: the Home guide
Thinking about your next move?
See what your home's worth in seconds, with the UK's longest-running property data behind it.
Get an instant valuation