

























Home Asking Price Index, April 2026: sales stock surge while London prices slide
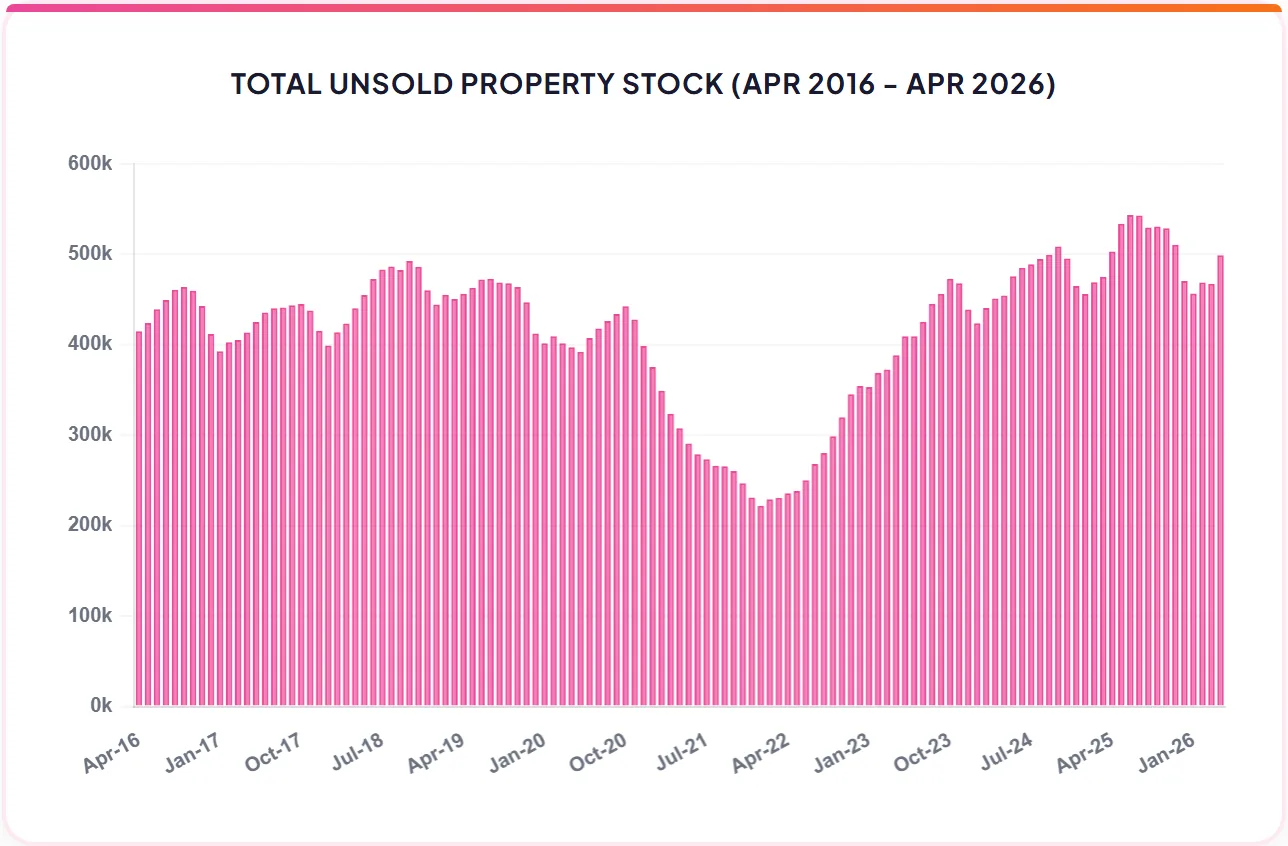
Unsold stock jumped by 31,569 properties in March while London asking prices fell 0.4%, even as annual price growth across England and Wales stayed weak at 0.5%.
This is the April 2026 edition of the Home Asking Price Index, released on 15 April 2026, under the headline:
Sales Stock Surge While London Prices Slide
The headlines and summary below are the report's own words, with the key figures as it published them, followed by the report's charts and regional tables as printed.
Headlines
- Agents' portfolios swelled by 31,569 properties in March. Negative for pricing as demand is on the back foot from rising mortgage rates.
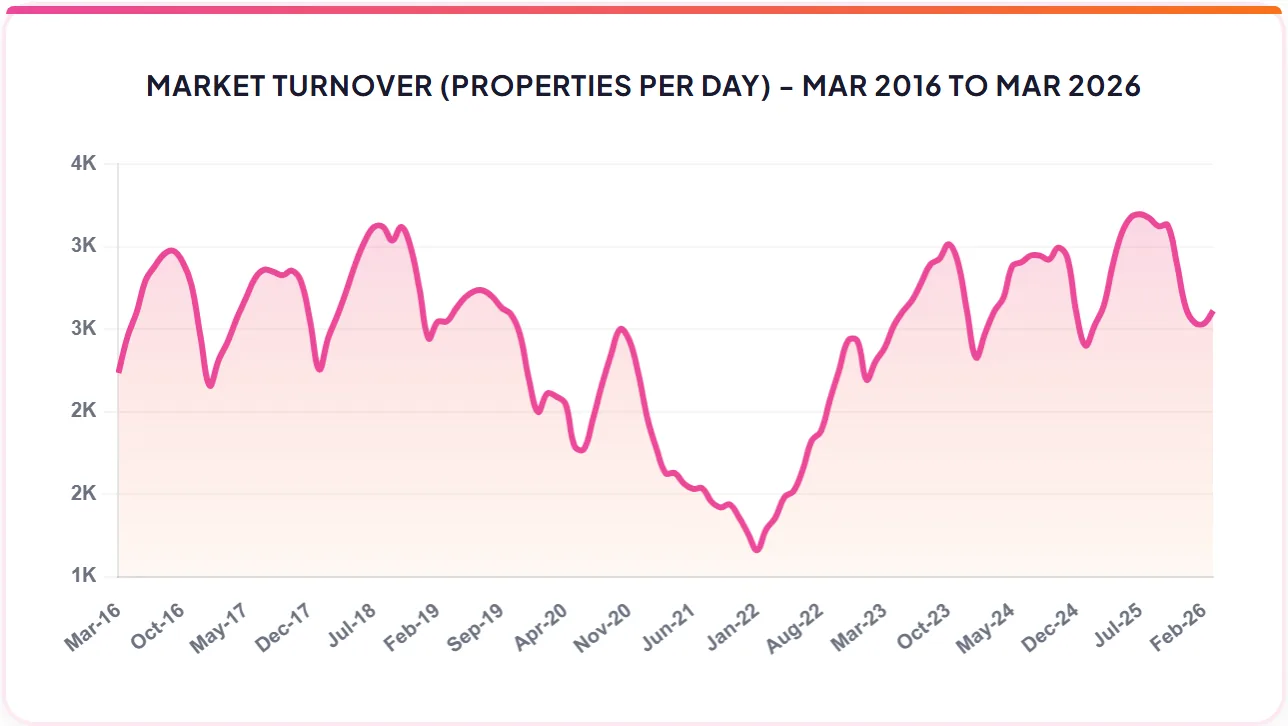
- New instructions in March were the highest since 2008 to 1% more than the already bloated March 2025. Scotland and London saw the largest YoY increases in supply.
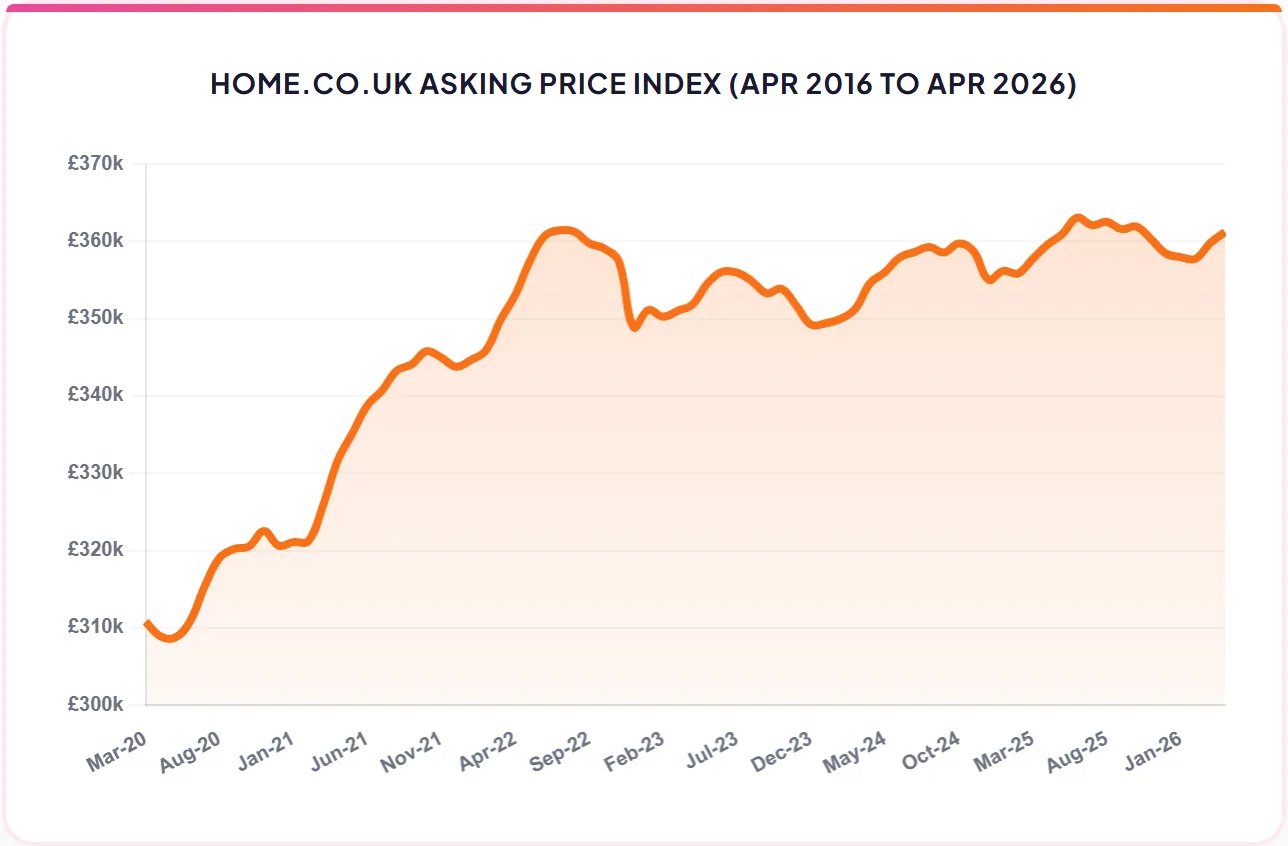
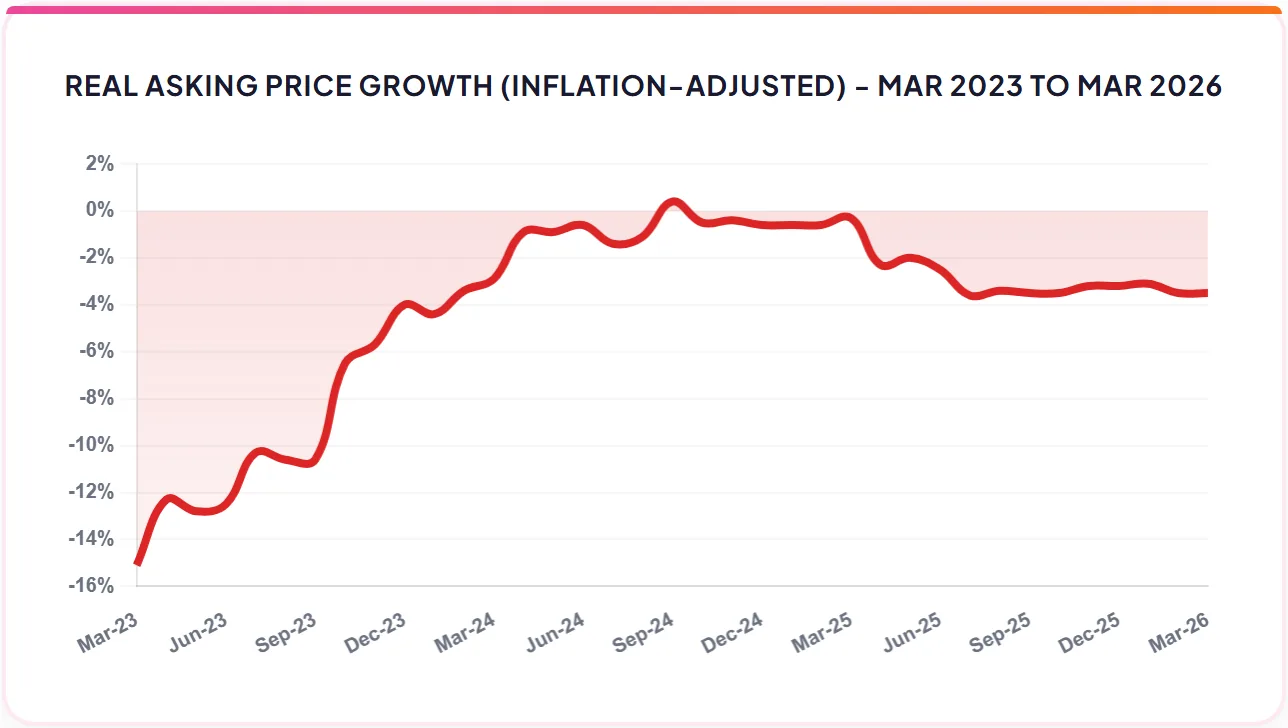
- Mix-adjusted average price for E&W jumped 0.4% in March. Annualised growth remains poor at just 0.5%.
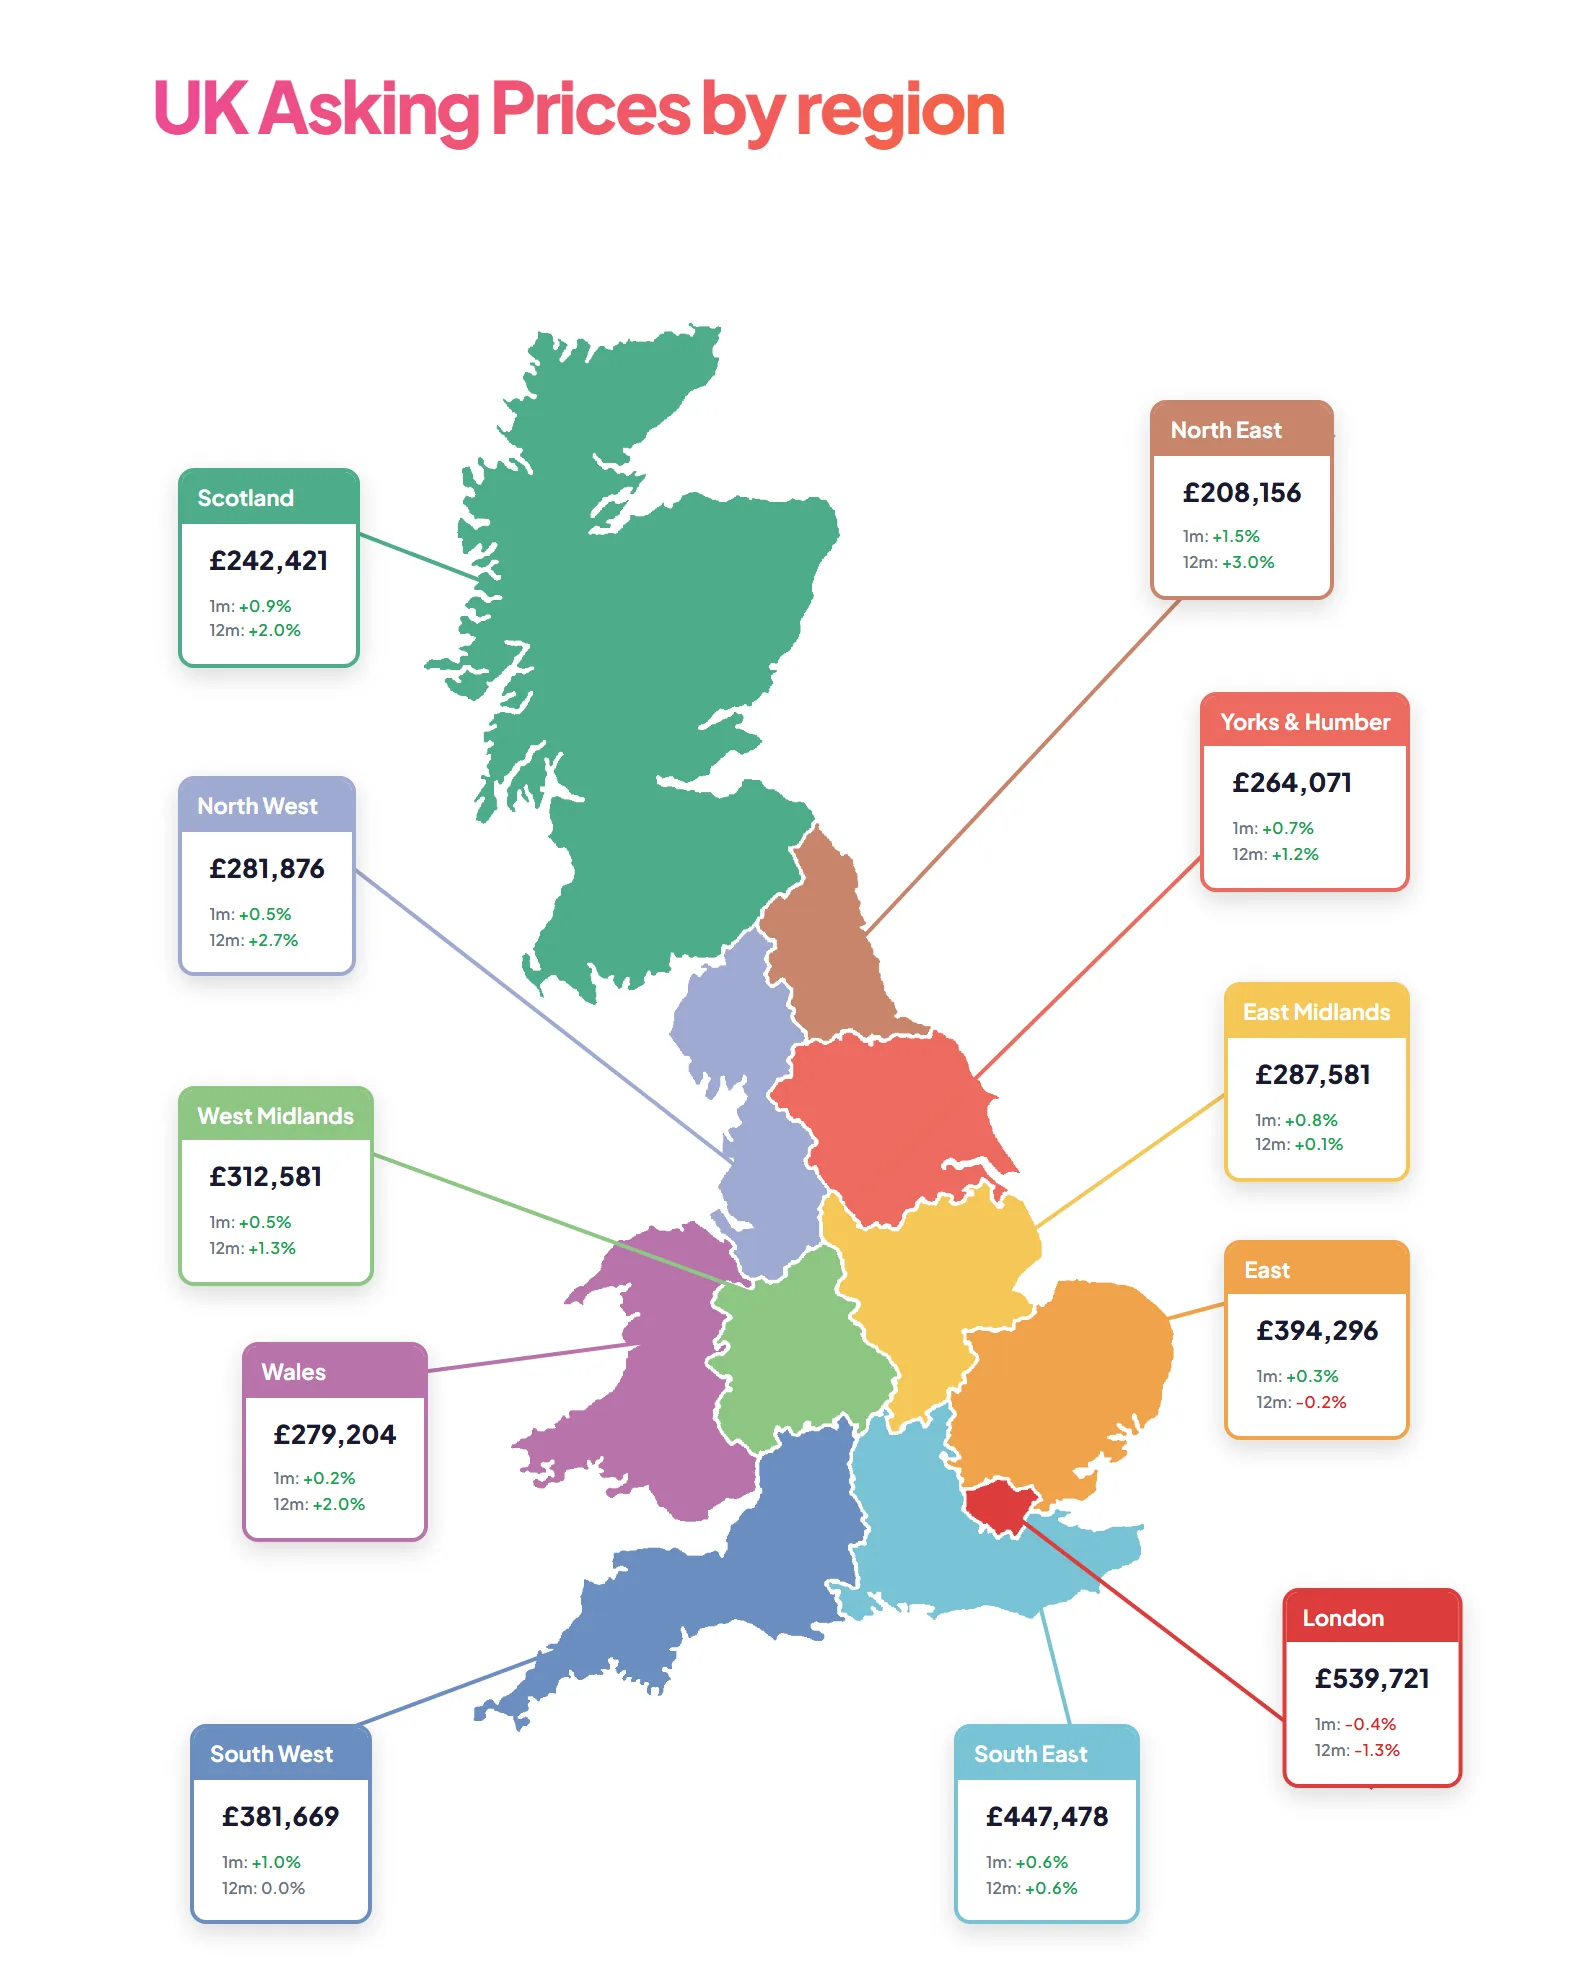
- Prices rose in all regions except London where the average slipped 0.4%. Largest regional rise was North East (+1.5%) where supply is relatively restrained.
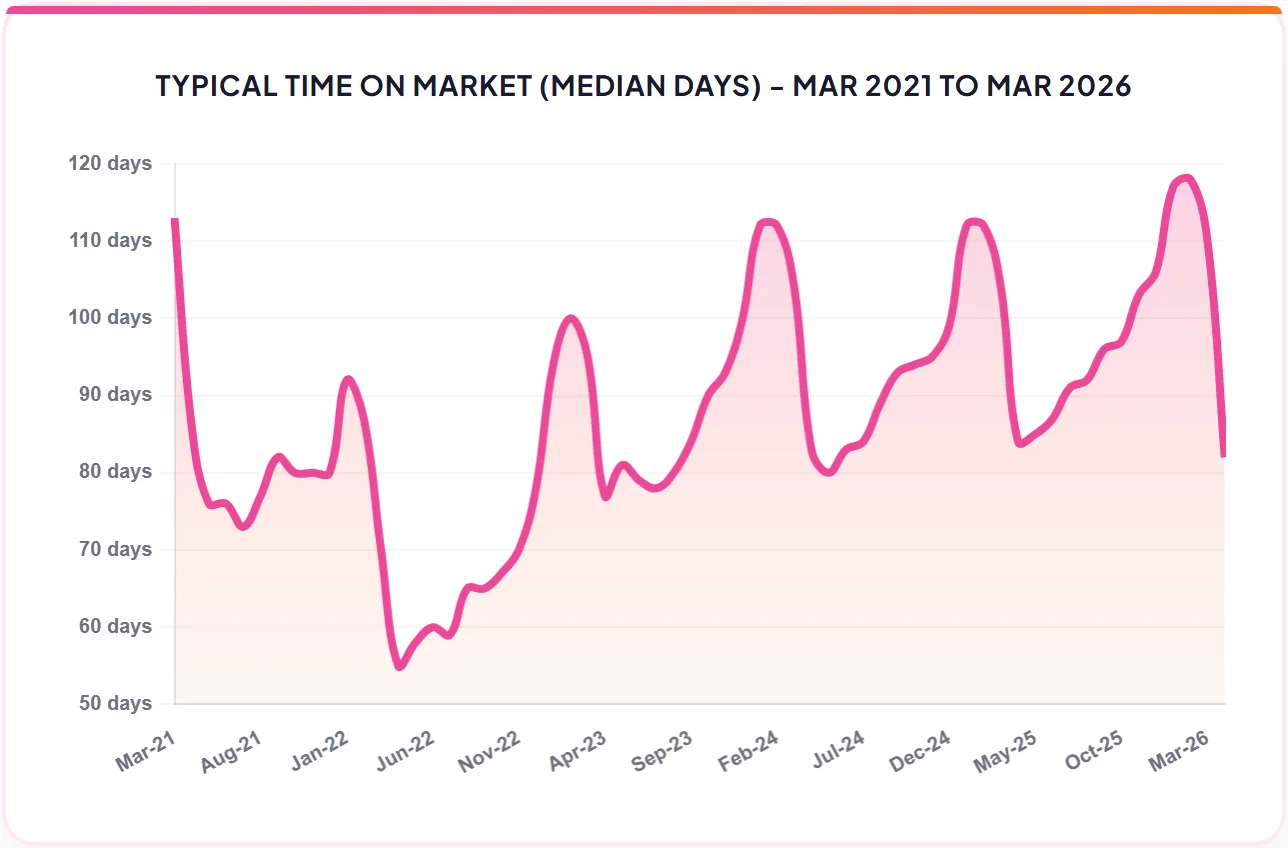
- The flood of new instructions has brought down the Typical Time on Market (median) for unsold properties. However, the mean time on market remains relatively high indicating a significant number of properties are hanging around longer, consistent with heightened stock levels.
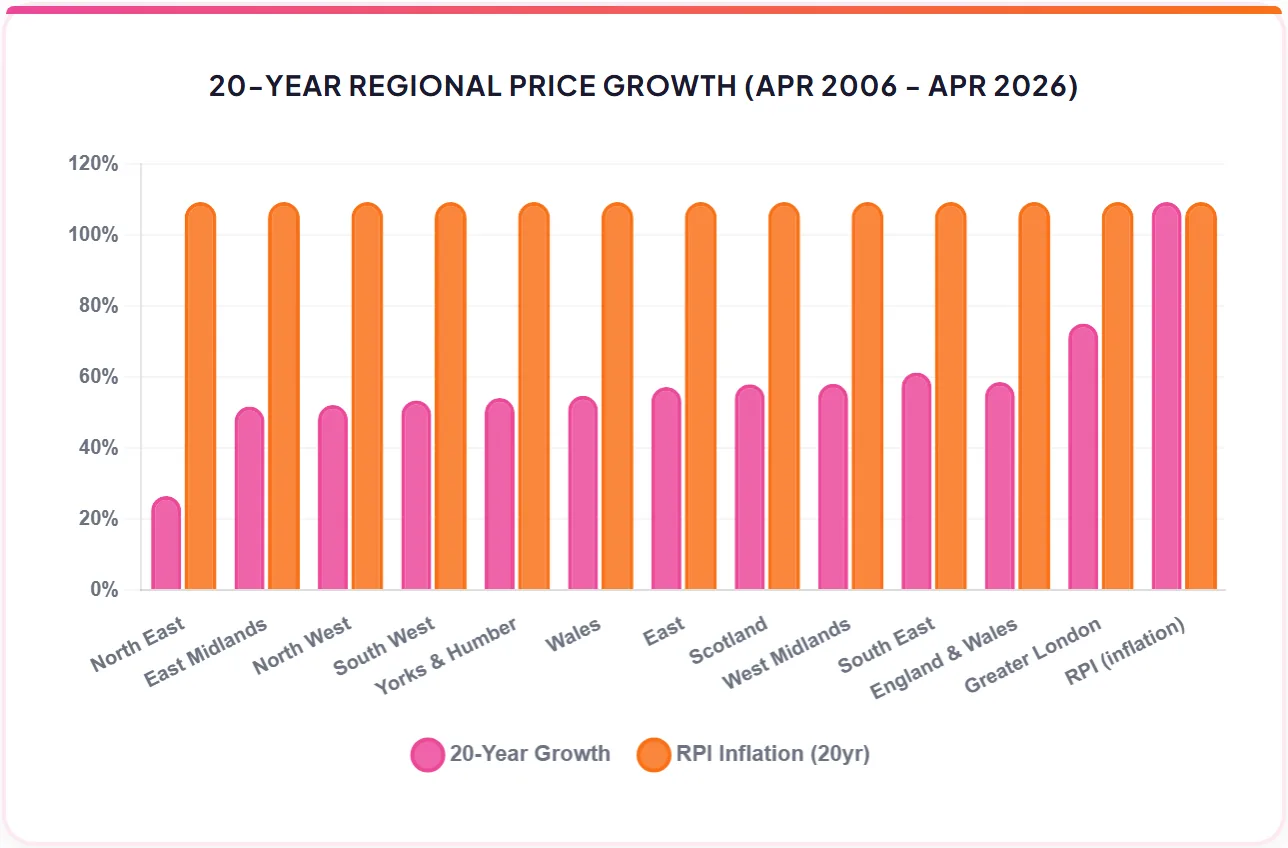
- North East is the top regional growth leader at +3.0% YoY, followed by North West at +2.7%. Greater London is the weakest performer with an annualised decline of 1.3%.
- UK rents are in decline overall. Mix-adjusted average asking rent has fallen 2.3% since April 2025 despite a 10% fall in supply. Affordability constraints are forcing landlords' hands to avoid costly void periods.
- Hackney and Islington show rent rises of 12.8% and 11.4%, while Kensington and Hounslow indicate falls of 6.6% and 7.1%.
Summary
Hopes for more moderate stocks levels are dashed by a steep increase during March. Agents' portfolios collectively swelled by a massive 31,569 properties in England and Wales. This is a negative development for future pricing since demand is firmly on the back foot due to rising mortgage rates.
The UK property market heads into choppy waters. A vast swathe of new sales inventory has arrived on agents' books, priced mainly at pre-Gulf crisis levels, while demand is being strangled by rising mortgage rates. As of now, the Straits of Hormuz remain effectively closed to normal maritime traffic and quite bizarrely the US navy has been sent to 'blockade a blockade'. Vast amounts of contradictory claims in the media only add to the uncertainty.
The knock-on effect of rising energy costs, and therefore inbound inflation, means that instead of the pre-war rate cut expectations we now have rate rise expectations. The only real question is how many rate rises and that answer depends on how long the Straits remain closed. Despite the fragile ceasefire currently in place, the conflict seems far from resolved with both parties poles apart in terms of their respective demands. Hence, the Straits look set to remain under the control of Iran with little or no prospect of shipments of oil or gas in the near future.
Key figures
| Measure | Figure |
|---|---|
| E&W Average Price | £361,207 |
| Monthly change | +0.4% |
| Annual change | +0.5% |
| Typical Time on Market | 82 days |
| Total Unsold Stock | 499,083 |
| Monthly Stock Jump | 31,569 |
| New Instructions YoY | +1% |
| UK Asking Rent Annual Change | -2.3% |
Figures are for England and Wales unless the report states otherwise, as published in the edition.
Charts from the report
Source: Home.co.uk Property Search Index
Source: Home.co.uk HAPI Index
Source: Home.co.uk and Office for National Statistics
Source: Home.co.uk | Note: Average = Mean, Typical = Median days on market of unsold property
Regional tables
UK Asking Prices by region
| Region | Average asking price | 1 month | 12 months |
|---|---|---|---|
| Scotland | £242,421 | +0.9% | +2.0% |
| North East | £208,156 | +1.5% | +3.0% |
| North West | £281,876 | +0.5% | +2.7% |
| Yorks & Humber | £264,071 | +0.7% | +1.2% |
| Wales | £279,204 | +0.2% | +2.0% |
| West Midlands | £312,581 | +0.5% | +1.3% |
| East Midlands | £287,581 | +0.8% | +0.1% |
| East | £394,296 | +0.3% | -0.2% |
| London | £539,721 | -0.4% | -1.3% |
| South East | £447,478 | +0.6% | +0.6% |
| South West | £381,669 | +1.0% | 0.0% |
Regional Time on Market - April 2026
| Region | Average days | Typical days | Annual supply change |
|---|---|---|---|
| East | 155 | 75 | -1.2% |
| East Midlands | 154 | 74 | +3.3% |
| Greater London | 183 | 86 | +3.5% |
| North East | 158 | 70 | -4.2% |
| North West | 165 | 79 | -1.5% |
| South East | 163 | 75 | +2.5% |
| South West | 175 | 86 | +1.3% |
| Wales | 192 | 109 | -7.2% |
| West Midlands | 158 | 74 | +1.5% |
| Yorks & Humber | 157 | 78 | +0.2% |
From the director's commentary
"The current situation reminds me of the surreal beginning of the 2008 crisis. Prices remained suspended in thin air for quite some time before the true reality of the situation sent prices tumbling."
Read the full April 2026 edition
About the Home Asking Price Index
The Home Asking Price Index measures the change in the prices sellers ask for residential property across England, Wales and Scotland. Today it is computed every month from around half a million advertised homes and is mix-adjusted, so a change in what happens to be on the market does not move the figure; earlier editions state the sample they were built from. Because an asking price is set months before a sale completes, the index runs around five months ahead of completed-sale measures such as the UK House Price Index.
Every edition in the archive, back to October 2006, is listed on the index page. How we measure the UK property market explains the listing data behind it, and today's figures by area are on house prices and rental prices.
Text and figures above are quoted from the April 2026 edition as published, with punctuation normalised for the web, and are not revised. Later editions may restate them.
More in What is happening to house prices: the Home guide
Thinking about your next move?
See what your home's worth in seconds, with the UK's longest-running property data behind it.
Get an instant valuation